USDINR trade ideas
Hello, As per today chart Analysis, usdinr support & resistance mark on chart, wait for break out. our new indicator give market Target touches in future. as per Indicator gives bullish market of USDINR. if you like my new AI tool for future market Analysis. like it follow me. share your comment.
Hello, As per chart of USDINR show sideway market, support & resistance mark on chart, wait for break out. as per new indicator analysis, usdinr goes downside to support mark.
Hello, As per USDINR chart, shows support & resistance mark on chart, wait for berak out. as per my analysis its sideway market.
Hello, as per USDINR chart, support & resistance mark on chart, wait for break out. as per indicator give buy side signal on chart, please comment me if our indicator give dot to dot target hit. please share your comment & like my analysis, Support me.
Hello, As per chart of USDINR support & resistance mark in chart, overall trade is bullish. wait for break out.
The USDINR pair made a direct hit on our 82.700 Target, which we set on our last analysis (January 10, see chart below): Right now we see the price pulling back within a Channel Down. This is a standard pattern within the long-term Rising Wedge pattern, which as you see out of 7 Bearish Legs all broke below the 1D MA50 (blue trend-line) and only 1 managed to...
Hello, As per chart USDINR up side resistance mark as red colour & down side support mark as green colour. blue line mark as pivot point. wait for break out. as per my analysis bullish of USDINR
Hello, USDINR support (red) & resistance (Green) level mark, wait for break out. black line mark as stop loss or pivot line. today overall market is bullish trend
hello, today USDINR level mark on chart, wait for break out. upside resistance are mark & below support line. overall today USDINR bullish side. if u like my analysis like & share. with our new indicator market support & resistance automatic mark on chart only trade as per Break out.
hello, As per USDINR chart, still goes down side to retest the level, than goes up. wait for level break.all ready level given last day. if u like my analysis like & share, comment me for more information about new indicator.
Hello, As per chart, USDINR retest down side support 83.3476 / 83.2427 /83.1754 / 83.1051/83.0586 than upside moment show. wait for level break. if u like my analysis & new indicator for help to find out market support & resistance in live.
Hello, As per USDINR chart upside resistance level mark 83.5545 /83.6355 /83.7931 /83.8480 pivot line 83.4630 & down side support 83.3437 /83.2422 / 83.1754. as per my Analysis usdinr still very bullish. wait for break out. Please Like & Follow me, Give comment u like.
hello, TODAY USDINR level Mark, for upside resistance is 83.3278 /83.3660 /83.3956 /83.4411 for upcoming days. & downside support is 83.1016 /83.0759 black line mark as stopples.
Hello, Today USDINR level mark on chart, upside resistance is 83.1021 /1274 / 1295/1857 level mark on chart & support 83.00/ 82.9825
USD INR EW analysis is shown on the chart where Waves 1,2,3,4 are done and 5 move is pending as per the analysis
USD INR long term trend showing the support and resistance and price action channels. The analysis starts way back on 2014.
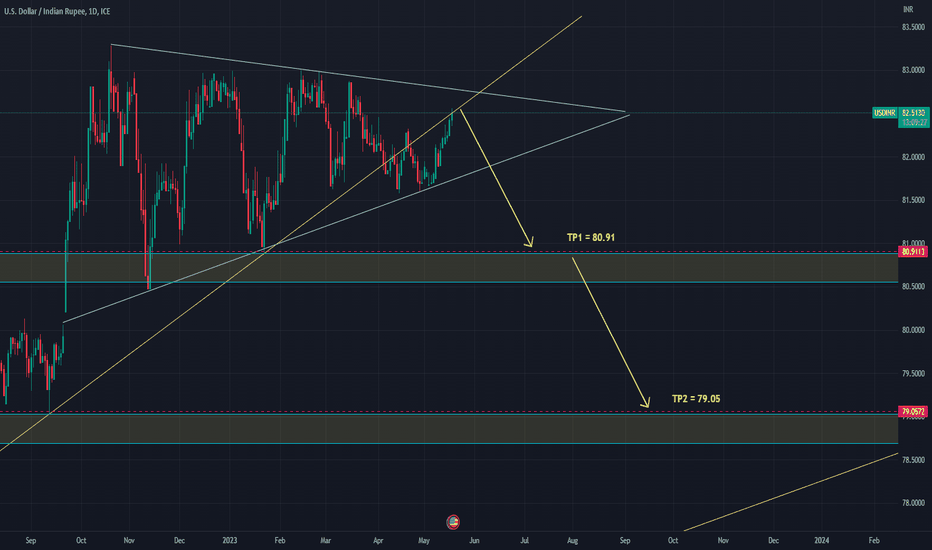
Hi everyone! USD/INR pair long was in one range, thereby a narisova a triangle. Now the price drew already 2/3 triangles. Therefore it is possible to expect it breakdown in the nearest future. I expect breakdown of a triangle down. Now the price is close to the upper bound of a triangle therefore the entrance to the transaction is safe. Stop loss can be delivered...
rounding top like formation in pair indicates lack of srength at higher zones and as long as pair is below 83.20 , it could slip to 82.50 and 82.30 levels


