Wave 4 in Wave Z/y of Y (in progress)FX_IDC:USDINR
Wave 4 in Wave Z or y of Y is in progress which might target to end at 38% - 50% Fib retracement at 73.3 - 73.5.
Wave 5 targets shall be @ 72.65 and 72.40.
USDINR trade ideas


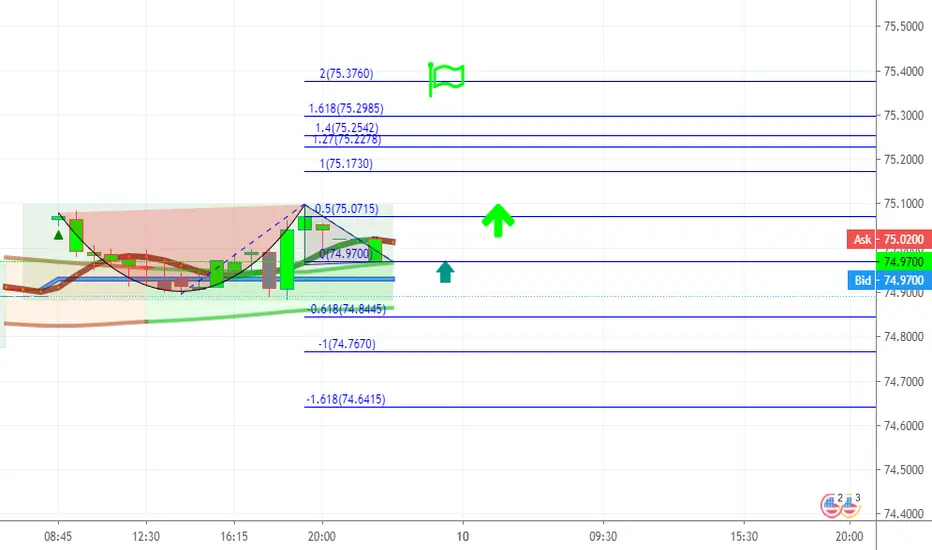
$USDINR Triangle Pattern - Breakout expectedThe Triangle pattern shows some upside movement in the short term. Although the value of this currency pair will go down in medium term, in short term, it will go up & then head downwards.
Buy Price : 74.6494 INR
Stop Loss : 74.1362 INR
Sell Price : T1 : 75.7934
*Ideas are only for experimentation. Not Financial Advice.

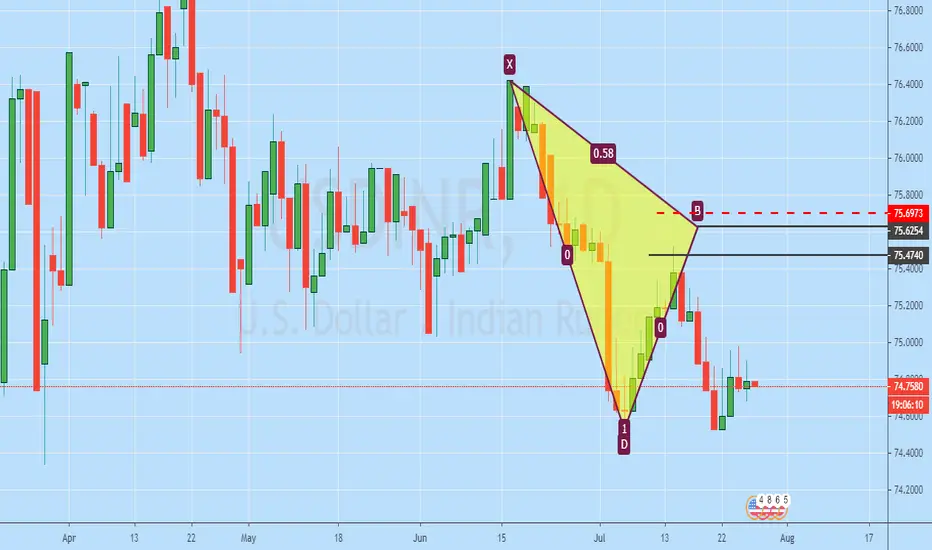
USDINR correction might endFX_IDC:USDINR
The pair is under complex correction.
There is an opportunity for short entry at the end of E wave in triangle expected at 75.09 to 75.3
Target 1: 74.32
Target 2: 73.6 to 73.5


Correction Wave C targeting 73.5FX_IDC:USDINR Pair is under minor correction.
Correction waves A and B are over.
Wave C is in progress and generally it shall have a 5 wave pattern out of which wave (i) and (ii) are over.
Wave (iii) of wave C is in progress targeting 74.0 to 73.5 @
1. 38% retracement of major wave
2. 61% extension of wave - A
3. 100% extension of wave - (i)
4. Historical resistance turning support

USDINR_LONGafter testing weekly support, currency pair has tested 4 H resistance also.. small wall need to be broken for further up move..

USDINR Long-term Sell SignalPattern: Channel Up on 1W.
Signal: Bearish as the price is reversing after a Higher High on the Channel Up, with the MACD making a bearish cross on significant downside potential.
Target: 71.500 (expected Higher Low on a roughly -8.40 decline).
** Please support this idea with your likes and comments, it is the best way to keep it relevant and support me. **


INRUSD : 4hr R/S analysis INRUSD : it could respect R level rectangle area on chart after heavy breakout of Pause 1, FX_IDC:INRUSD

1W Wave 3 is under correction in 1D wave 41M chart
New trend is identified after correction and is marked with a vertical line.
1W chart analysis is focused on new trend.
Price action is trading through Impulse wave 3 targeting 81.5
1D chart analysis is focused on Wave 3-Impulse and after the 1W vertical line
Impulse wave-3 of 1W chart is under Wave-4 correction in 1D chart.
Wave 4 targets 38.4 to 50% Fib retracement zone which marks at the previous resistance zone between 74.48-73.87
1H chart analysis is focused on 1D Wave 4-Correction
Correction wave C is in progress which targets 73.6 however it might bounce up at 74.48-73.87
1D Wave 4-Correction might end at 73.6 on the worst case and the price is expected to resume its uptrend to form 1D Wave-5 which can target 78.0 is equivalent to 1D Wave 1-Impulse move range


USDINR Multi Time Frame Analysis 14.06.2020Price under consolidation between 75 and 76.
1D close above 76.0 shall signal trading long.
1D close below 75.0 shall open ways to reassess any pattern formations
Please post your agreements / disagreements and support building myself and preventing losses.
Thank You

USDINR at significant OverHead ResistanceUSDINR is currently facing major resistance from all time highs. A breakout above these would validate long entries

USDINR aiming for 78!USDINR LOOKS LIKE BREAKING THE TRIANGLE. A SUPER FAST LAST LEG to 78 IS EXPECTED.


USDINR may be heading up soon.USDINR looks all set to break out from a triangle formation. We can expect a rally towards 77 levels.
Break below 74.90 would invalidate the outlook.
