Historic Long Opportunity Bigest Reversal Pattern ?!! USD JPY According to Head & shoulders on Weekly Time frame
Convergence On CCI
So Crazy Opportunity !!! we wil see it
USDJPY_TOM trade ideas

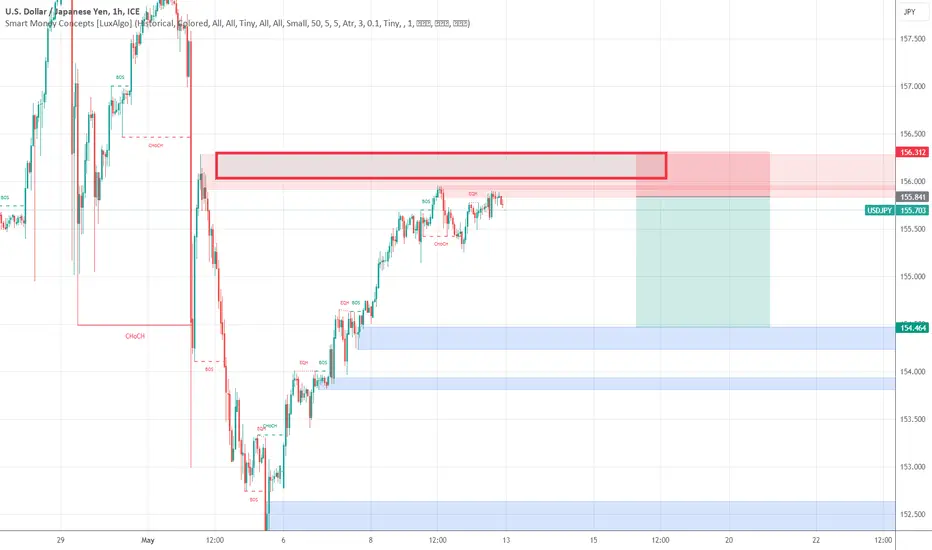
USDJPY Time to SHORT !
Its now right time for USD weakness and JPY strength - both Technical and upcoming Macroeconomic calendar indicators confirm the idea of stronger JPY against a weaker USD.
More important is lack of Macroeconomic events atleast for upcoming 1 week , which usally corresponds to Lower demand in USD.
The Area above in RED is the BEST shorting area ! with low tight stop and target no.1 at the dotted dashed line

View on USDJPY1.If DOLLAR goes to short we may see a huge drop on USDJPY.
2.If this major Resistance broken the next resistance is 177.
3.If the support zone broken the target1 is 147 and target2 141

USDJPY: Potential areas for further BOJ interventionsThese are the places where the Bank of Japan might step in to influence the market, but they won't announce it when they do. so be extremely careful as the price rapidly decreases

Selling usdjpy below 160 targeting 142.00-On this daily chart i see an interesting bearish big shadow that is sparking my interest in shorting uj.
-The big shadow, is a 2 candle-stick reversal signal where the trigger candle completely engulfs the previous candle.
-

No idea that goes as right as that Due to this buildup to historic extreme. No likely to continue above beyond.

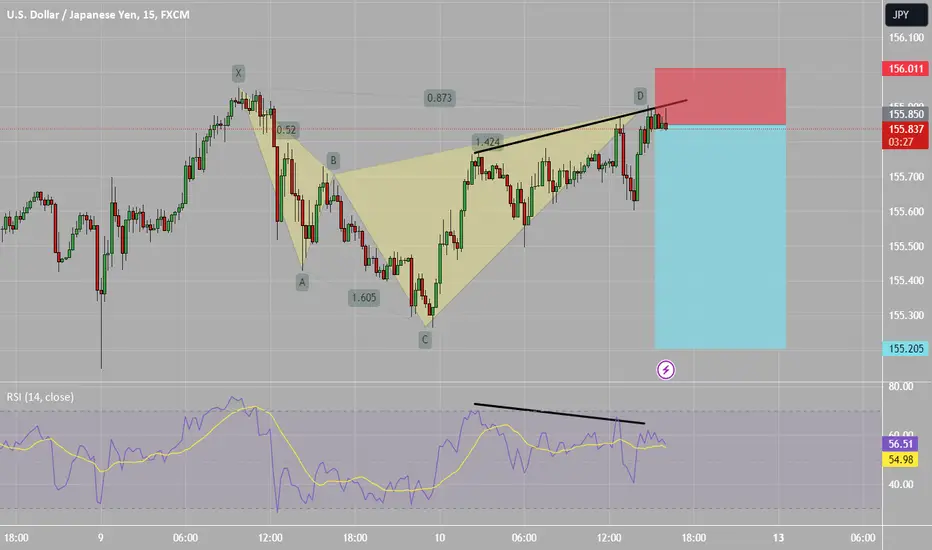
RR=4 sell ideaprice at resistance level + bearish shark pattern + RSI divergence ; price might reverse and retest 155.2
PS never risk more than 2% of your capital per trade
PERFECT BUY TRADE FOR USDJPY... Here you can see the USDJPY is trading within an up trend channel. The resistance levels have been broken and it is clear to see that the currency pair will continue to rise.

It's summer but it feels like fallAll ideas are strictly my interpretation of price action. I am not a professional trader nor are these ideas professional advice.

USDJPYWe took our target.
As we analyzed in last analysis, price took a sudden upward move and hit our target area.

USDJPYLooking for a buy signal.
Reason to buy, break the pullback price.
Taking 1.1 risk ratio.
Use proper risk management.
Thank you

USDJPYIn 5 and 1 minute charts, price is in a cone pattern. so if it break which side we took that side entry. now looking for a sell opportunity. if it hit the buy stoploss.
Use proper risk management.
Thank you

USDJPY: Areas in which the BOJ may intervene againUSDJPY: Areas in which the BOJ may intervene again
In this video, I explained the areas where the Bank of Japan can intervene in the market.
Be careful as they won't send any messages when this happens.
You will only see the price drop rapidly.
📺You may watch the video for further details📺
Thank you and Good Luck!
❤️PS: Please support with a like or comment if you find this analysis useful for your trading day❤️

USDJPY Looking for correction ??The USD/JPY pair has completed the impulsive wave sequence labeled as 1-2-3-4-5 and is now entering a corrective phase, typically labeled as A-B-C. The price has already formed waves A and B and is currently progressing towards wave C, which is expected to extend to the 1.618 Fibonacci extension level.
Additionally, the formation of a head and shoulders pattern suggests a potential reversal or a downward correction in the price. Here’s a written summary of the analysis:
USD/JPY Technical Analysis: - Impulsive Waves: Completed (1-2-3-4-5) - Corrective Waves: In progress (A-B-C) - Wave A: Completed - Wave B: Completed - Wave C: Targeting 1.618 Fibonacci extension Pattern Analysis: - Head and Shoulders pattern observed, indicating a potential reversal or correction.


USD/JPYA "bullish flag" is a continuation pattern frequently observed in technical analysis. It typically occurs within an uptrend and is characterized by a brief consolidation or sideways movement, followed by a breakout to the upside, resuming the prior upward trend.
Here's how it forms and its main characteristics:
1. **Flagpole**: The bullish flag pattern begins with a strong upward price movement called the flagpole. This part represents the initial impulse or momentum phase of the trend.
2. **Flag**: After the flagpole, there's a period of consolidation where the price trades sideways or retraces slightly against the prior trend. This consolidation phase forms a rectangular or parallelogram-like pattern, hence the name "flag."
3. **Breakout**: The bullish flag pattern is confirmed when the price breaks out of the consolidation phase to the upside, indicating that the prior uptrend is likely to continue.
Traders typically look for the following characteristics when identifying a bullish flag pattern:
- The flagpole should exhibit strong upward momentum and preferably be accompanied by above-average volume.
- The flag portion should be relatively shallow and form on decreasing volume, signaling a temporary pause in the trend.
- The breakout from the flag should occur on increased volume, confirming the resumption of the uptrend.
Once the bullish flag pattern is identified and confirmed, traders often use it as a basis for entering long positions, with stop-loss orders placed below the low of the flag pattern to manage risk. Additionally, the height of the flagpole can be used to set price targets for potential profit-taking, although this is not a strict rule.
As with any technical pattern, it's essential to consider other factors such as market context, fundamental analysis, and risk management strategies when making trading decisions based on bullish flag patterns.

USDJPY Buy !!Ever since the time price got pushed up from the 151.852 support , it has continued the upward movement . the upward move however isn't supported by a lot of momentum , nevertheless price continues to strive upwards ! Price recently reached the 0.618 Fibo retracement of the last move downward and despite its effort to move downwards , continued the upward movement. the next Target is the pivot point at 156.282 , which would be my intended Target as well !

Fundamental Market Analysis for May 10, 2024 USDJPYUSDJPY:
USDJPY is trading near 155.70 on Friday in the early hours of Asian trading. Renewed demand for the US dollar (USD) is lifting the pair. However, verbal intervention and hawkish commentary from Bank of Japan (BOJ) Governor Kazuo Ueda may limit the decline in the Japanese Yen (JPY) for now.
San Francisco Fed President Mary Daly said Thursday that the central bank may need more time to bring inflation back to target as uncertainty about inflation over the next few months has increased. Other Fed officials this week also indicated they favored keeping rates at current levels for longer. This, in turn, could lead to a stronger dollar and create a tailwind for USD/JPY.
Financial markets expect the US central bank to hold policy for the rest of the year as it seeks "greater confidence" in inflation, with Fed Chairman Jerome Powell emphasizing that it may take longer than expected to achieve that confidence."
Bank of Japan Governor Kazuo Ueda said on Thursday that the central bank will scrutinize the yen's recent weakness when setting monetary policy, according to Reuters. The hawkish comments raised expectations of higher short-term borrowing costs in the coming months, which provided some support for the Japanese yen and led to a decline in USD/JPY yesterday. Verbal intervention from the Japanese authorities is likely to limit the pair's near-term gains. Early Friday, Japan's Finance Minister Shunichi Suzuki once again said that he would take necessary measures against the foreign currency if necessary.
Trading recommendation: Trade mainly with Buy orders from the current price level

The Rebound Effort of USD/JPY Hindered by Japan's Hawkish BiasSummary of Opinion: The Bank of Japan's (BoJ) opinions indicate that many key members advocate for a Japanese interest rate hike as inflation may persist longer or even surpass the target.
The release of the Bank of Japan's Summary of Opinion document this morning revealed the possibility of Japan raising interest rates earlier than previously estimated. This hawkish bias restrained the rise of USD/JPY just below the 156.00 threshold in Thursday's (May 9) trading.
The BoJ's Summary of Opinion shows that many key policy board members are calling for a stable interest rate hike. This is driven by the prospect of long-lasting inflation or even exceeding the central bank's 2% target. One member stated that the BoJ should raise interest rates in a "proper and timely manner" in line with increasing growth and price projections.
"If the forecasts shown in our April quarterly report come true, the 2% inflation target will be achieved sustainably and steadily in about two years, and the output gap will turn positive," expressed another member. "Therefore, there is a possibility that our policy interest rates will be higher than current market expectations."
On a separate occasion, BoJ Governor Kazuo Ueda outlined the possibility of raising interest rates several times in the coming months. He stated before the Japanese Parliament this morning, "If currency volatility affects, or risks affecting, inflation trends, (then) the BoJ must respond with monetary policy."
Several hawkish signals from the BoJ have successfully countered the recent weakening of the yen — which occurred after the fading impact of Japanese interventions. USD/JPY halted its rebound efforts, while market participants reconsidered the prospects of Japanese interest rate hikes. GBP/JPY and EUR/JPY rallies also slowed down.
Many experts predict that the BoJ will raise interest rates by the end of this year, but there are differing opinions regarding the timing, amount, and frequency. Some also argue that the BoJ will announce an intention to reduce large-scale bond purchases and begin shrinking its balance sheet — a relatively easier monetary policy tightening measure compared to a rate hike.

Sell USDJPY Channel BreakoutThe USD/JPY pair on the M30 timeframe presents a potential shorting opportunity due to a recent downward breakout from a well-defined bearish channel pattern. This breakout suggests a shift in momentum towards the downside and a higher likelihood of further declines in the coming hours.
Key Points:
Sell Entry: Consider entering a short position (selling USD/JPY) below the broken support level of the channel, ideally around 155.60 after confirmation of the breakout. This offers an entry point close to the perceived shift in momentum.
Target Levels: Initial bearish targets lie at the previous support levels within the channel, now acting as potential resistance zones:
154.74: This represents the first level of support within the channel.
154.27: This is a further extension of the downside target, based on the height of the recent price movement before the breakout.
Stop-Loss: To manage risk, place a stop-loss order above the broken support line of the channel, ideally around 156.60. This helps limit potential losses if the price unexpectedly reverses and breaks back upwards.
Thank you

USDJPY surged to multi-decade highs around 154.80Earlier in the week, USDJPY surged to multi-decade highs around 154.80 before retracing slightly from those lofty levels as the weekend approached. If the downward reversal gains traction in the upcoming trading sessions, support looms at 153.20 and 152.00 thereafter, with 150.80 possibly becoming a focal point if these price thresholds are breached.
On the flip side, if USDJPY resumes its climb, resistance is likely to materialize near 154.80, followed by 156.00, the upper boundary of a short-term rising channel in place since December of last year. While the pair maintains a bullish outlook, it's essential to proceed with caution given the overbought market conditions and the increasing probability of FX intervention by the Japanese government.

USD/JPY H4 | Potential bullish bounceUSD/JPY is falling towards a pullback support and could potentially bounce off this level to climb higher.
Buy entry is at 155.33 which is a pullback support.
Stop loss is at 154.84 which is a level that lies underneath the 23.6% Fibonacci retracement level.
Take profit is at 157.03 which is an overlap resistance.
High Risk Investment Warning
Trading Forex/CFDs on margin carries a high level of risk and may not be suitable for all investors. Leverage can work against you.
Stratos Markets Limited (www.fxcm.com):
CFDs are complex instruments and come with a high risk of losing money rapidly due to leverage. 68% of retail investor accounts lose money when trading CFDs with this provider. You should consider whether you understand how CFDs work and whether you can afford to take the high risk of losing your money.
Stratos Europe Ltd, previously FXCM EU Ltd (www.fxcm.com):
CFDs are complex instruments and come with a high risk of losing money rapidly due to leverage. 70% of retail investor accounts lose money when trading CFDs with this provider. You should consider whether you understand how CFDs work and whether you can afford to take the high risk of losing your money.
Stratos Trading Pty. Limited (www.fxcm.com):
Trading FX/CFDs carries significant risks. FXCM AU (AFSL 309763), please read the Financial Services Guide, Product Disclosure Statement, Target Market Determination and Terms of Business at www.fxcm.com
Stratos Global LLC (www.fxcm.com):
Losses can exceed deposits.
Please be advised that the information presented on TradingView is provided to FXCM (‘Company’, ‘we’) by a third-party provider (‘TFA Global Pte Ltd’). Please be reminded that you are solely responsible for the trading decisions on your account. There is a very high degree of risk involved in trading. Any information and/or content is intended entirely for research, educational and informational purposes only and does not constitute investment or consultation advice or investment strategy. The information is not tailored to the investment needs of any specific person and therefore does not involve a consideration of any of the investment objectives, financial situation or needs of any viewer that may receive it. Kindly also note that past performance is not a reliable indicator of future results. Actual results may differ materially from those anticipated in forward-looking or past performance statements. We assume no liability as to the accuracy or completeness of any of the information and/or content provided herein and the Company cannot be held responsible for any omission, mistake nor for any loss or damage including without limitation to any loss of profit which may arise from reliance on any information supplied by TFA Global Pte Ltd.
The speaker(s) is neither an employee, agent nor representative of FXCM and is therefore acting independently. The opinions given are their own, constitute general market commentary, and do not constitute the opinion or advice of FXCM or any form of personal or investment advice. FXCM neither endorses nor guarantees offerings of third-party speakers, nor is FXCM responsible for the content, veracity or opinions of third-party speakers, presenters or participants.
