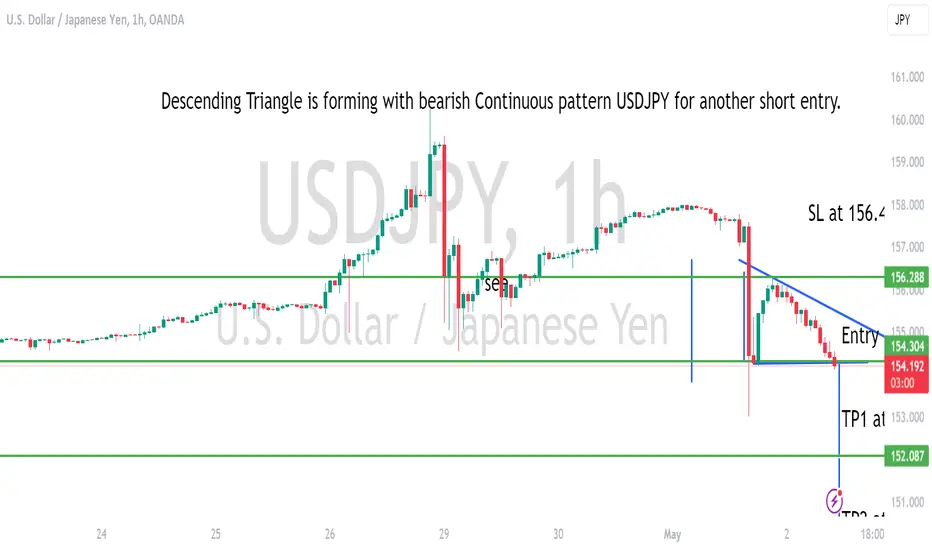
USDJPY another possible Short EntryDescending triangle is forming indicating a possible bearish continuous trend. This is not a Financial Advice just DYOR
USDJPY_TOM trade ideas
Flash Crash to Setup Mega Rip in USDJPY?Massive surge in the Yen at resistance and then a follow through drop.
The likelihood of a strong reaction in the 160 was discussed in the post below:
Question is, what happens now?
If that's a true reversal then we're going to see crush and re-crush action in this. Consistently lower lows. Sharp rallies. Crushing new lows.
However, if we make a low in this area - this might be the last big correction before the realisation of the generational USDJPY bullish breakout.

USDJPY: Growth & Bullish Forecast
Balance of buyers and sellers on the USDJPY pair, that is best felt when all the timeframes are analyzed properly is shifting in favor of the buyers, therefore is it only natural that we go long on the pair.
❤️ Please, support our work with like & comment! ❤️

Swing Set up - Long - USDJYTaking a buy position at 154.759. I haven't seen too many signs showing any weakening in this pair. We are about to break through a previous old high, I'll be holding this trade up until the 164 area or until I see serious signs of weakness on this pair, for now I'm long and will continue to trade with the trend. Let me know your thoughts or if you see something different. Happy trading!

USDJPYPair : USDJPY ( U.S Dollar / Japanese Yen )
Description :
Completed " 12345 " Impulsive Waves
Break of Structure
RSI - Divergence
Bullish Channel as Correction in Short Time Frame
Fibonacci Level - 161.8%

USD/JPY slides – did Tokyo intervene?It has been a remarkable week for the yen, which has exhibited sharp swings throughout the week.
The Japanese yen fell as much as 1% earlier and on Thursday but has pared most of those losses. USD/JPY has risen 0.38% to 155.19 at the time of writing.
Japan suspected of intervention
In the Asian session, the yen fell as low as 157.55 but then recovered to precisely 153. The reason for the swing is unclear but there are strong suspicions that Japan’s Ministry of Finance (MoF) ordered another round of intervention. Japan’s top currency official, Masota Kanda, refused to comment on whether Japan had intervened. Kanda was also mum about whether there was intervention on Monday, when the yen spiked and fell below the 160 level before recovering.
Money market movements indicate that the MoF did intervene on Monday, selling as much as $35 billion to prop up the yen. The yen’s swings Monday and today could signal that the MoF has targeted 160 as its “line in the sand” for intervention.
Fed holds rates, US dollar slips
There was no surprise from the Federal Reserve which maintained the benchmark rate in the target range of 5.25% to 5.50% on Wednesday. This marked a six straight pause, as Fed Chair Powell was clear that high inflation has delayed rate cuts. The rate statement said that inflation had fallen in the past year but there was a lack of progress towards the 2% inflation target in recent months. At a press conference, Powell said that the Fed was not yet confident that inflation was falling closer to the target.
Consumer inflation has been moving higher and the US economy remains surprisingly strong, which has complicated the Fed’s plan to provide relief to households by lowering rates. Still, the Powell said the next rate move was unlikely to be a hike, which sent the US dollar broadly lower against the majors on Wednesday. The yen soared as much as 3.2% against on the dollar after the rate announcement and closed on Wednesday with gains of 2%.
USD/JPY is testing resistance at 155.13. Above, there is resistance at 157.26
There is support at 152.27 and 150.14

The Case for USDJPY Over Performance. Context posts;
Broad USD bull thesis.
(Please read this before making cliche USD objections. I've covered them in the main USD bull thesis).
Bottoming strategies examples for context on the style of forecast move.
Both of these reversals had a similar confluence of signals. When this confluence of signals forms we commonly are about to see bear trend failure.
There are various things that can happen off bear trend failure. We can have a shallow retracement, a full retracement (about 3/4 - 5/6 of last drop). There can be a spike out high. Of course, there can be the reversal into overall uptrend.
An example of the range for a shallow retracement is shown on the BTC example. The spike out and reversal shown in the SPX example.
In all instances these tend to be a parabolic move.
The same things tend to happen;
1- The asset has been crashing, and it's been going down with some reason to back it.
2- Something terrible happens. Brings a real sense of the bear move MUST continue.
3 - There's a slow ranging period. During this many bear thesis' are posted.
4 - There's an abrupt upwards break and when the rest holds a strong uptrend forms.
5 - Into the latter sections (Risk area, IMO) it becomes popular to talk about the new bull.
Hopefully these sections are easy to ID in the SPX and BTC moves. BTC was absolutely classic. There was the bad news with FTX. Suddenly everyone was a bear market expert and people were lining up to post their big short thesis on something that had just hit 70% down and was most likely going to squeeze.
SPX, you'd have seen the same. If you discussed the potential of EVEN a shallow - medium retracement in SPX people called you a "Pivot bro". You were told you were too stupid to understand markets and you needed the FED to hold your hand and make it easy. When they didn't, you were doomed.
As it turned out in this example and in every example you can look at in the last 25 years, the FED didn't have to pivot for the market to rally. Markets more often rally on interest rate hikes than not. Read about that below:
But I digress. The point is there's extreme pessimism on the asset in question and people can make a rock solid sounding case for the continued downtrend - or at least an uptrend not forming.
"SBF starts the domino effect toppling the crypto industry".
"FED are consistent in their calls for higher for longer".
And with USDJPY;
"BoJ will intervene if price goes over 150".
But what if they don't?
What if the fundie narrative sounds good and is wrong? Like so many other examples.
Well, if it is, the USDJPY would be set to potentially enter into a stage of hyper over performance.
Progressively getting strong until at some point in the future you're berated if you mention the USDJPY might drop.
If we get to that stage, I'll flip to using the bear models I like to use after this style of move.

DeGRAM | USDJPY volatility increasedUSDJPY is moving near the lower boundary of the ascending channel.
The price bounced off the dynamic support.
The chart has formed a pattern AB=CD.
We expect a rebound after the support level is retested.
-------------------
Share your opinion in the comments and support the idea with like. Thanks for your support!

USD/JPY Latest: BOJ, FOMC, and possible FX interventionVolatility in USDJPY has increased over the past few days as markets believe Japanese officials may have secretly intervened in the FX market. The pair breached the 160 mark earlier in the week but did a quick turnaround and headed back towards 154, prompting speculation of an intervention.
The fact the Bank of Japan kept rates unchanged on Friday weighed further on the Japanese Yen. Governor Ueda said that the impact of the yen's depreciation on inflation was marginal, which gave a dovish tone to the meeting. This widened the rate differential with the US dollar, but the bullish appetite didn’t have long to build in USDJPY as the pair quickly reversed lower.
Japanese officials have declined to comment on whether they took action to halt the depreciation in the yen, but this is not uncommon. Surprise intervention is used to keep investors guessing in hopes it deters them from weakening the currency further. The move seems to have worked so far. USD/JPY remains below 156 after being rejected on Wednesday at 158. But the impact is likely to be limited. The fundamentals continue to favour the US dollar over the Japanese Yen, and investors are trying to get back into the market this week.
Wednesday’s FOMC meeting served to reinforce the differential in policy between the Bank of Japan and the Federal Reserve. Whilst Powell and his team try to avoid sounding too hawkish – openly denying any further rate hikes will likely be needed despite recent speculation – the strength in the data and the lack of progress in the disinflation process mean the central bank is unable to start cutting rates yet – or any time soon.
Market pricing currently shows 35bps of cuts in 2024, down from 41 before the meeting. There is now only one rate cut fully priced in, and it has been pushed back to November, possibly to December if the data remains strong.
Technically, USD/JPY has welcomed the pullback as the pair was heavily overbought. That said, the path of least resistance remains firmly higher, with little long-term impact from the FX intervention. But buyers are likely going to face increased resistance in trying to get back up to 160 as investors will now be hesitant of any further intervention. 160 is going to be a key psychological level that will likely take some time to overcome, possibly seeing some sideways consolidation before it gets there.

USD/JPY H4 | Falling to 61.8% Fibonacci supportUSD/JPY is falling towards a pullback support and could potentially bounce off this level to climb higher.
Buy entry is at 154.60 which is a pullback support that aligns close to a 61.8% Fibonacci retracement level.
Stop loss is at 152.48 which is a level that lies underneath a pullback support and the 78.6% Fibonacci retracement level.
Take profit is at 156.91 which is a level that aligns with the 78.6% Fibonacci retracement level.
High Risk Investment Warning
Trading Forex/CFDs on margin carries a high level of risk and may not be suitable for all investors. Leverage can work against you.
Stratos Markets Limited (www.fxcm.com):
CFDs are complex instruments and come with a high risk of losing money rapidly due to leverage. 68% of retail investor accounts lose money when trading CFDs with this provider. You should consider whether you understand how CFDs work and whether you can afford to take the high risk of losing your money.
Stratos Europe Ltd, previously FXCM EU Ltd (www.fxcm.com):
CFDs are complex instruments and come with a high risk of losing money rapidly due to leverage. 70% of retail investor accounts lose money when trading CFDs with this provider. You should consider whether you understand how CFDs work and whether you can afford to take the high risk of losing your money.
Stratos Trading Pty. Limited (www.fxcm.com):
Trading FX/CFDs carries significant risks. FXCM AU (AFSL 309763), please read the Financial Services Guide, Product Disclosure Statement, Target Market Determination and Terms of Business at www.fxcm.com
Stratos Global LLC (www.fxcm.com):
Losses can exceed deposits.
Please be advised that the information presented on TradingView is provided to FXCM (‘Company’, ‘we’) by a third-party provider (‘TFA Global Pte Ltd’). Please be reminded that you are solely responsible for the trading decisions on your account. There is a very high degree of risk involved in trading. Any information and/or content is intended entirely for research, educational and informational purposes only and does not constitute investment or consultation advice or investment strategy. The information is not tailored to the investment needs of any specific person and therefore does not involve a consideration of any of the investment objectives, financial situation or needs of any viewer that may receive it. Kindly also note that past performance is not a reliable indicator of future results. Actual results may differ materially from those anticipated in forward-looking or past performance statements. We assume no liability as to the accuracy or completeness of any of the information and/or content provided herein and the Company cannot be held responsible for any omission, mistake nor for any loss or damage including without limitation to any loss of profit which may arise from reliance on any information supplied by TFA Global Pte Ltd.
The speaker(s) is neither an employee, agent nor representative of FXCM and is therefore acting independently. The opinions given are their own, constitute general market commentary, and do not constitute the opinion or advice of FXCM or any form of personal or investment advice. FXCM neither endorses nor guarantees offerings of third-party speakers, nor is FXCM responsible for the content, veracity or opinions of third-party speakers, presenters or participants.

WHAT NEXT- 1000 PIPS MOVE??The overall trend is bullish we're experiencing a realignment for price to keep up the bullish momentum on a higher timeframe. what are your thought?
DISCLAIMER: This is not a financial advice, just my own perspective

Usdjpy short USD/JPY is the forex ticker that shows the value of the US Dollar against the Japanese Yen. It tells traders how many Yen are needed to buy a US Dollar. The Dollar-Yen is one of the most traded forex pairs - second only to EUR/USD - and is a benchmark for Asian economic health and even the global economy. View the live Dollar-Yen rate with the USD/JPY chart and improve your technical and fundamental analysis with the latest USD/JPY forecast, news and analysis.

USD/JPY Technical Analysis: Reversal on the Horizon?In the latest 4-hour chart, USD/JPY is showing signs of a potential pullback following a surge that saw prices exceed the upper Bollinger Band and touch the R1 weekly pivot level. Notably, this price action correlates with the pair moving back down towards the central Bollinger Band and the untouched weekly pivot, suggesting a range-bound environment.
The RSI indicates an overbought market, adding credence to the possibility of a reversal. Historically, such RSI levels often precede a retraction in price, aligning with our observed downward trajectory. Further support for this pullback is found at the 20-period SMA of the Bollinger Band, which currently sits at an interpolated level of 154.997. This level could soon play a pivotal role as a short-term target for bears.
In summary, traders should keep a close eye on the 154.997 level and monitor RSI for signs of weakening momentum, which could indicate the early stages of a broader retracement.

US Dollar Weakens After Statements from the Federal ReserveUSD/JPY Analysis: US Dollar Weakens After Statements from the Federal Reserve Chair
Last night, the Federal Reserve's decision regarding interest rates was published, which, as expected, remained unchanged at 5.5%. The subsequent press conference by Powell was of particular interest to market participants.
According to CNBC, during the conference, the Fed Chair almost ruled out a rate hike as the next step, emphasizing the monetary policy's independence from the upcoming presidential elections. Additionally, he stated that:
Concerns regarding stagflation are exaggerated;
The Fed intends to lower rates smoothly and gradually;
The duration of maintaining high rates is increasing indefinitely.
The market's reaction to the Fed's news was a weakening of the dollar – apparently, concerns about another rate hike as the next step have diminished.
The dollar weakened significantly against the yen – the USD/JPY rate dropped from 157.50 to 153.10 yen per dollar yesterday evening (approximately -2.7%) in less than an hour, although the rate later recovered. The reason lies in the context, specifically the yen's strong strengthening on Monday, when the rate exceeded 160 yen per dollar, as we wrote on the morning of April 29. Perhaps there was another intervention yesterday?
However, official sources refuse to comment. Tokyo may be adhering to a tactic of keeping investors in the dark about its currency intervention strategy. Although, as reported by the Japan Times, fluctuations of 5 yen per dollar indicate interventions.
Today's technical analysis of the USD/JPY chart shows:
→ Following Monday's intervention (assuming it occurred), the USD/JPY rate rebounded from the lower boundary of the ascending channel shown in black;
→ At the rebound peak, the 158 yen per dollar level acted as resistance;
→ After yesterday's weakening of the US dollar, the rate broke below the previous week's minimum, falling below the median line of the blue channel.
Although the EMA 50 is above the EMA 100, a change in market sentiment can be assumed. This would be evidenced by the price consolidating below the short-term (black) channel, which would open the path towards the long-term (blue) channel's lower boundary.
This article represents the opinion of the Companies operating under the FXOpen brand only. It is not to be construed as an offer, solicitation, or recommendation with respect to products and services provided by the Companies operating under the FXOpen brand, nor is it to be considered financial advice.

Fundamental Market Analysis for May 02, 2024 USDJPYThe Japanese yen (JPY) jumped to a two-week high against its U.S. counterpart on Wednesday amid speculation that Japan's financial authorities stepped in again, for the second time in a week, to support the domestic currency. This came amid a sell-off in the US dollar (USD) following the FOMC meeting and took the USD/JPY pair to 153.000. The yen, however, trimmed some of its strong intraday gains and continued to lose ground during the Asian session on Thursday, bringing the currency pair back above the round figure of 156.000.
The Bank of Japan's (BoJ) decision to keep interest rates at zero and an indication that it will continue to buy government bonds as recommended in March is a big divergence from the Federal Reserve's (Fed) hawkish signal. In fact, the U.S. central bank said on Wednesday that it wants more certainty that inflation will continue to fall before cutting rates. This, along with some dollar buying, lends support to the USD/JPY pair amid a positive risk tone that undermines the safe-haven Yen.
Trading recommendation: Watch the level of 156.000, on a rebound take Sell positions. If consolidation is above, take Buy positions.

UJ update 5/1Hello everyone, just an update on UJ trade. SL has been hit, leaving 1 trade at BE and 2 trades in profit. MY SL was moved from all trades to my 3rd entry point. 90% was taken at 160. I do still expect a push above 160 and possibly 163.
Update on my prop funding, I have lost 4 Accounts equaling to 900k from FTMO, TFT and 5ers due to regulations. I was basically a 7 figure trader and it kind of sucks, but I'm gonna look into future firms or maybe even try to find another FX firm that can support my swing trades. About 15 months into my journey and I felt like I was going to take off, but this is just a bump on the road and I'm not giving up, as I will find someway to get funded again. The ability to trade is a gift in itself, and I'm thankful for that. The man upstairs has a different plan for me, and I cant wait for what the future holds. #CHRISTISKING

USDJPY: The Japanese yen rose suddenly amid intervention speculaThe Japanese yen experienced a notable rise on Monday, which analysts interpreted as a potential sign of intervention by Japanese authorities in the foreign exchange market. The move comes after a significant depreciation of the yen, which has fallen nearly 11% against the dollar this year and 35% over the past three decades, recently hitting a 34-year low.
Monday's operation follows months of warnings from Japan that it may intervene in foreign exchange markets. The Japanese government's most recent intervention took place in September and October 2022, with an estimated 9.2 trillion yen ($60.78 billion) spent to support the currency. This is not the first case of intervention; During the 1998 Asian financial crisis, the yen fell nearly 25% in 14 months, prompting the United States to join Japan in a successful intervention effort.

USDJPY-SELL strategy Daily chartAs I had mentioned some week back, the pair was heavily overbought, and intervention made a large scale move lower touch 154.50 area from the lofty highs 160s. It addresses the issue of CB being active again, and one should not underestimate the power of BOJ.
Market still has appetite to SELL JPY and for that reason the strategy is as follows.
Strategy SELL @ 157.50-158.25 and place SL above 160.40 and take profit @ 152.75 for now.

An analysis you can’t missMany people get bogged down by focusing on small time frames. Now let me introduce the annual schedule, which is a huge deal breaker. Prices reversed course in 2011 and have been bullish ever since. Here we can see that the price is basically retracting at 161.8%. We could see a lot of selling on the 100% extension, which could test new support. To confirm this, we have multiple price action points integrated around the reward area. Right now I'm still bearish because we just made a new high and maybe we have to come back and test the key important areas.

USDJPY 1H Long Trade - 1:3 RRRTP: 160.000
SL: 157.011
In this trading strategy, we present a compelling opportunity for a long position on the USDJPY currency pair, focusing on the 1-hour timeframe. By incorporating key technical indicators such as the Exponential Moving Average (EMA) 200, Moving Average Convergence Divergence (MACD) for trend analysis, and Supertrend for entry signals, traders can aim to achieve a favorable risk-to-reward ratio of 1:3.
Indicators:
EMA200: The EMA200 serves as a critical indicator of the long-term trend direction.
MACD Trend: The MACD indicator helps traders assess the strength and direction of the trend.
Supertrend: The Supertrend indicator acts as a reliable tool for identifying entry points in alignment with the prevailing trend.

USDJPY Most Likely To Sell (After Yen Fall + FOMC News)Ever since the Japanese Yen fell couple days ago, we see consolidation as of now for USDJPY creating resistance of higher highs. With the likelihood after FOMC news, we could USDJPY to sell immediately.
TP: 157.35-157.00

Dont get scared from bulls Guys dont be scared from buyers because news is not god for usd and Volume for buyers are done

USD/JPY SELLI want to try this sell, in my opinion probable reversal.
The real key regardless of any strategy is to have a decent risk/reward .
You win and you lose , so be cautious.
No financial advice, do your own research
