USDJPY Expected move nowAs USDJPY shifted structure below I'm expecting selling opportunities on my -OB
USDJPY_TOM trade ideas

USDJPY Short 1HUSDJPY is showing bearish divergence, the price action is expected to be bearish. Trade plan is to take sell entry at breakout of previous HL.

USDJPY (Bullish Overall)USD/JPY 4-Hour Chart Analysis
Trend Analysis:
- The 4-hour chart shows an overall uptrend, with higher highs and higher lows indicating bullish momentum.
- Recently, the price has experienced some volatility but remains above key support levels.
Support and Resistance Levels:
- Immediate Support Level: 156.00, which could act as a short-term support if the price pulls back.
- Next Support Level: 154.50, a significant support level that has been tested previously.
- Immediate Resistance Level: 157.30, which is close to the current price and could act as a barrier to upward movement.
- Next Resistance Level: 158.00, a key resistance level that aligns with recent highs.
Technical Indicators:
- The recent candlestick patterns suggest some consolidation, but the overall trend remains bullish.
- There are no immediate signs of a reversal, indicating that the bullish momentum may continue.
Direction Preference:
Given the current uptrend and the lack of reversal signals, the preferred direction for USD/JPY in the short term is bullish. The price is likely to continue moving higher towards the resistance levels of 157.30 and potentially 158.00.
Conclusion:
The USD/JPY 4-hour chart indicates a bullish trend with continued upward momentum. It is advisable to consider long positions, targeting the resistance levels at 157.30 and 158.00. Monitor for any signs of consolidation or pullback, but as of now, the bullish trend remains the preferred direction.

market respected the previous T_L session zone.The price respected the previous tokyo-london session zone and dropped as expected,

USD/JPY Bearish Move ?Price reached previous resistance zone and we can see bearish wedge formation. Price broke our wedge pattern and it is possible to see bearish move.
USDJPY: Short Trading Opportunity
USDJPY
- Classic bearish setup
- Our team expects bearish continuation
SUGGESTED TRADE:
Swing Trade
Short USDJPY
Entry Point - 157.13
Stop Loss - 157.60
Take Profit - 156.29
Our Risk - 1%
Start protection of your profits from lower levels
❤️ Please, support our work with like & comment! ❤️

USDJPY Pair : USDJPY ( U.S Dollar / Japanese Yen )
Description :
Rising Wedge as an Corrective Pattern in Long Time Frame
RSI - Divergence
Break of Structure
Bullish Channel as an Corrective Pattern in Short Time Frame
Resistance Level

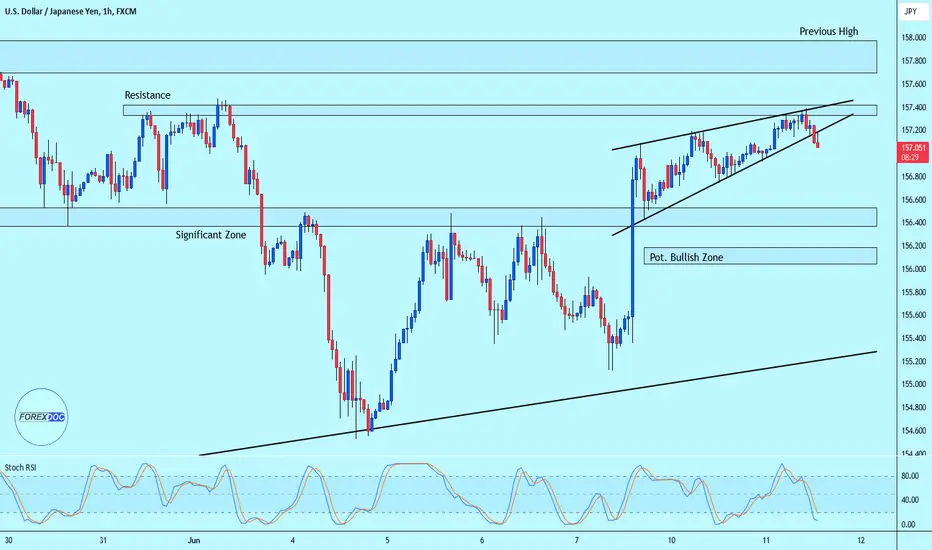
USD JPY - Long Set UpBig divergence on 1H time frame. Have my sell stop / entry at 157.129. Once triggered I will place stop and TP's according to my risk reward. Right now observing the level.
Entry - 157.030
Stoploss - 157.402
Tp-1 156.661
Tp-2 156.293
#Trading #Technical #Crypto #Stocks #commodities

Signals for USDJPYTrade 1: Internal range model 2 setup
Trade 2: Range model 1 setup - sweep of the internal range high
Trade 3 and 4: Same as trade 1 and 2 but for the external range
Confirmation: 15m flip in market structure with follow through
Follow for more
USDPYPossible USDJPY play during the CPI and FOMC news as im expecting a trend reversal which might not happen yet but should soon fall into place.

Fundamental Market Analysis for June 11, 2024 USDJPYThe USD/JPY pair has risen for the third consecutive day, marking the fourth day of positive movement in the previous five. It reached a one-week high near 157.250 during Tuesday's Asian session. However, spot prices remain below the 157.650-157.700 supply zone, as traders remain cautious ahead of this week's release of key macroeconomic data from the US and risks from central bank actions.
The release of US consumer inflation data on Wednesday will be followed by the long-awaited FOMC monetary policy decision. Investors will be looking for clues about the likely timing of when the Federal Reserve (Fed) will start cutting interest rates. This, in turn, will play a key role in influencing USD price action in the near term and will provide meaningful momentum to the USD/JPY pair ahead of the Bank of Japan's (BoJ) decision on Friday.
Market participants remain unconvinced that the Japanese central bank will announce a reduction in monthly government bond purchases amid a weakening economy. On Monday, the Finance Ministry reported that the economy contracted 0.5 per cent in the first quarter and 1.8 per cent year-on-year. This, along with a stable performance in stock markets, is seen to undermine the Japanese Yen (JPY) and is becoming a key factor weighing on the USD/JPY pair.
Conversely, the US dollar is at its highest level since 14 May, reached on Monday, and continues to receive support from growing expectations that the Federal Reserve (Fed) may keep interest rates on hold for longer. These expectations were fuelled by stronger-than-expected US employment data released on Friday. This, in turn, favours the US dollar bulls and supports the prospects for the US dollar to continue its recent rise from the 50-day simple moving average (SMA).
Trade recommendation: Trade mainly buy orders at the price level of 157.500. We consider sell orders at the price level of 157.000.

Market Crash - The Death of the Japanese YenI've been doing some analysis on the Yen this year, because I think it's important. It's essentially my leading candidate for this "black swan" I'm predicting. It doesn't have to be the end of the world, but at some point there will be a catalyst for a new bear market and I think this may be it. There might not be another catalyst for another 5 years and we just keep ripping to new ATH year after year, or maybe there's one in 5 hours. Who knows. I think the Yen is most likely what will start things off, but we'll see. We have potential bank failures, Russia vs. NATO, Israel vs Iran, China vs Taiwan, and many other things that could happen.
Anyway, I'll do more ideas on this, but here's a weekly chart going back to the major top in 1986/1987. In 2014, this downtrend was finally broken, which led to the run up we are still seeing today. It held on a retest in 2020 with a massive volume spike as well. Also remember that in the case of this chart, an upside breakout is bad for the Yen, it's the opposite of what you may think intuitively.
The Yen had not hit 160 since 1990 and once it got there this year, Japan intervened twice to prevent it from going any further. That held it off for all of 2 months, it's already back to where it started. Which means, if treasury yields keep spiking, the Yen will get worse and worse until total collapse, BoJ can't save it forever. Treasury yields must fall or else equities are doomed.

An important week ahead for USDJPYThe USDJPY has experienced bearish pressure due to recent interventions by the Bank of Japan (BoJ), which has been purchasing Yen to stabilise its currency. According to Bloomberg, the BoJ has spent over $62 billion in the past month on these interventions.
Despite significant USD strength over the JPY driven by the interest rate differential, the chart shows prices dipping below the 155 level. This suggests that the BoJ's efforts have had a noticeable impact on the exchange rate.
It's crucial to consider that the BoJ may continue its intervention strategy, potentially leading to further corrections in USDJPY. Therefore, effective risk management is essential, including taking partial profits to safeguard against volatility.
My entry on USDJPY:
I am in a buy trade from 155.700. I plan on monitoring Monday and Tuesdays price action to potentially add to my positions ahead of Wednesdays numbers.
The following is news and data we need to keep an eye out for over the coming week:
Core CPI m/m, CPI m/m, CPI y/y
Federal Funds Rate
FOMC Economic Projections
FOMC Statement
FOMC Press Conference
Core PPI m/m
PPI m/m
Unemployment Claims
Prelim UoM Consumer Sentiment
Good luck guys!

Usdjpy longUsdjpy trend continues to buy side momentum
1:2 RR Overall trend buy breakout happened
Strict SL

USD/JPY calm as GDP within expectationsThe Japanese yen is calm on Monday. In the North American session, USD/JPY is trading at 156.91, up 0.09% on the day at the time of writing.
Japan’s GDP declines
Japan’s economy contracted in the first quarter with a weak reading of -1.8% y/y,
following a revised 0.4% gain in Q4 2023. This was slightly higher than the market
estimate of -1.9% and the initial estimate of -2.0%. On a quarterly basis, GDP declined
by 0.5%, in line with expectations. This followed a small gain of 0.1% in the fourth
quarter. The weak GDP data follows a soft household spending release last week, which
showed decline of 1.2% m/m in April.
The Bank of Japan meets on June 14th and is not expected to raise interest rates, after a
historic rate hike in March. This was the first rate hike since 2007 and a clear shift away
from the BoJ’s ultra-loose monetary policy. There is speculation that the BoJ might
discuss reducing its purchases of Japanese government bonds in an effort to unwind
monetary policy in order to shore up the ailing Japanese yen.
Strong US nonfarm payrolls boost US dollar
Friday’s US nonfarm payroll report was hotter than expected and provided a boost to the
US dollar against all the major currencies, including the yen. Nonfarm payrolls in May
rose to 272 thousand, blowing past the market estimate of 185,000 and much stronger
than the revised gain of 165 thousand in April. Wage growth accelerated in May and was
also higher than expected. Surprisingly, the unemployment rate crept up to 4%, up from
3.9% in April and above the market estimate of 3.9%.
The strong job numbers have helped cushion the impact on the economy of high rates and
that has kept inflation stubbornly high. According the CME’s MarketWatch, the odds of a
quarter-point cut in September have dropped to 46%, compared to 51% just one week
ago. There is virtually no chance of a rate cut at this week’s meeting, but investors will be
very interested in what the Fed has to say.
There is resistance at 157.52 and 158.28
156.33 and 155.57 are providing support

Daily USD/JPY UpdatesHello Traders!
We just got large range candle, no surprise that today was less dynamic and small so far.

USDJPY: We've seen the peak for nowYen's weakness has been one of the biggest stories of the last two years, but we are set for a reversal in the near term.
Fundamentally, inflation and the economy are holding steady in Japan, and the carry trade looks very old.
In late April, the big reversal shook many carry traders out and opened the door to a near-term reversal.
This is a higher-risk trade for me than normal since the technical analysis is a mixed report.
The trend indicates more potential upside, while the candlesticks and chart patterns point to a reversal.
Momentum is neutral, encouraging an entry long, but the divergence demonstrates a sell.
Any more weak U.S. economic news could move this pair along quickly.
I think its current state is fragile.
I'll update this chart as it evolves.
OPEN SHORT
Trend: Bullish
Momentum: Neutral, Bearish Divergence
Japanese Candlestick Pattern: An Evening Star Reversal could be forming this week.
Chart Pattern: Possible Bearish Rising Wedge
Support and Resistance: 151.50, 148.50 are in play near-term.
U.S. ISM PMI and NFP could move the pair quickly this week.

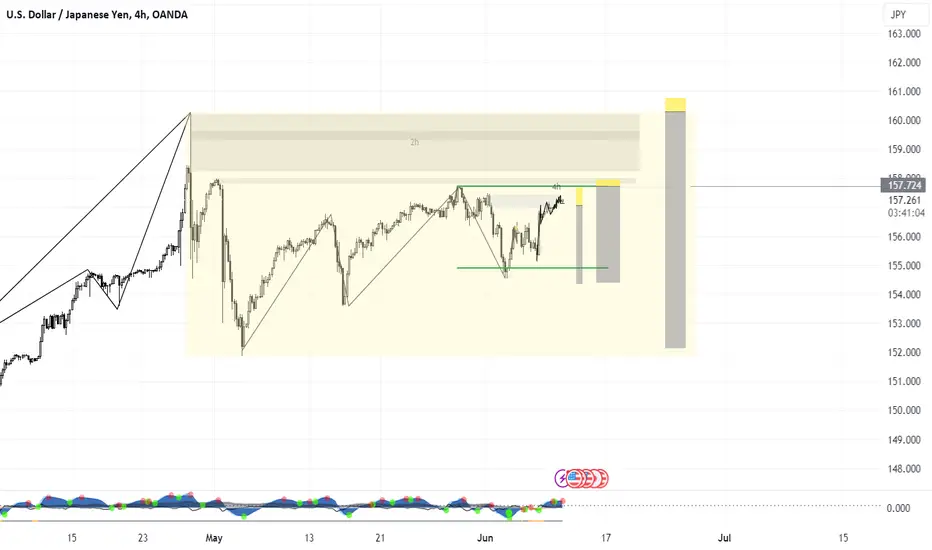
USD/JPY LongContext:
• W and M showing (yet to be confirmed) rejections: Neutral with bullish touch
• Respecting Daily FVGs
• 2h big bullish FVG, 4h close above equal Highs
Idea:
• Entry in area between 156.600 - 156.15 with LTF reversal (e.q. 1h)
Scenario:
• Entry area should be approached without bearish FVGs
• 4h close below 156.49 (Equal Highs): Caution!
Scenario terminated:
• 4h Retracement below 156.15: Trade is off
Stop:
• Determined by your entry setup
Please feel free to comment with other ideas or questions.

USDJPY ( UNDER TURNING LEVEL )USDJPY
Tendency the price is under bearish pressure 157.655
Turning level : The turning level 157.655 , so as long as the price below this level, there will be a bearish trend
resistance level : Breaking the turning level 157.655 , the price will rise to158.289 as long as the price stabilize this level , there will be reach 160.191
support level : The trading stabilizing below 157.655 , the price will reach the support level of 155.658 and154.497 , and under this level it will be reach 153.656
corrective level : price will attempt 157.655 , correct itself before falling

USDJPY SELL U.S. Dollar / Japanese Yen chart to track latest price changes. Trade ideas, forecasts and market news are at your disposal as well.

USD.JPYWe have not observed any notable movement from this currency pair since the market opened. The price is currently within a specific range based on the parameters we indicated in the chart. If the 158.20 region is disrupted, the price may rise somewhat, perhaps to 160.00. Conversely, we may anticipate a decline in the dollar's value relative to the yen due to the sellers' pressure, which initially will be limited to a price range of 155.00 dollars. You might think about entering the sell trade within the region of 158.20; if this range of prices is not broken, there will be a significant selling opportunity.

Ugly block//@version=5
indicator("!<*FVG_FIBO*>!", overlay = true)
import LudoGH68/Drawings_public/1 as d
getLineStyle(lineOption) =>
lineOption == "?" ? line.style_dotted : lineOption == "?" ? line.style_dashed : line.style_solid
get_structure_highest_bar(lookback) =>
var int idx = 0
maxBar = bar_index > lookback ? ta.highestbars(high, lookback) : ta.highestbars(high, bar_index + 1)
for i = 0 to lookback - 1 by 1
if high > high and high <= high and ((i+1) * -1) >= maxBar
idx := (i+1) * -1
//break
idx := idx == 0 ? maxBar : idx
get_structure_lowest_bar(lookback) =>
var int idx = 0
minBar = bar_index > lookback ? ta.lowestbars(low, lookback) : ta.lowestbars(low, bar_index + 1)
for i = 0 to lookback - 1 by 1
if low < low and low >= low and ((i+1) * -1) >= minBar
idx := (i+1) * -1
//break
idx := idx == 0 ? minBar : idx
is_structure_high_broken(_highStructBreakPrice, _structureHigh, _structureHighStartIndex, _structureDirection) =>
var bool res = false
if (_highStructBreakPrice > _structureHigh and bar_index > _structureHighStartIndex) or (_structureDirection == 1 and _highStructBreakPrice > _structureHigh)
res := true
else
res := false
res
// Fear Value Gap
isFvgToShow = input(true, title='Display FVG', group="Fear Value Gap")
bullishFvgColor = input(color.new(#b2b5be, 70), 'Bullish FVG Color', group="Fear Value Gap")
bearishFvgColor = input(color.new(#b2b5be, 70), 'Bearish FVG Color', group="Fear Value Gap")
mitigatedFvgColor = input(color.new(#b2b5be, 70), 'Mitigated FVG Color', group="Fear Value Gap")
fvgHistoryNbr = input.int(5, 'Number of FVG to show', minval=1, maxval=50)
isMitigatedFvgToReduce = input(false, title='Reduce mitigated FVG', group="Fear Value Gap")
// Structures
isStructBodyCandleBreak = input(true, title='Break with candle\'s body', group="Structures")
isCurrentStructToShow = input(true, title='Display current structure', group="Structures")
bullishBosColor = input(color.silver, 'Bullish BOS Color', group="Structures")
bearishBosColor = input(color.silver, 'Bearish BOS Color', group="Structures")
bosLineStyleOption = input.string("-", title="BOS Style", group="Structures", options= )
bosLineStyle = getLineStyle(bosLineStyleOption)
bosLineWidth = input.int(1, title="BOS Width", group="Structures", minval=1, maxval=5)
bullishChochColor = input(color.silver, 'Bullish CHoCH Color', group="Structures")
bearishChochColor = input(color.silver, 'Bearish CHoCH Color', group="Structures")
chochLineStyleOption = input.string("-", title="CHoCH Style", group="Structures", options= )
chochLineStyle = getLineStyle(chochLineStyleOption)
chochLineWidth = input.int(1, title="MSB Width", group="Structures", minval=1, maxval=5)
currentStructColor = input(color.rgb(255, 4, 0), 'Current structure Color', group="Structures")
currentStructLineStyleOption = input.string("-", title="Current structure Style", group="Structures", options= )
currentStructLineStyle = getLineStyle(currentStructLineStyleOption)
currentStructLineWidth = input.int(1, title="Current structure Width", group="Structures", minval=1, maxval=5)
structHistoryNbr = input.int(10, 'Number of break to show', minval=1, maxval=50)
// Fibonacci 1
isFibo1ToShow = input(true, title = "", group="Structure Fibonacci", inline = "Fibo1")
fibo1Value = input.float(0.786, title = "", group="Structure Fibonacci", inline = "Fibo1")
fibo1Color = input(#9598a1, title = "", group="Structure Fibonacci", inline = "Fibo1")
fibo1StyleOption = input.string("-", title = "", group="Structure Fibonacci", options= , inline = "Fibo1")
fibo1Style = getLineStyle(fibo1StyleOption)
fibo1LineWidth = input.int(1, title = "", group="Structure Fibonacci", minval=1, maxval=5, inline = "Fibo1")
// Fibonacci 2
isFibo2ToShow = input(true, title = "", group="Structure Fibonacci", inline = "Fibo2")
fibo2Value = input.float(0.705, title = "", group="Structure Fibonacci", inline = "Fibo2")
fibo2Color = input(#9598a1, title = "", group="Structure Fibonacci", inline = "Fibo2")
fibo2StyleOption = input.string("-", title = "", group="Structure Fibonacci", options= , inline = "Fibo2")
fibo2Style = getLineStyle(fibo2StyleOption)
fibo2LineWidth = input.int(1, title = "", group="Structure Fibonacci", minval=1, maxval=5, inline = "Fibo2")
// Fibonacci 3
isFibo3ToShow = input(true, title = "", group="Structure Fibonacci", inline = "Fibo3")
fibo3Value = input.float(0.618, title = "", group="Structure Fibonacci", inline = "Fibo3")
fibo3Color = input(#9598a1, title = "", group="Structure Fibonacci", inline = "Fibo3")
fibo3StyleOption = input.string("-", title = "", group="Structure Fibonacci", options= , inline = "Fibo3")
fibo3Style = getLineStyle(fibo3StyleOption)
fibo3LineWidth = input.int(1, title = "", group="Structure Fibonacci", minval=1, maxval=5, inline = "Fibo3")
// Fibonacci 3
isFibo4ToShow = input(true, title = "", group="Structure Fibonacci", inline = "Fibo4")
fibo4Value = input.float(0.5, title = "", group="Structure Fibonacci", inline = "Fibo4")
fibo4Color = input(#9598a1, title = "", group="Structure Fibonacci", inline = "Fibo4")
fibo4StyleOption = input.string("-", title = "", group="Structure Fibonacci", options= , inline = "Fibo4")
fibo4Style = getLineStyle(fibo4StyleOption)
fibo4LineWidth = input.int(1, title = "", group="Structure Fibonacci", minval=1, maxval=5, inline = "Fibo4")
// Fibonacci 5
isFibo5ToShow = input(true, title = "", group="Structure Fibonacci", inline = "Fibo5")
fibo5Value = input.float(0.382, title = "", group="Structure Fibonacci", inline = "Fibo5")
fibo5Color = input(#9598a1, title = "", group="Structure Fibonacci", inline = "Fibo5")
fibo5StyleOption = input.string("-", title = "", group="Structure Fibonacci", options= , inline = "Fibo5")
fibo5Style = getLineStyle(fibo5StyleOption)
fibo5LineWidth = input.int(1, title = "", group="Structure Fibonacci", minval=1, maxval=5, inline = "Fibo5")
// Draw FVG into graph
FVGDraw(_boxes, _fvgTypes, _isFvgMitigated) =>
// Loop into all values of the array
for in _boxes
// Processing bullish FVG
if(array.get(_fvgTypes, index))
// Check if FVG has been totally mitigated
if(low <= box.get_bottom(value))
array.remove(_boxes, index)
array.remove(_fvgTypes, index)
array.remove(_isFvgMitigated, index)
box.delete(value)
else
if(low < box.get_top((value)))
box.set_bgcolor(value, mitigatedFvgColor)
// Mitigated FVG Alert
if(not(array.get(_isFvgMitigated, index)))
alert("FVG has been mitigated", alert.freq_once_per_bar)
array.set(_isFvgMitigated, index, true)
// Reduce FVG if needed
if(isMitigatedFvgToReduce)
box.set_top(value, low)
box.set_right(value, bar_index)
// Processing bearish FVG
else
// Check if FVG has been mitigated
if(high >= box.get_top(value))
array.remove(_boxes, index)
array.remove(_fvgTypes, index)
array.remove(_isFvgMitigated, index)
box.delete(value)
else
if(high > box.get_bottom((value)))
box.set_bgcolor(value, mitigatedFvgColor)
// Mitigated FVG Alert
if(not(array.get(_isFvgMitigated, index)))
alert("FVG has been mitigated", alert.freq_once_per_bar)
array.set(_isFvgMitigated, index, true)
// Reduce FVG if needed
if(isMitigatedFvgToReduce)
box.set_bottom(value, high)
box.set_right(value, bar_index)
// Arrays variable
var array structureLines = array.new_line(0)
var array structureLabels = array.new_label(0)
var array fvgBoxes = array.new_box(0)
var array fvgTypes = array.new_bool(0)
var array isFvgMitigated = array.new_bool(0)
// Price variables
var float structureHigh = 0.0
var float structureLow = 0.0
var float fibo1Price = 0.0
var float fibo2Price = 0.0
var float fibo3Price = 0.0
var float fibo4Price = 0.0
var float fibo5Price = 0.0
// Index variable
var int structureHighStartIndex = 0
var int structureLowStartIndex = 0
var int structureDirection = 0
var int fibo1StartIndex = 0
var int fibo2StartIndex = 0
var int fibo3StartIndex = 0
var int fibo4StartIndex = 0
var int fibo5StartIndex = 0
// Line variable
var line structureHighLine = na
var line structureLowLine = na
var line fibo1Line = na
var line fibo2Line = na
var line fibo3Line = na
var line fibo4Line = na
var line fibo5Line = na
// Label variable
var label fibo1Label = na
var label fibo2Label = na
var label fibo3Label = na
var label fibo4Label = na
var label fibo5Label = na
// Define FVG type
isBullishFVG = high < low
isBearishFVG = low > high
// Bullish FVG process
if(isBullishFVG and isFvgToShow)
// Add FVG into FVG's array
box _box = box.new(left=bar_index - 2, top=low , right=bar_index , bottom=high , border_style=line.style_solid, border_width=1, bgcolor=bullishFvgColor, border_color=color.new(color.green, 100))
array.push(fvgBoxes, _box)
array.push(fvgTypes, true)
array.push(isFvgMitigated, false)
// Check if FVG to show is upper than user parameter
if(array.size(fvgBoxes) > fvgHistoryNbr + 1)
// Delete the FVG and its index from arrays
box.delete(array.get(fvgBoxes, 0))
array.remove(fvgBoxes, 0)
array.remove(fvgTypes, 0)
array.remove(isFvgMitigated, 0)
// Bearish FVG process
if(isBearishFVG and isFvgToShow)
// Add FVG into FVG's array
box _box = box.new(left=bar_index - 2, top=low , right=bar_index , bottom=high , border_style=line.style_solid, border_width=1, bgcolor=bearishFvgColor, border_color=color.new(color.red, 100))
array.push(fvgBoxes, _box)
array.push(fvgTypes, false)
array.push(isFvgMitigated, false)
// Check if FVG to show is upper than user parameter
if(array.size(fvgBoxes) > fvgHistoryNbr + 1)
// Delete the FVG and its index from arrays
box.delete(array.get(fvgBoxes, 0))
array.remove(fvgBoxes, 0)
array.remove(fvgTypes, 0)
array.remove(isFvgMitigated, 0)
// Draw FVG
FVGDraw(fvgBoxes, fvgTypes, isFvgMitigated)
// Initialize value for bar 0
if(bar_index == 0)
structureHighStartIndex := bar_index
structureLowStartIndex := bar_index
structureHigh := high
structureLow := low
highest = bar_index > 10 ? ta.highest(10) : ta.highest(bar_index + 1)
highestBar = bar_index > 10 ? ta.highestbars(high, 10) : ta.highestbars(high, bar_index + 1)
lowest = bar_index > 10 ? ta.lowest(10) : ta.lowest(bar_index + 1)
lowestBar = bar_index > 10 ? ta.lowestbars(low, 10) : ta.lowestbars(low, bar_index + 1)
structureMaxBar = bar_index + get_structure_highest_bar(10)
structureMinBar = bar_index + get_structure_lowest_bar(10)
lowStructBreakPrice = isStructBodyCandleBreak ? close : low
highStructBreakPrice = isStructBodyCandleBreak ? close : high
isStuctureLowBroken = (lowStructBreakPrice < structureLow and lowStructBreakPrice >= structureLow and lowStructBreakPrice >= structureLow and lowStructBreakPrice >= structureLow and bar_index > structureLowStartIndex and bar_index > structureLowStartIndex and bar_index > structureLowStartIndex) or (structureDirection == 2 and lowStructBreakPrice < structureLow)
isStructureHighBroken = (highStructBreakPrice > structureHigh and highStructBreakPrice <= structureHigh and highStructBreakPrice <= structureHigh and highStructBreakPrice <= structureHigh and bar_index > structureHighStartIndex and bar_index > structureHighStartIndex and bar_index > structureHighStartIndex) or (structureDirection == 1 and highStructBreakPrice > structureHigh)
if(isStuctureLowBroken)
// Check if structures to show is upper than user parameter
if(array.size(structureLines) >= structHistoryNbr)
// Delete the line and its index from arrays
d.delete_line(array.get(structureLines, 0), array.get(structureLabels, 0))
array.remove(structureLabels, 0)
array.remove(structureLines, 0)
// Create BOS line
if(structureDirection == 1)
array.push(structureLines, line.new(structureLowStartIndex, structureLow, bar_index, structureLow, xloc=xloc.bar_index, extend=extend.none, color=bearishBosColor, style=bosLineStyle, width=bosLineWidth))
array.push(structureLabels, label.new((bar_index + structureLowStartIndex) / 2, structureLow, text="BOS", style=label.style_none, textcolor=bearishBosColor))
// Create CHoCH line
else
array.push(structureLines, line.new(structureLowStartIndex, structureLow, bar_index, structureLow, xloc=xloc.bar_index, extend=extend.none, color=bearishChochColor, style=chochLineStyle, width=chochLineWidth))
array.push(structureLabels, label.new((bar_index + structureLowStartIndex) / 2, structureLow, text="CHoCH", style=label.style_none, textcolor=bearishChochColor))
// Update values for new structure
structureDirection := 1
structureHighStartIndex := structureMaxBar
structureLowStartIndex := bar_index
structureHigh := high //highest
structureLow := low
// Check for breakout
else if(isStructureHighBroken)
// Check if structures to show is upper than user parameter
if(array.size(structureLines) >= structHistoryNbr)
// Delete the line and its index from arrays
d.delete_line(array.get(structureLines, 0), array.get(structureLabels, 0))
array.remove(structureLabels, 0)
array.remove(structureLines, 0)
// Create BOS line
if(structureDirection == 2)
array.push(structureLines, line.new(structureHighStartIndex, structureHigh, bar_index, structureHigh, xloc=xloc.bar_index, extend=extend.none, color=bullishBosColor, style=bosLineStyle, width=bosLineWidth))
array.push(structureLabels, label.new((bar_index + structureHighStartIndex) / 2, structureHigh, text="BOS", style=label.style_none, textcolor=bullishBosColor))
// Create CHoCH line
else
array.push(structureLines, line.new(structureHighStartIndex, structureHigh, bar_index, structureHigh, xloc=xloc.bar_index, extend=extend.none, color=bullishChochColor, style=chochLineStyle, width=chochLineWidth))
array.push(structureLabels, label.new((bar_index + structureHighStartIndex) / 2, structureHigh, text="CHoCH", style=label.style_none, textcolor=bullishChochColor))
// Update values for new structure
structureDirection := 2
structureHighStartIndex := bar_index
structureLowStartIndex := structureMinBar
structureHigh := high
structureLow := low //lowest
else
if(high > structureHigh and (structureDirection == 0 or structureDirection == 2))
if(not(isStructBodyCandleBreak) or not(isStructBodyCandleBreak and bar_index > structureHighStartIndex and bar_index > structureHighStartIndex and bar_index > structureHighStartIndex))
structureHigh := high
structureHighStartIndex := bar_index
else if(low < structureLow and (structureDirection == 0 or structureDirection == 1))
if(not(isStructBodyCandleBreak) or not(isStructBodyCandleBreak and bar_index > structureLowStartIndex and bar_index > structureLowStartIndex and bar_index > structureLowStartIndex))
structureLow := low
structureLowStartIndex := bar_index
structureRange = math.abs(structureHigh - structureLow)
// Affichage de la structure actuelle
if(isCurrentStructToShow)
d.delete_line(structureHighLine, na)
d.delete_line(structureLowLine, na)
structureHighLine := line.new(structureHighStartIndex, structureHigh, bar_index, structureHigh, xloc.bar_index, color=currentStructColor, style = currentStructLineStyle, width = currentStructLineWidth)
structureLowLine := line.new(structureLowStartIndex, structureLow, bar_index, structureLow, xloc.bar_index, color=currentStructColor, style = currentStructLineStyle, width = currentStructLineWidth)
// Affichage du Fibonnacci 1 de la structure actuelle
if(isFibo1ToShow)
d.delete_line(fibo1Line, fibo1Label)
fibo1Price := structureDirection == 1 ? structureHigh - (structureRange - structureRange * fibo1Value) : structureLow + (structureRange - structureRange * fibo1Value)
fibo1StartIndex := structureDirection == 1 ? structureHighStartIndex : structureLowStartIndex
fibo1Line := line.new(fibo1StartIndex, fibo1Price, bar_index, fibo1Price, xloc.bar_index, color = fibo1Color, style = fibo1Style, width = fibo1LineWidth)
fibo1Label := label.new(bar_index + 20, fibo1Price, text = str.tostring(fibo1Value) + "(" + str.tostring(fibo1Price) + ")", style = label.style_none, textcolor = fibo1Color)
// Affichage du Fibonnacci 2 de la structure actuelle
if(isFibo2ToShow)
d.delete_line(fibo2Line, fibo2Label)
fibo2Price := structureDirection == 1 ? structureHigh - (structureRange - structureRange * fibo2Value) : structureLow + (structureRange - structureRange * fibo2Value)
fibo2StartIndex := structureDirection == 1 ? structureHighStartIndex : structureLowStartIndex
fibo2Line := line.new(fibo2StartIndex, fibo2Price, bar_index, fibo2Price, xloc.bar_index, color = fibo2Color, style = fibo2Style, width = fibo2LineWidth)
fibo2Label := label.new(bar_index + 20, fibo2Price, text = str.tostring(fibo2Value) + "(" + str.tostring(fibo2Price) + ")", style = label.style_none, textcolor = fibo2Color)
// Affichage du Fibonnacci 3 de la structure actuelle
if(isFibo3ToShow)
d.delete_line(fibo3Line, fibo3Label)
fibo3Price := structureDirection == 1 ? structureHigh - (structureRange - structureRange * fibo3Value) : structureLow + (structureRange - structureRange * fibo3Value)
fibo3StartIndex := structureDirection == 1 ? structureHighStartIndex : structureLowStartIndex
fibo3Line := line.new(fibo3StartIndex, fibo3Price, bar_index, fibo3Price, xloc.bar_index, color = fibo3Color, style = fibo3Style, width = fibo3LineWidth)
fibo3Label := label.new(bar_index + 20, fibo3Price, text = str.tostring(fibo3Value) + "(" + str.tostring(fibo3Price) + ")", style = label.style_none, textcolor = fibo3Color)
// Affichage du Fibonnacci 1 de la structure actuelle
if(isFibo4ToShow)
d.delete_line(fibo4Line, fibo4Label)
fibo4Price := structureDirection == 1 ? structureHigh - (structureRange - structureRange * fibo4Value) : structureLow + (structureRange - structureRange * fibo4Value)
fibo4StartIndex := structureDirection == 1 ? structureHighStartIndex : structureLowStartIndex
fibo4Line := line.new(fibo4StartIndex, fibo4Price, bar_index, fibo4Price, xloc.bar_index, color = fibo4Color, style = fibo4Style, width = fibo4LineWidth)
fibo4Label := label.new(bar_index + 20, fibo4Price, text = str.tostring(fibo4Value) + "(" + str.tostring(fibo4Price) + ")", style = label.style_none, textcolor = fibo4Color)
// Affichage du Fibonnacci 1 de la structure actuelle
if(isFibo5ToShow)
d.delete_line(fibo5Line, fibo5Label)
fibo5Price := structureDirection == 1 ? structureHigh - (structureRange - structureRange * fibo5Value) : structureLow + (structureRange - structureRange * fibo5Value)
fibo5StartIndex := structureDirection == 1 ? structureHighStartIndex : structureLowStartIndex
fibo5Line := line.new(fibo5StartIndex, fibo5Price, bar_index, fibo5Price, xloc.bar_index, color = fibo5Color, style = fibo5Style, width = fibo5LineWidth)
fibo5Label := label.new(bar_index + 20, fibo5Price, text = str.tostring(fibo5Value) + "(" + str.tostring(fibo5Price) + ")", style = label.style_none, textcolor = fibo5Color)
plot(na)
barcolor((high <= high and low >= low and close >= open) ? #04fd11: na)
barcolor((high <= high and low >= low and open >= close) ? #f70303: na)
//-----------------------------------------------------------------------------//
//indicator("Filter out Weak pivot highs/lows", overlay = true)
lb =input.int(15, 'pivots: lookback/forward', group = 'Pivots highs & lows', tooltip = "larger number for more significant pivot highs / pivot lows")
atrMult =input.float(1.5, "Spikeyness Index", minval = 0, step =0.1, inline ='2', group = 'Pivots highs & lows', tooltip = "For catching only the 'spikier' pivot highs/pivot lows Setting to =0 will effectively remove this condition and plot standard pivot highs/lows Increasing this number will filter out smooth/unimpressive pivot high&lows; Represents local ATR multiple for distance from local Moving average a high or low must be Setting of 1.5 seems optimal on 15m chart with pivot lookback/lookforward = 15")
useSpikeyCond =input.bool(true, "use spikey condition", inline ='3',group = 'Pivots highs & lows', tooltip ="toggle off to see how typical pivots are painted; to notice the difference/improvement")
confirmOnClose = input.bool(true, "wait 1x bar to confirm (avoid repainting)", inline ='4',group = 'Pivots highs & lows', tooltip = "default is ON, waits for realtime bar to close before confirming Pivot H/L Toggle this off to get Pivot highs confirmed one bar earlier, but at the cost of sometimes causing repainting")
int x = confirmOnClose?1:0
pivHigh = ta.pivothigh(high, lb, lb)
isPivHigh = na(pivHigh)? false:true
atr = ta.atr(2*lb)
maH = ta.sma(high, 2*lb)
bool spikyH = useSpikeyCond?pivHigh > maH+atrMult*atr:true
var float ph = 0
if isPivHigh
if spikyH
ph:=pivHigh
label.new(bar_index-(lb+x), high , text ="High",color=#feffff)
pivLow = ta.pivotlow(low, lb, lb)
isPivLow = na(pivLow)? false:true
maL = ta.sma(low, 2*lb)
bool spikyL = useSpikeyCond? pivLow < maL-atrMult*atr:true
var float pl = 0
if isPivLow
if spikyL
pl:=pivLow
label.new(bar_index-(lb+x), low , text ="Low", style = label.style_label_up, color = #feffff)
