#USDT Dominance Short Update!This chart speaks for itself—altseason is on the horizon!
Make sure you have a solid bag ready!
If you don't, don't worry—I'll be sharing a list of top alts soon.
Stay tuned and stay connected with me on all platforms!
Cheers,
#PEACE
USDT.D trade ideas

Batter UpAll ideas are strictly my interpretation of price action. I am not a professional trader nor is this
professional advice.
I will continually update all trades.

USDT Dominance Update.Time Frame: Weekly.
The USDT.D is currently rejecting the 5.2% resistance. This rejection has pushed the BTC price up to $67k.
The continuation of this rejection will likely help BTC and other altcoins to rally higher. It would be a 22% drop from the current level to the lower support, providing ample room for BTC and altcoins to breathe.
From a negative perspective, if the dominance breaks above the resistance, be prepared for a potential crash.
For now, this rejection looks positive for the market.
Happy weekend.
Do your own research.
Regards, Team Dexter.

USDT.D% will ⚔️Attack⚔️ to Support zone again💡One of the important factors for analyzing the cryptocurrency market is the Market Cap USDT Dominance% (USDT.D%) status.
💡If USDT.D% falls, we can expect the cryptocurrency market to start rising ( not all tokens, of course ).
📈From the point of view of Classical Technical Analysis , USDT.D% looks like. It has succeeded in breaking the lower line of the Rising Wedge Pattern .
🌊According to the theory of Elliott waves , USDT.D% has successfully completed the Zigzag(ABC) correction , and we have to wait for the next 5 falling waves .
🔔I expect USDT.D% to at least fall to the 🟢 Support zone(4.72%-4.53%) 🟢.
Market Cap USDT Dominance% Analyze (USDT.D%), 1-hour time frame ⏰.
Do not forget to put Stop loss for your positions (For every position you want to open).
Please follow your strategy; this is just my Idea, and I will gladly see your ideas in this post.
Please do not forget the ✅' like '✅ button 🙏😊 & Share it with your friends; thanks, and Trade safe.

USDT dom - provides a nice overview - UPDATEUSDT dom - provides a nice overview - UPDATE
pretty self explanatory. following this until it breaks. fits a few other key fractals.

easy easy USDTtaking it candle by candle thats the key 2 trading, as everything follows my analysis (btc,eth,sol) so should the USDT. until a sudden change of events everything seems bullish, back in march id say it sell now im bull

USDT.D 12H update - May 21 2024USDT Dominance chart as perfectly followed early may analysis and is currently heading for lower level. there might be a retest of the broken level of 4.6% soon which can cause a small correction in the market.

#USDT.D formed bullish diamond patternWhile #usdt #tether dominance dumped after #eth news, is now consolidating and formed diamond pattern. This pattern sends the index where it has fallen or bounced. Thus, this may be bullish but market is not weak, yet. Not financial advice.

Tether Dominion Bearish Flag Pattern Appears! "USDT.D"Hello, Friends!
Good to see you. Are you all having a good day?
Tether Dominance is on a long berish.
The current wave shows the bearish flag pattern.
If it breaks down the bottom of the Flag, it will go down to the target value.
It's important!
When tether Dominance falls, the BTC and ALT rise.
When Tether Dominance rises, the BTC and ALT fall.


Usd.dominance Dominance is currently bearish….trying to get back to it orders before firing off to the upside. Please follow for more updates.

$USDT dominance chart seem perfectly DIppedWith bullish news on #eth ETF, #usdt dominance is dumped, but now holding on daily ichimoku support!.. Bounce here may may be deadly. Not financial advice.

Divergences say that $USDT dominance is getting stronger#usdt #tether dominance chart is rising after bullish divergences occured. Short term continuation is expected. Not financial advice.


USDT.DAnalysis of USDT.D daily time frame
In the medium term, Dominance Tether can move towards higher targets after a correction, as a result, we expect a dump of Bitcoin.


Full analysis of Dominance Tether ( USDT.D )We are at the most important time bullran of Bitcoin and crypto market.
We have now reached the bottom of the descending channel and the most important Tether trend line (we were with this trend line from December 2017 to November 2021).
If the bottom of the channel breaks and reaches the trend, Dominance Tether will fall by 11% and a strong fomo will form, the price of Bitcoin will reach 70~89 thousand dollars, then we will see a sharp correction of the market after the halving. (unmodified
bullran is very dangerous and fragile).
But if the bottom of the channel is not broken, dominance will reach the range of 5.5%, as a result, the whole market will undergo a severe correction and the upward trend of the market will remain for the next halving.
Market correction can be done with strange and unexpected news.
The most important market days are March 11 and May 11 (white dotted line).
Be very careful in transactions, especially setting stop loss, in these 2 months whales and exchanges will be more active to get liquidity and stop hunters.

USDT Dominance: an indicator to forecast Bitcoin’s directionUSD Tether, or USDT, came into existence as a digital version of the U.S. dollar, and it succeeded. USDT is pegged to the U.S. dollar and is the top and most used stable coin in the crypto market. USDT is also being used for transferring money or other means of payment, although mostly in the crypto market. Many others tried to capture a piece of this huge market: USDC, BUSD, DAI, TUSD, and UST. We all know what happened to the last one, UST (Terra USD) depegged from the U.S. dollar and crashed.
Anyway, since USDT is the most used stable coin in the crypto market, its dominance can reveal important info about the crypto market, and mostly about the Bitcoin.
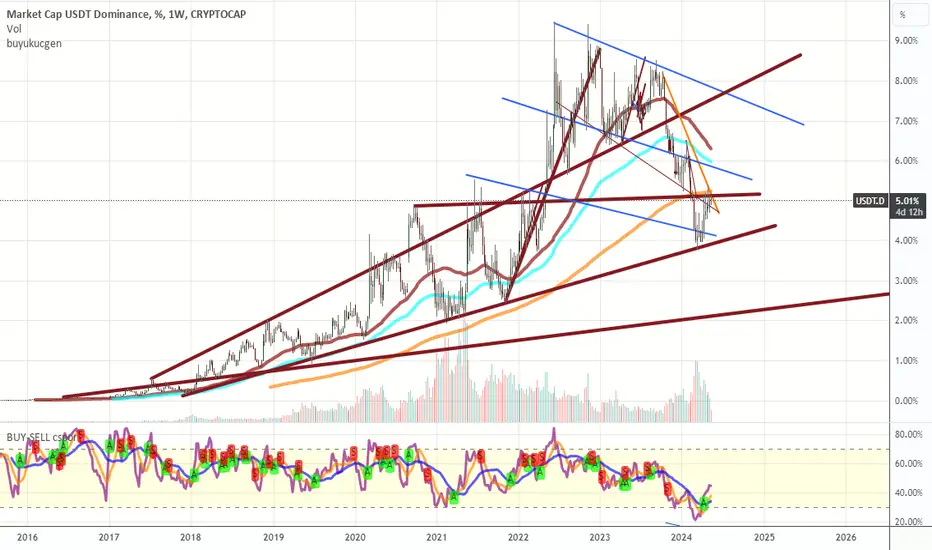
So, let's start with the plain USDT Dominance chart; it shows the percentage of the total crypto markets in the form of USD Tether. As can be seen, the USDT Dominance chart shows two ascending channels. The first is steeper than the second, and the reason for that is Tether's totalitarian nature, as back then there were no other worthy competitors, and most notably its quick acceptance by the crypto community—the traders.
Now, the second ascending channel is closer to the norm and, as such, can be used as a revealing indicator. It's easy, 1) when USDT Dominance goes down, that means most people are buying Tether, so there is a shortage of Tether in the market. 2) When USDT Dominance goes up, that means most people are selling Tether, so there is a surplus of Tether in the market. So what do these mean?
When people are buying more Tether than before, USDT Dominance decreases, and that means they are converting their fiat money, such as U.S. dollars, Euro, British Pound, Franc, etc., to Tether in order to buy crypto assets such as Bitcoin. Now, here is the important part: If more people are converting their fiat money into Tether to buy crypto coins, the demand for crypto assets will go up, and when demand goes up, so does the price.
When people are selling their crypto assets more than before, they are converting their crypto assets, such as Bitcoin, into Tether, so there is a surplus of Tether in the market, and as a result, the USDT Dominance increases. This happens when traders/people want to save profits or think the market could go into a downtrend/correction, so they sell their crypto assets and prefer to hold a stable coin like Tether.
Here, the USDT Dominance chart is compared with the Bitcoin price chart. As can be seen, when USDT Dominance went down, the Bitcoin price went up, and vice versa. So, when the Bitcoin price was decreasing, more people were selling Bitcoin and converting their crypto assets into Tether; thus, more Tether became available in the market, and as a result, the USDT Dominance went up.
The USDT Dominance chart can be used as a simple indicator to forecast Bitcoin's possible future movements.

Usdt.d 4h H&sPO3 h&s sym triangle.All these patterns shows up on USDT which means down for crypto.po3 respected.

USDT.DIn the previous analysis, as expected, an ascending log was formed in the form of wave B.
If this analysis is correct
You can wait for the fall of dominance and therefore the possibility of an upward trend in the cryptocurrency market.

big upside movement forcast by anlyse USDT.Din USDT.D chart we can obviously get our confirmation for another leg up.
the exact confirmation come after break and closing candle under 4.76% line.
next support is about 4% which is resistance of 73000$ in bitcoin

USDT DOM chartUsdt dominance in resistance now, now ready to turn back 4$ levels
it means that btc to 70-75k right now
lets see what happens in a month
USDT.DOMINANCE CHART UPDATE !!USDT DOMINANCE ANALYSIS
USDT.D is descending following a retest below the rising wedge. It's also breaking through the MA 50, with a candle close below it confirming a bearish sentiment. Notably, a bearish USDTD trend often indicates bullish momentum for the broader crypto market due to their inverse relationship.
I have tried to bring the best possible results in this chart.
If you like it, hit the like button and share your charts in the comments section.
Thank you.
