USDT.D Daily time frameUSDT.D Daily time frame shows possible of market reversal which indicat the dominance will continue the up-trend until reach the first main supports zone.
USDT.D trade ideas

money talkz - $#@!it walkz UPDATE USDT.DHi!
A lil update, we can see a Mr.T now - looks like will see uptrend for BTC.D, TOTAL2
correction and target for wave C will be updated leyta :)

USDT.D Can can bounce from this areaAfter breaking the bottom of the weekly channel, Dominance Tether has correction equal the mid-line size ofprevious channel, the current collision zone was an important support zone in the past and was able to cause a strong growth of Dominance. Considering that the weekly candle body has not been closed in this area for the past few weeks. It still seems that this area can be a good support for Dominance and cause Dominance to jump up to retest the bottom of the broken channel.

USDT.D pivot point USDT.D is close to its pivot point back up to 10%, this move could bring price towards 70k before final leg up for BTC. Let's see how it plays out..

USDT DOMINANCEHi , Dominance of Usdt confirmed bearish channel so should big pump for BTC and Altcoins .

USDT.DIt's getting interesting!
Will the dominance of USDT break a trend that has never been broken in its modest history?

USDT.D po3As you can and as I mentioned my previous analysis.Btc and crypto market try to rest.I think after April we can continue.
USDT.D sym triangle CRYPTOCAP:USDT.D ,It seems like BTC doesn't want to go down. There's still an issue with the head and shoulders formation. However, a symmetrical triangle formation has occurred. There's potential for an increase until the halving.

USDT.D update 24.jan.24well, my mistake to ignore previous movementz, its fixed.
now its look more clarify

#USDT Dominance: When AltSeason?My previous chart was hidden by tradingview because of some mistakes. So posting this again with a little change!
Tether broke the long-term support of almost 2184 days. This is an amazing development in the price action. The current level is the point for reversal. If there's any big correction happening, it should be around the halving.
TBH, this chart gives me chills. Imagine if this keeps dumping, you'll see $100k in the EOY! Of course, the road will be bumpy, but sooner or later, it's coming.
Alts will have their time after the halving, Possibly June -July to September 2024!
We could see some massive Alt Rallies!
Invalidation: This chart will be invalidated if we break and close above 4.81% in a weekly candle.
Do your own research, no financial advice.
I hope this chart gives you some clarity over your trade decisions.
Please hit the like button if you found it helpful and share your views in the comment section.
Thank you
#PEACE


KEEP WATCHINGI have to see if it can break over red line. I believe it will even crash that huge support then market will raise

usdt.dDominance TetherDominance Tether is pulling back to the rising line in one-day time
I expect a break to the specified box of 2.93 to 2.03

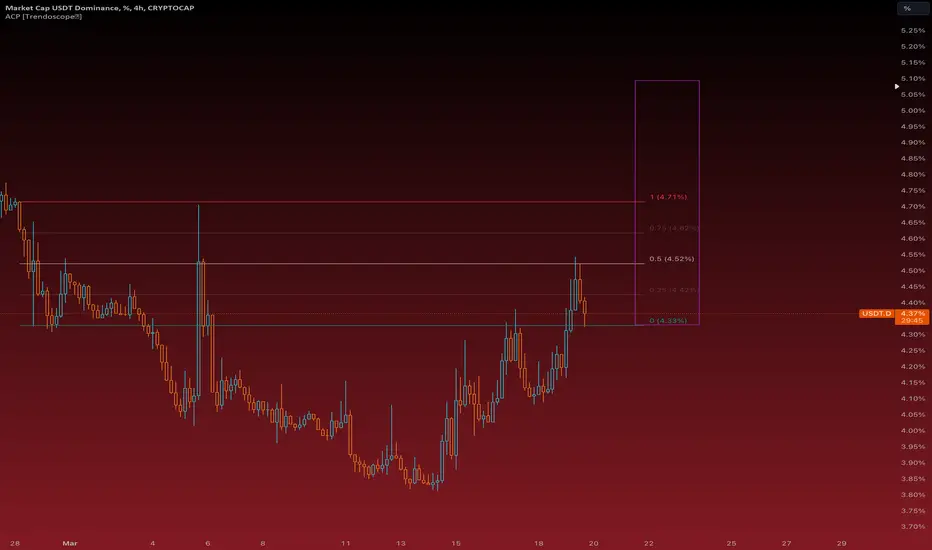
$USDT.D ChartCurrently we seeing a dump here for USDT.D and we all know that this is bullish for crypto thus im waiting for price to close below 4.27% as this would confirm move upside for crypto


usdt.dIf the Dominance Tether moves down and breaks the 3.8 level
Dominance Tether moves to the level of 2.5 and we can see the upward movement of many altcoins again.

PATIENCE IS KEYif usdt.d break the 5% resistance which it will likely try to break it soon, then we can even have a new high for usdt.d and new low for BTC. If it fails to break it then we can see #BTC rise to 80K. Taking a look at the divergence on #USDT.D chart , BTC crash is more likely to happen so don't FOMO and wait.

I hope you are not just fooledResistance level 0.236 Fibonacci 3 points k resistance of the downward trend line.
Market is come up

Local top April 1st for BTC BitcoinLast time the RSI for weekly Tether dominance reached 30, it took 119 days before the Bitcoin bull run took a pause and had a big crash.
119 days from dec 4th , is April 1st.
Could that be a local top?

Don't be fooled, it will fall⬇️⬇️⬇️Don't be fooled by this climb, the whales are rallying strongly and in the coming hours the market will be bullish

#USDT.D#USDT.D price action analysis(#smart_money):
Support (green) and resistance (red) areas ahead of the movement of #USDT.D that will react upon reaching them. If you pass through any area, the role will change in the area.

Destiny 1h USDT.DAs can be seen in the picture, the indices from the exchanges were issued to liquidate the traders, but the resistance of the blue trend line, which is very accurate and of course important, drawn from the candlestick trunks, shows us that the decline continues for the Chart USDT.D

Destiny Update 1h USDT.DThe new update, if you see the previous analysis, I insisted on the drop from a technical point of view, and we can see that it happened well, I hope you have used it.
