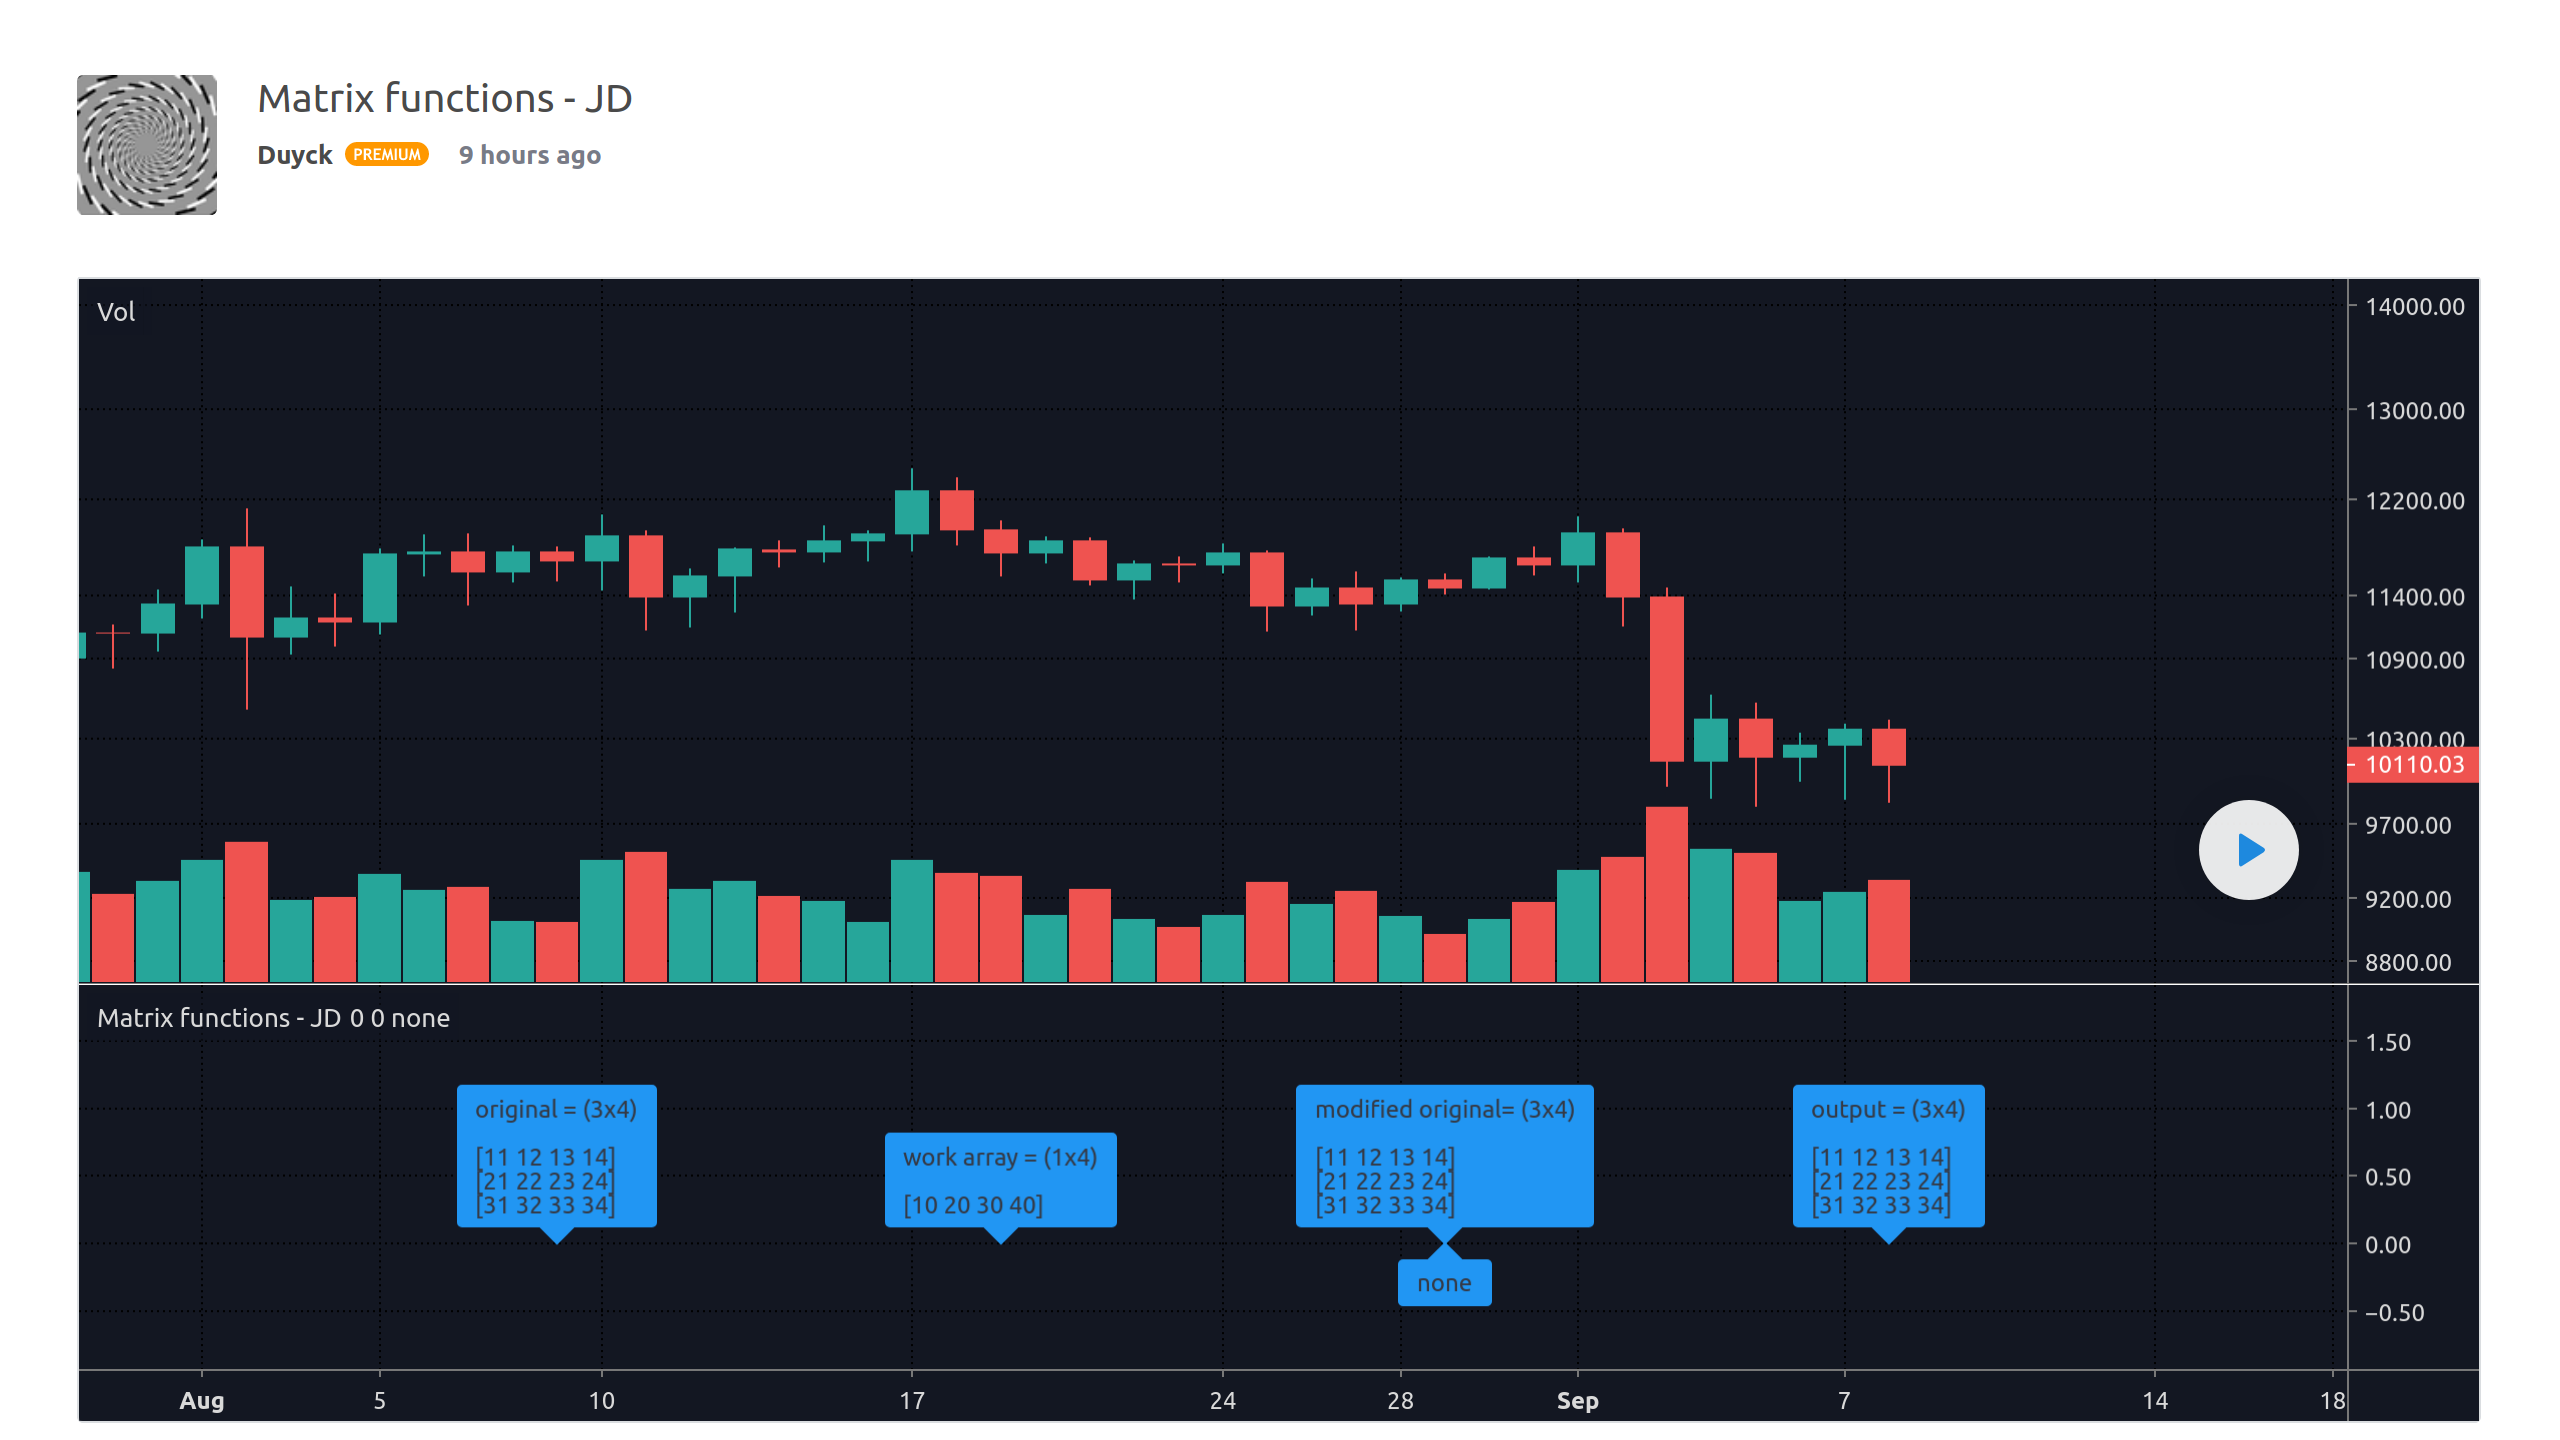
Pine脚本现在可以使用强大的新阵列功能来创建自订数据集。阵列允许编程人员在包含以下类型之一的元件的一维资料结构中进行填充、管理、和计算,从而显著扩展了Pine的建模功能:float, int, bool, or color。
这行程序码建立了一个称为 level 的阵列,其中包含三个以值 na 初始化的float元件:
levels = array.new_float(size = 3, initial_value = na)
阵列支持动态调整大小。特殊函数允许对阵列进行各种转换,包括复制、排序、和分片。特殊用途的数学函数也可以在其上进行操作:array.min(), array.max(), array.stdev(), array.avg(), array.median()等等。
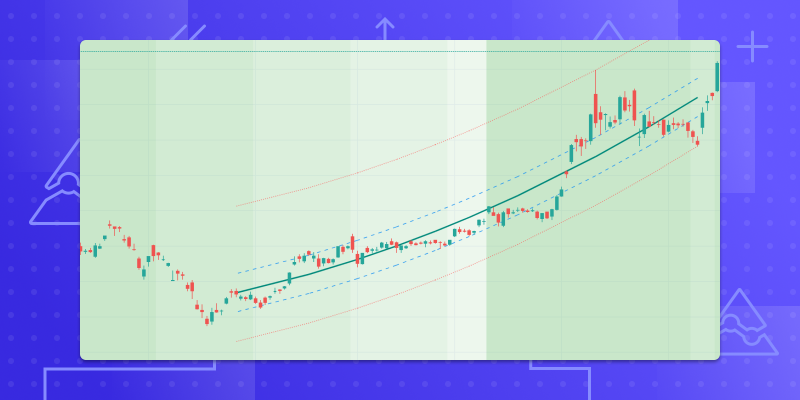
本范例使用阵列来创建仅包含数量增加的K线价格水平的数据集。然后绘制这些值的平均值。该阵列在此处用于实现FIFO(先进先出)结构:
//@version=4
study("Price Avg Of Increasing Volume Bars", "", true)
i_levels = input(20,   "Levels")
i_src    = input(hlc3, "Source")

// Initialize array of user-selected size with `na` values.
var levels = array.new_float(i_levels)

if rising(volume, 1)
    // Remove the oldest level from the beginning of the array.
    array.shift(levels)

    // Add the new level to the end of the array.
    array.push(levels, i_src)

// Calculate the avg of levels in the array, excluding any `na` values.
level = array.avg(levels)
plot(level, "Level", close > level ? color.lime : color.fuchsia)
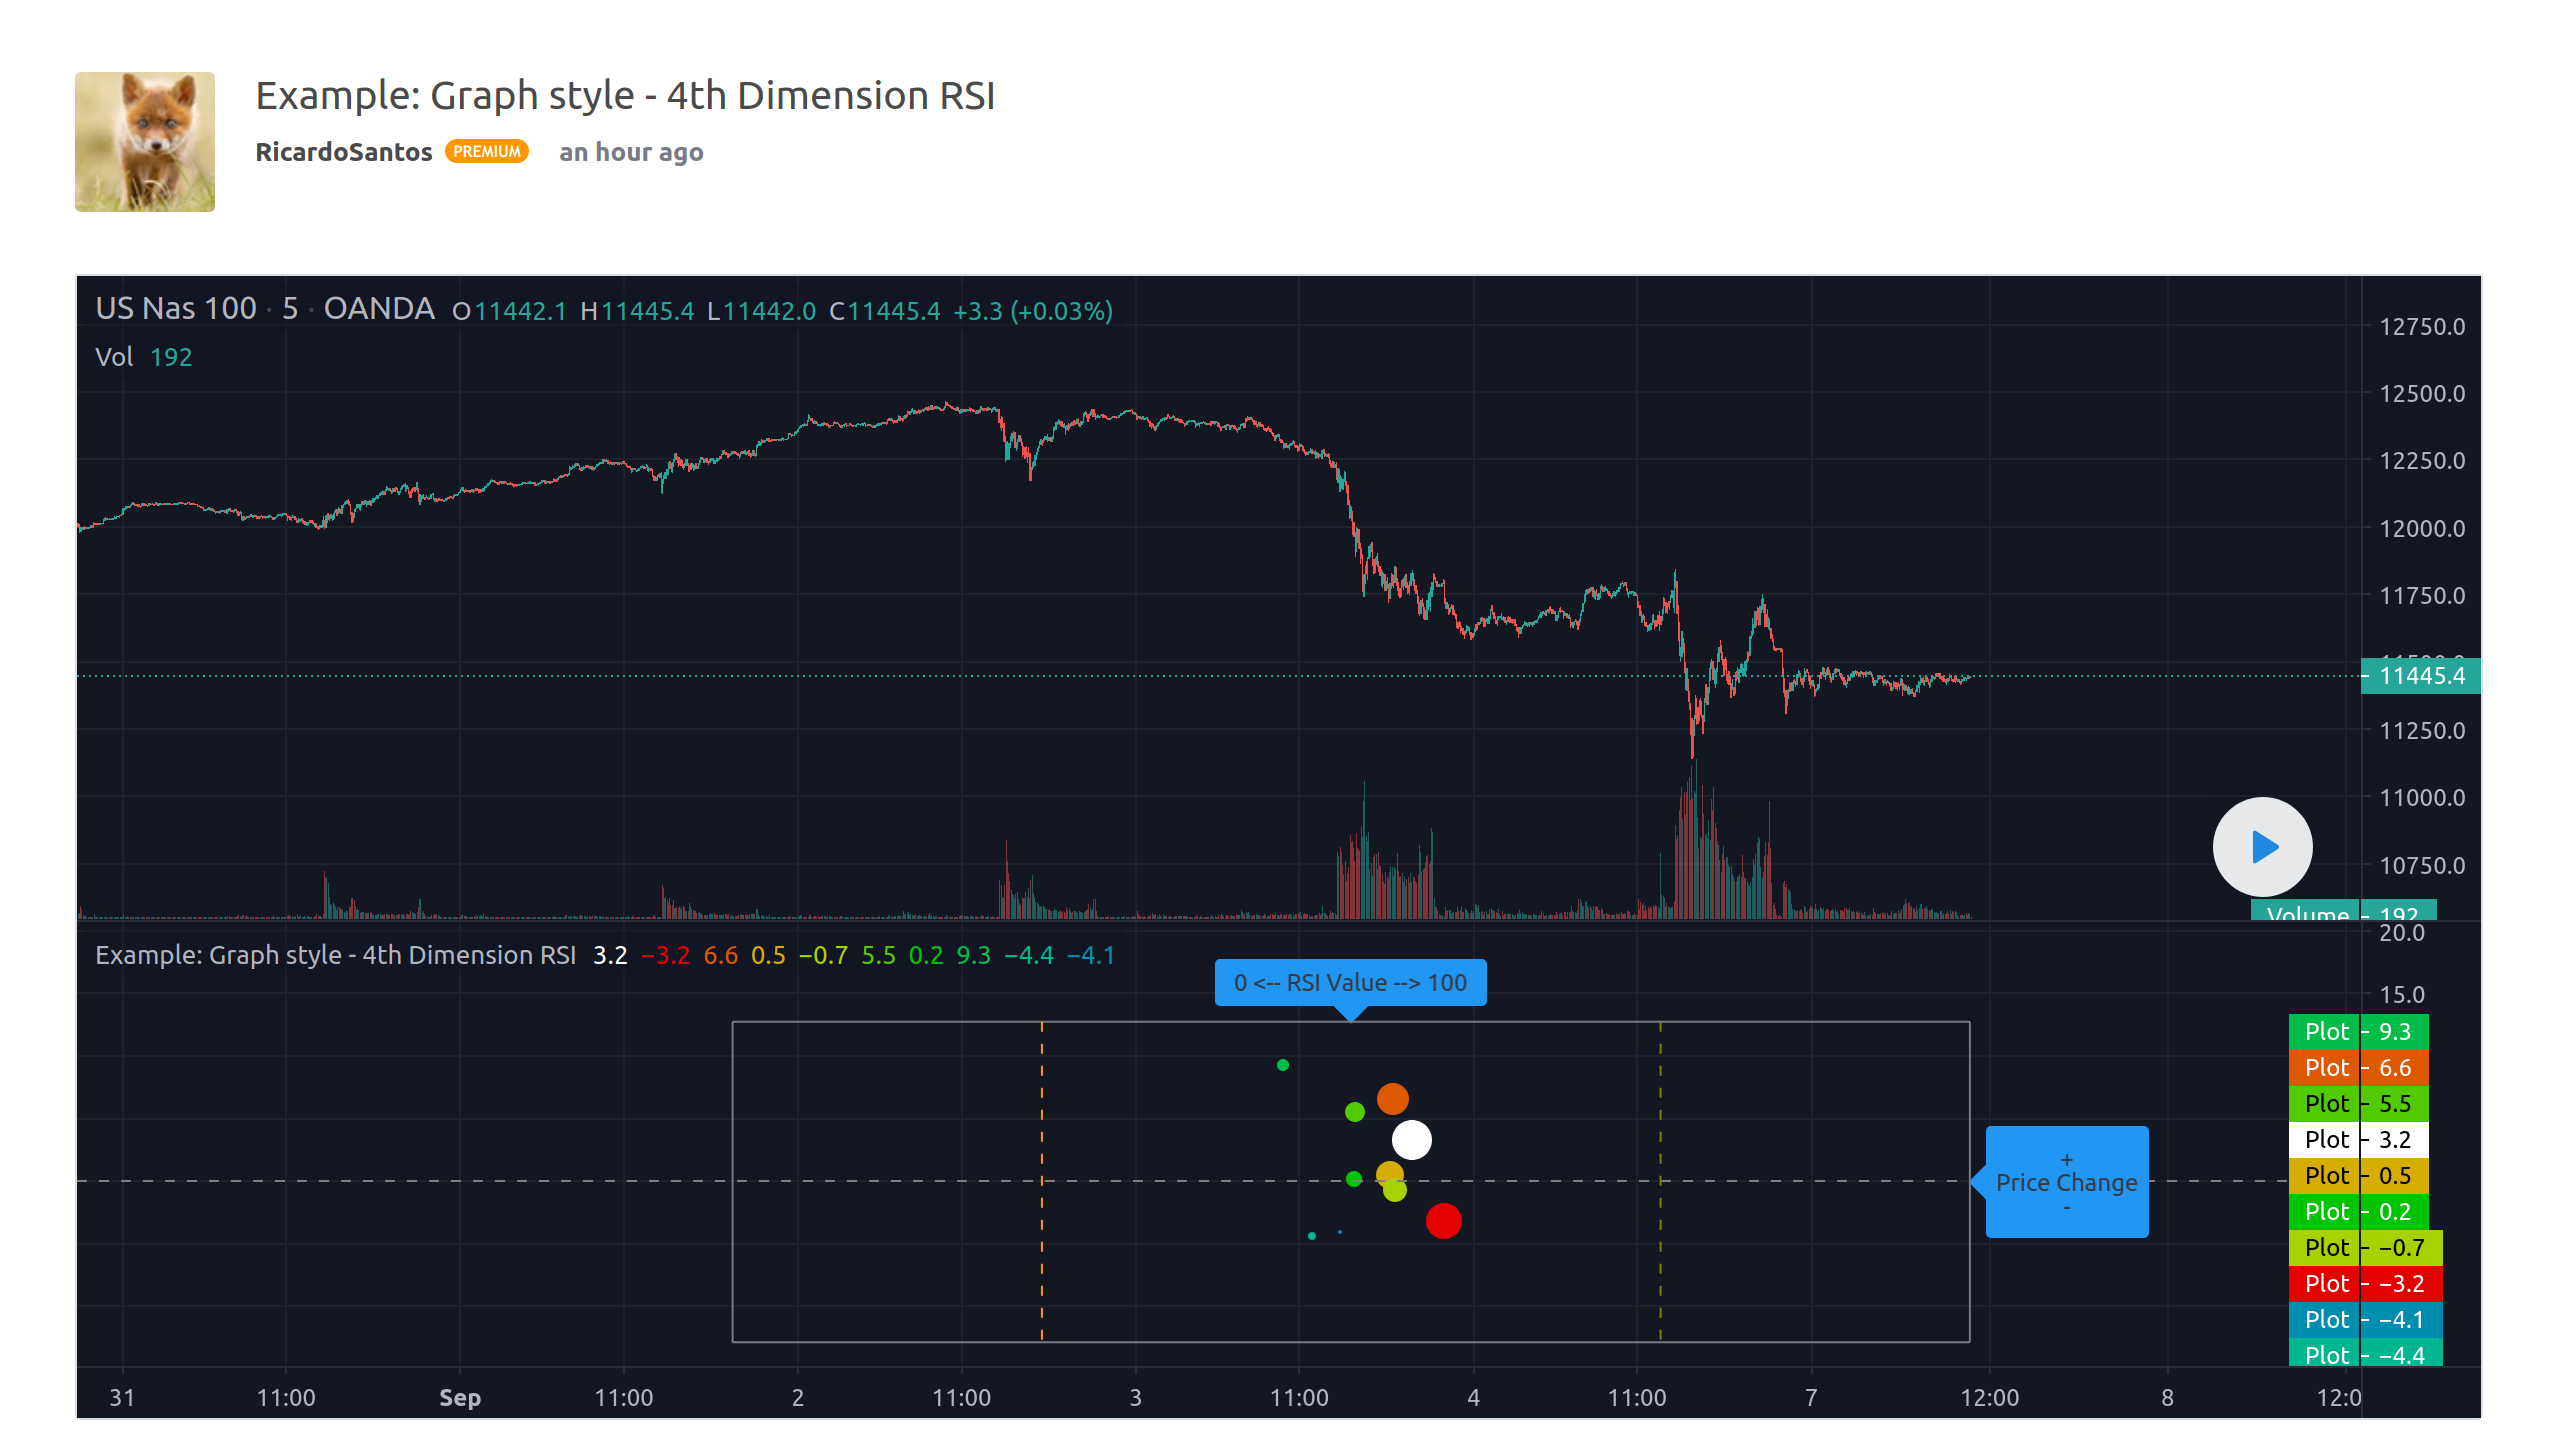
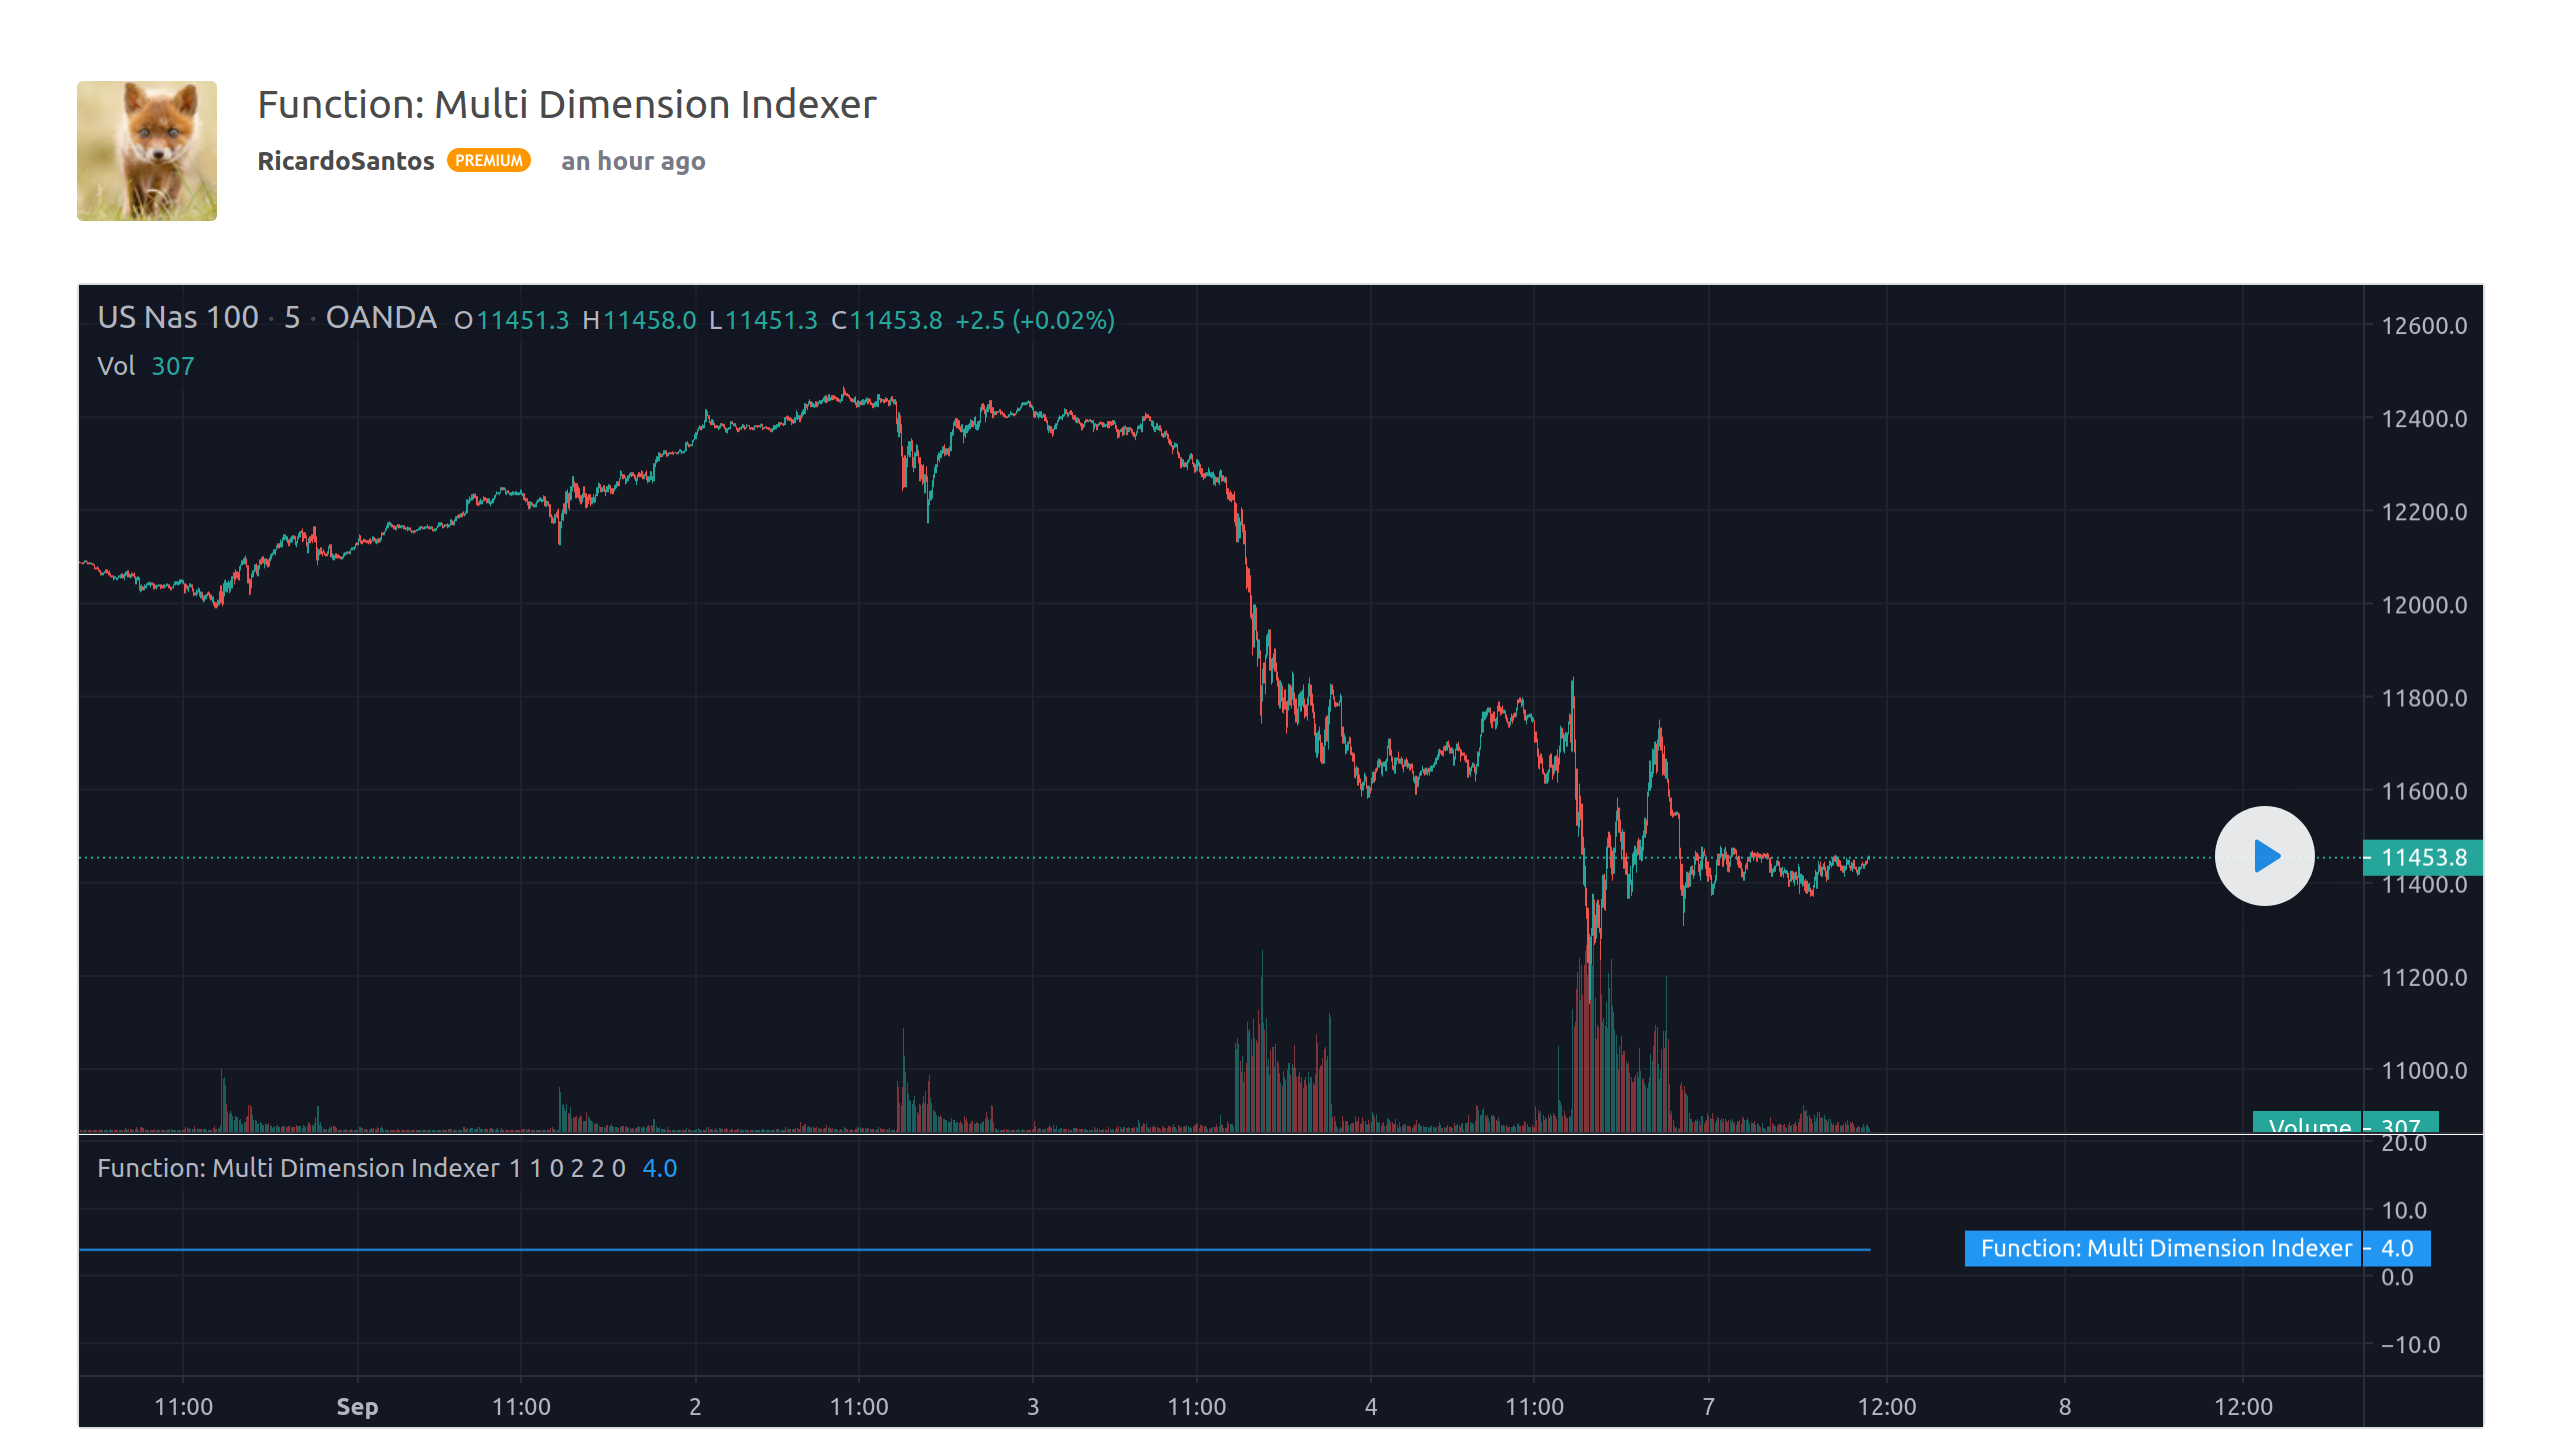
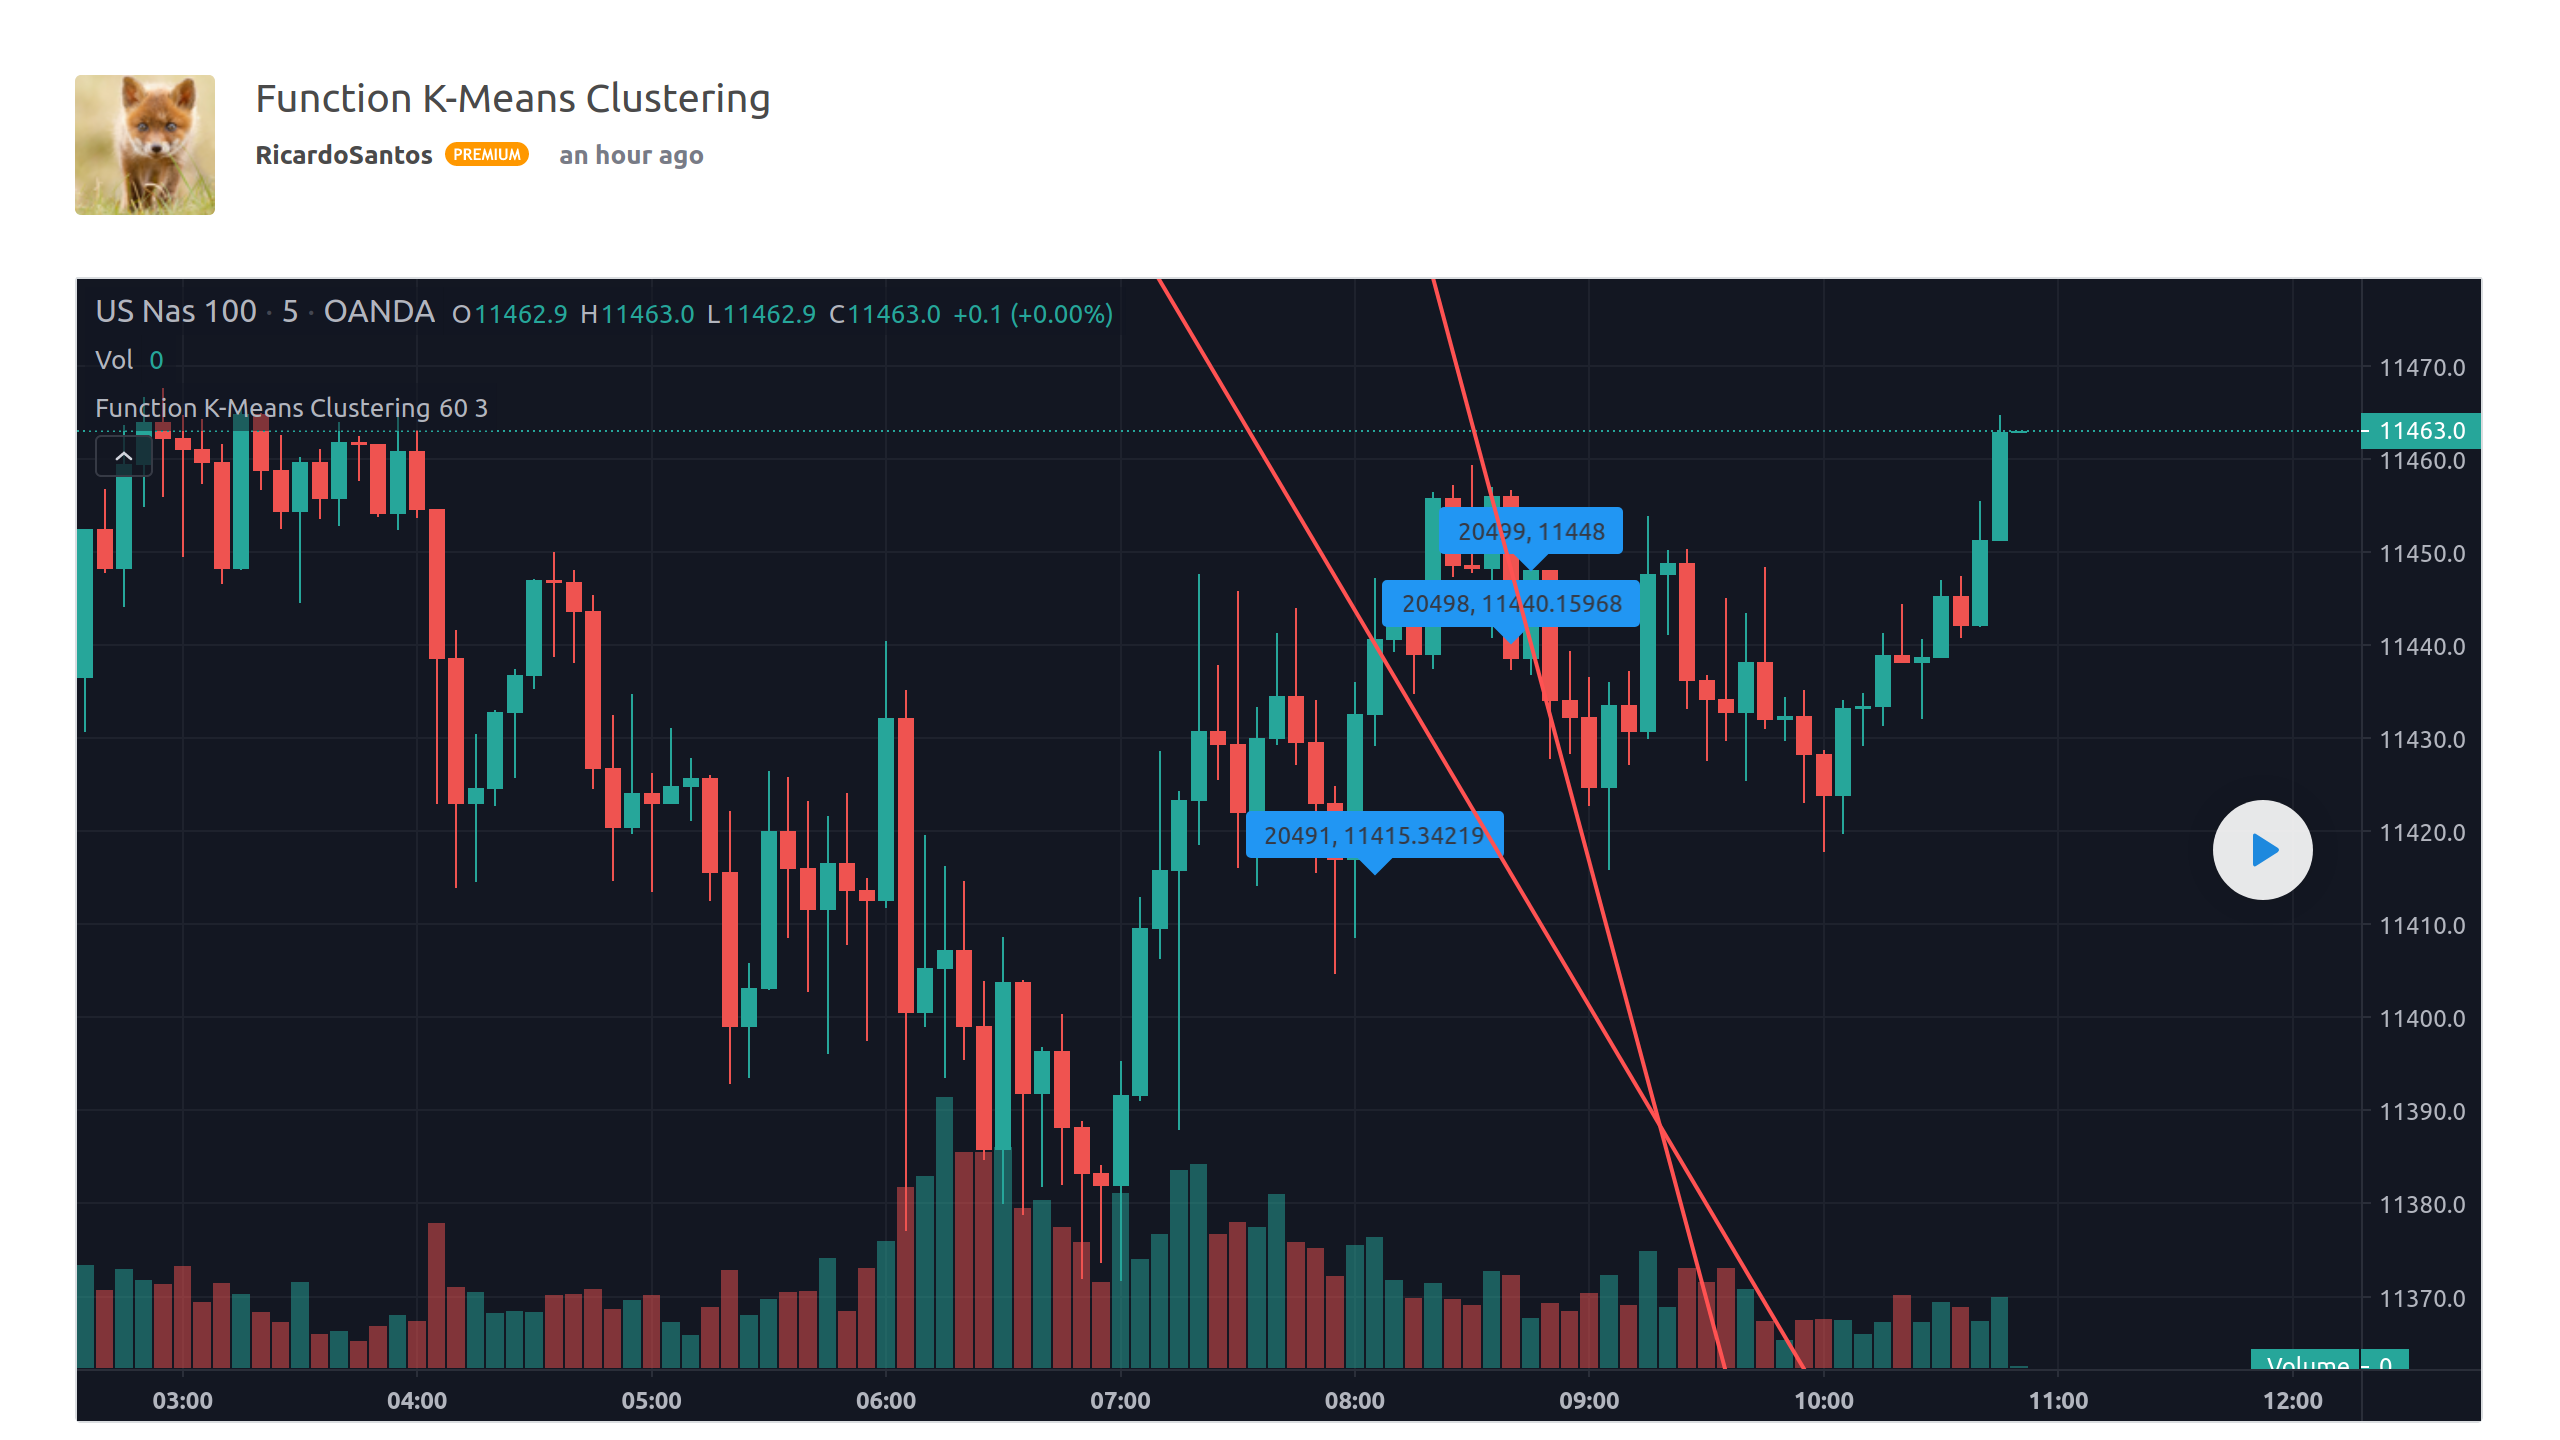
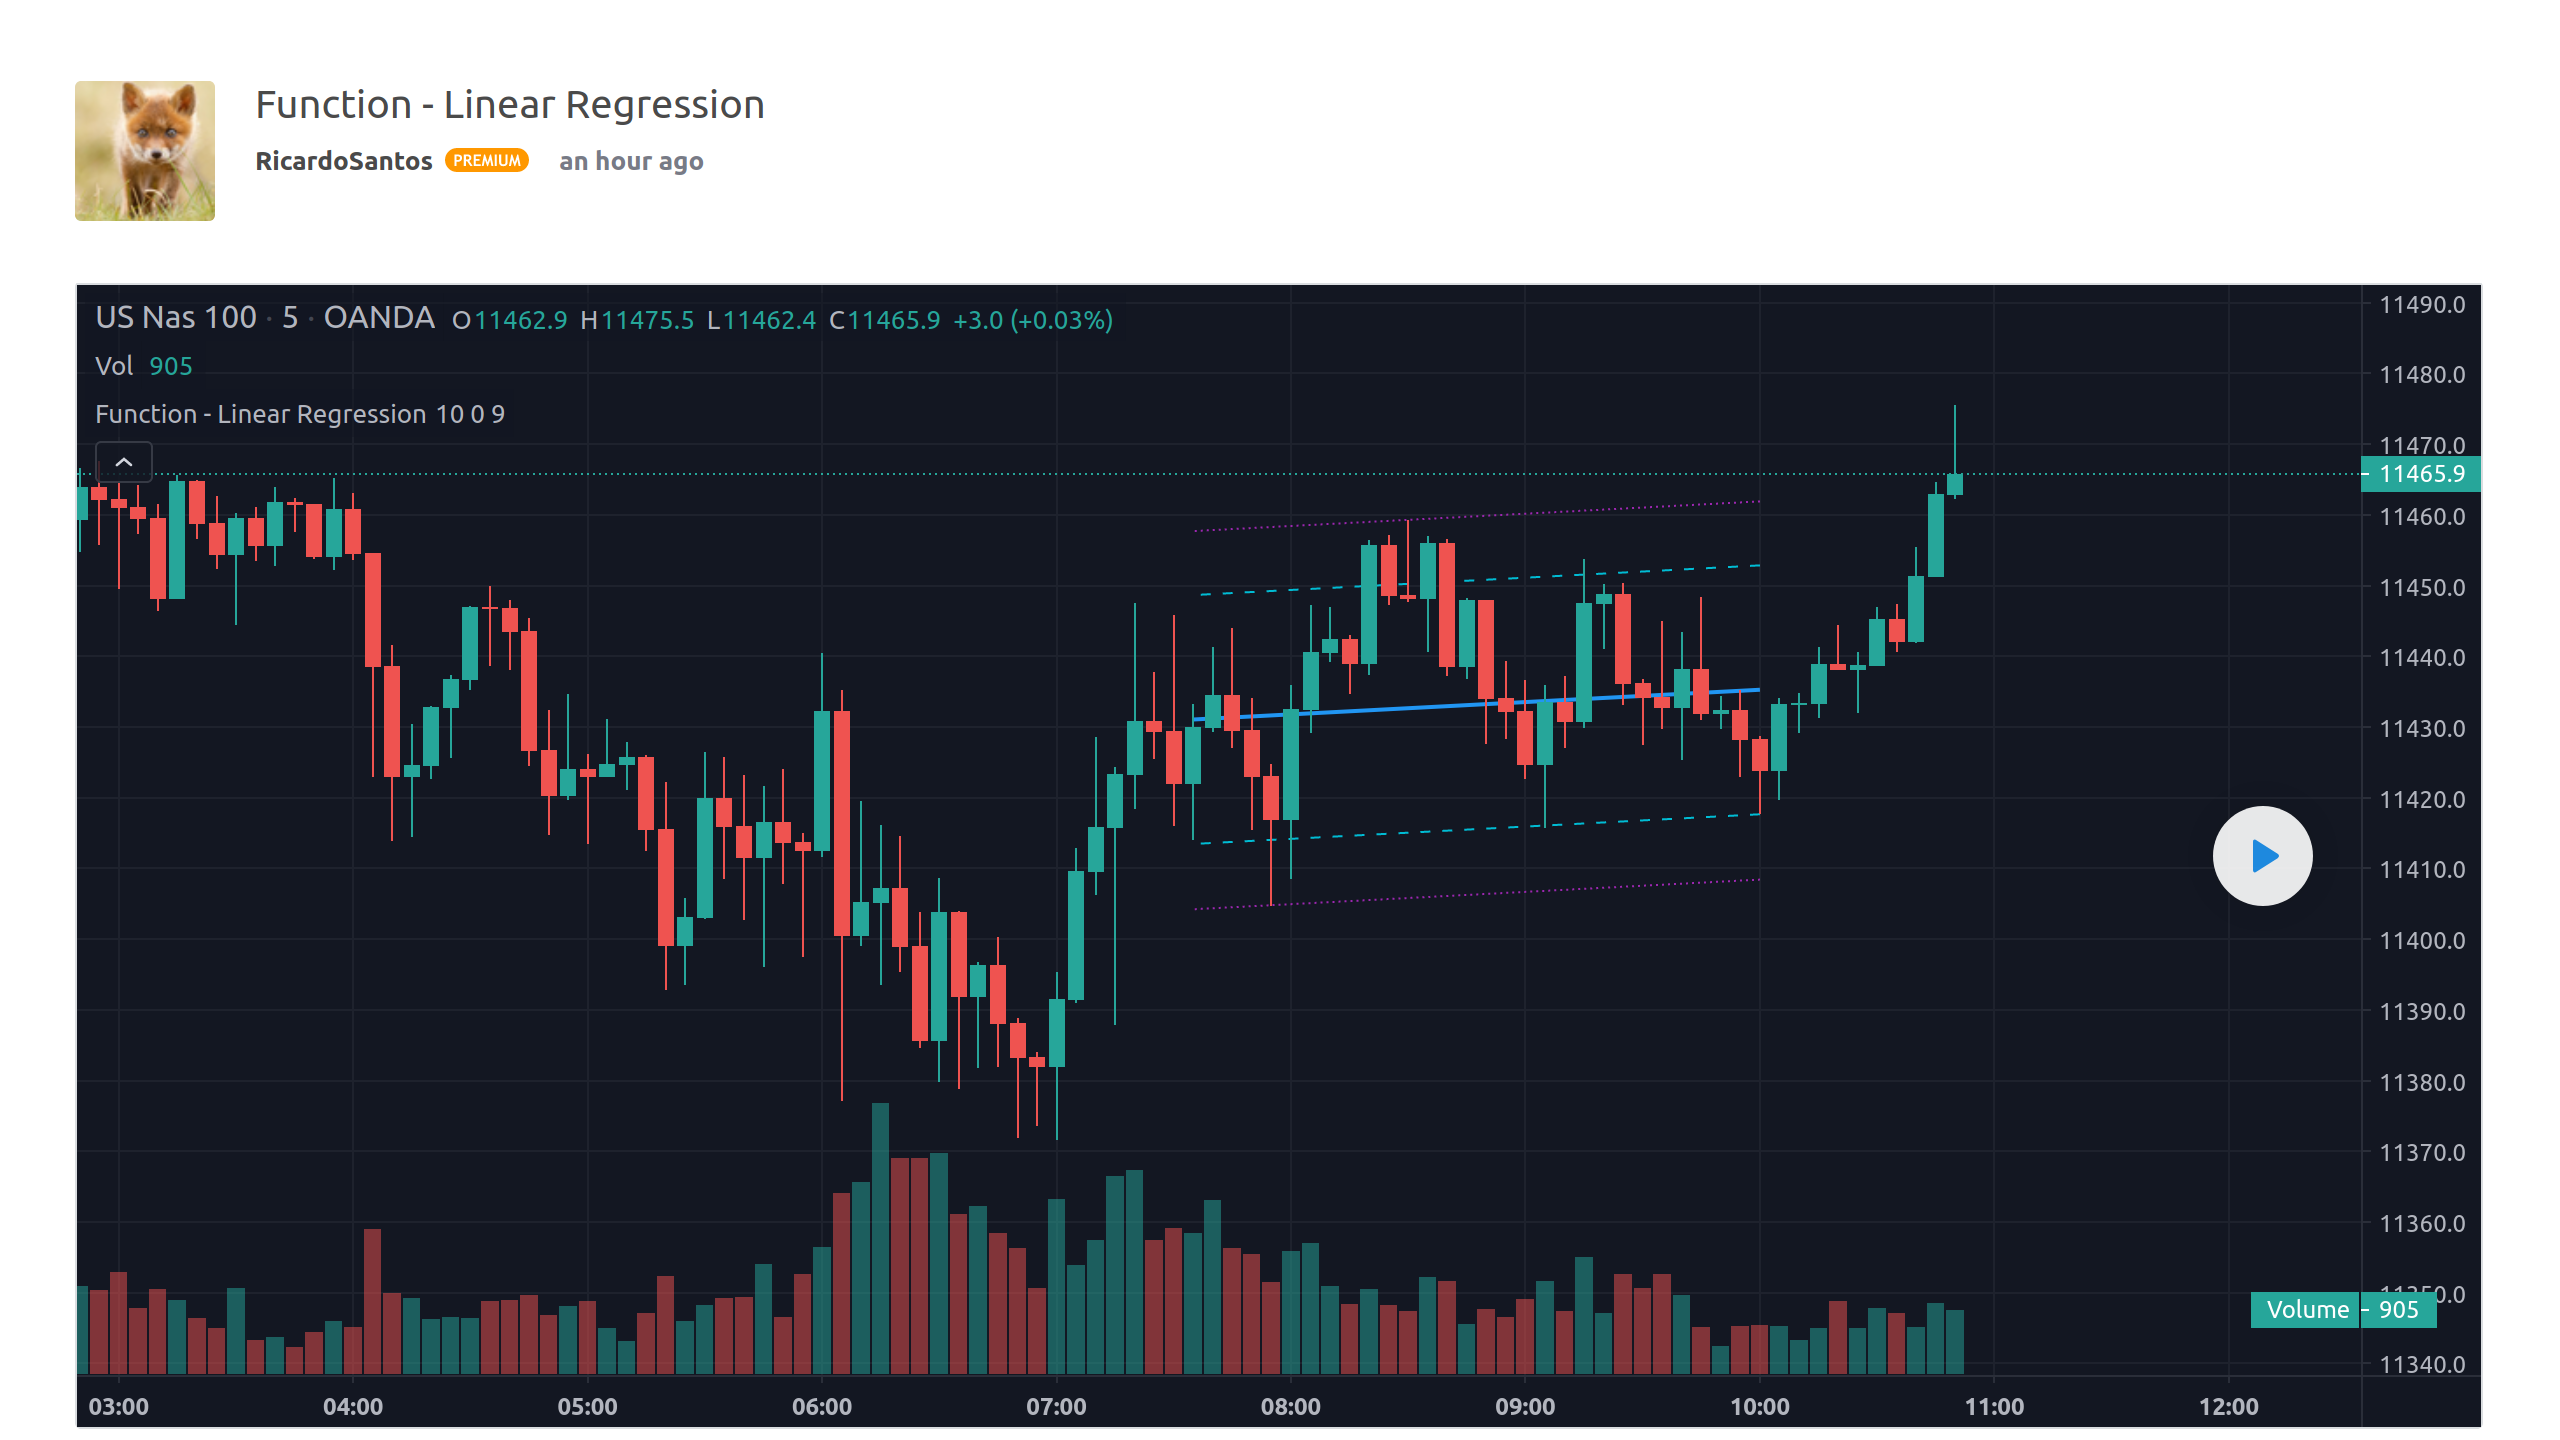
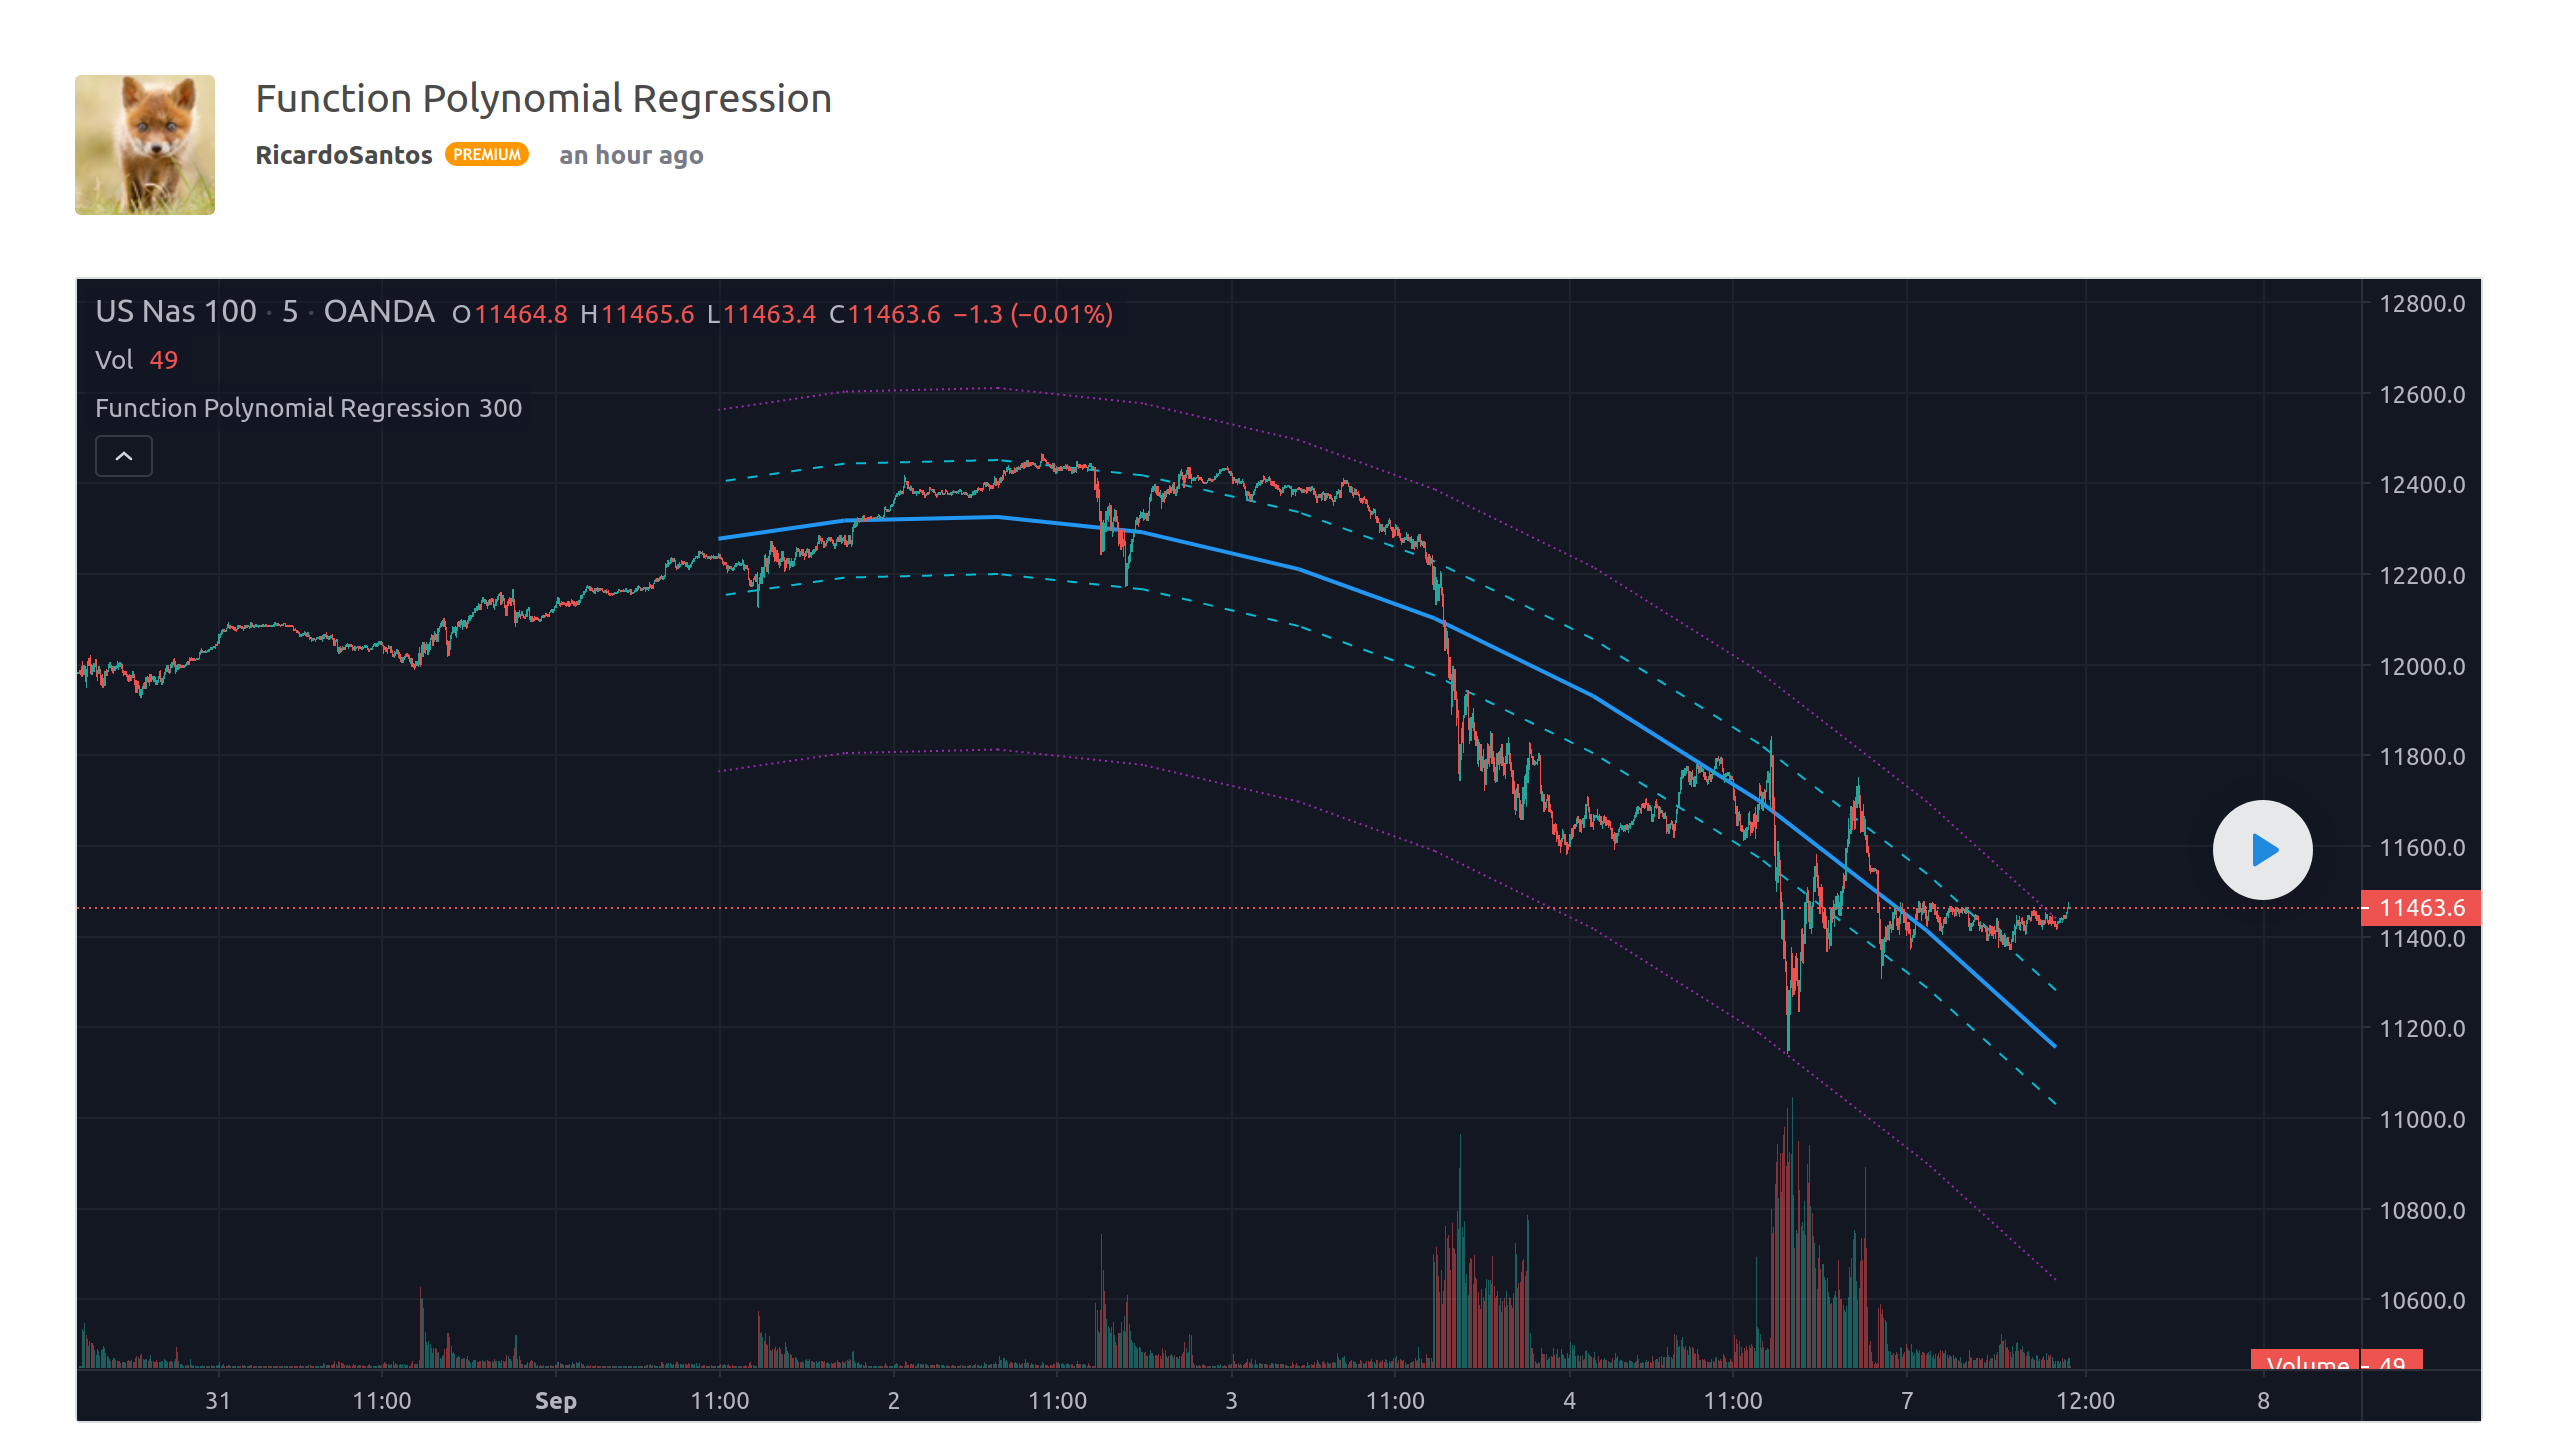
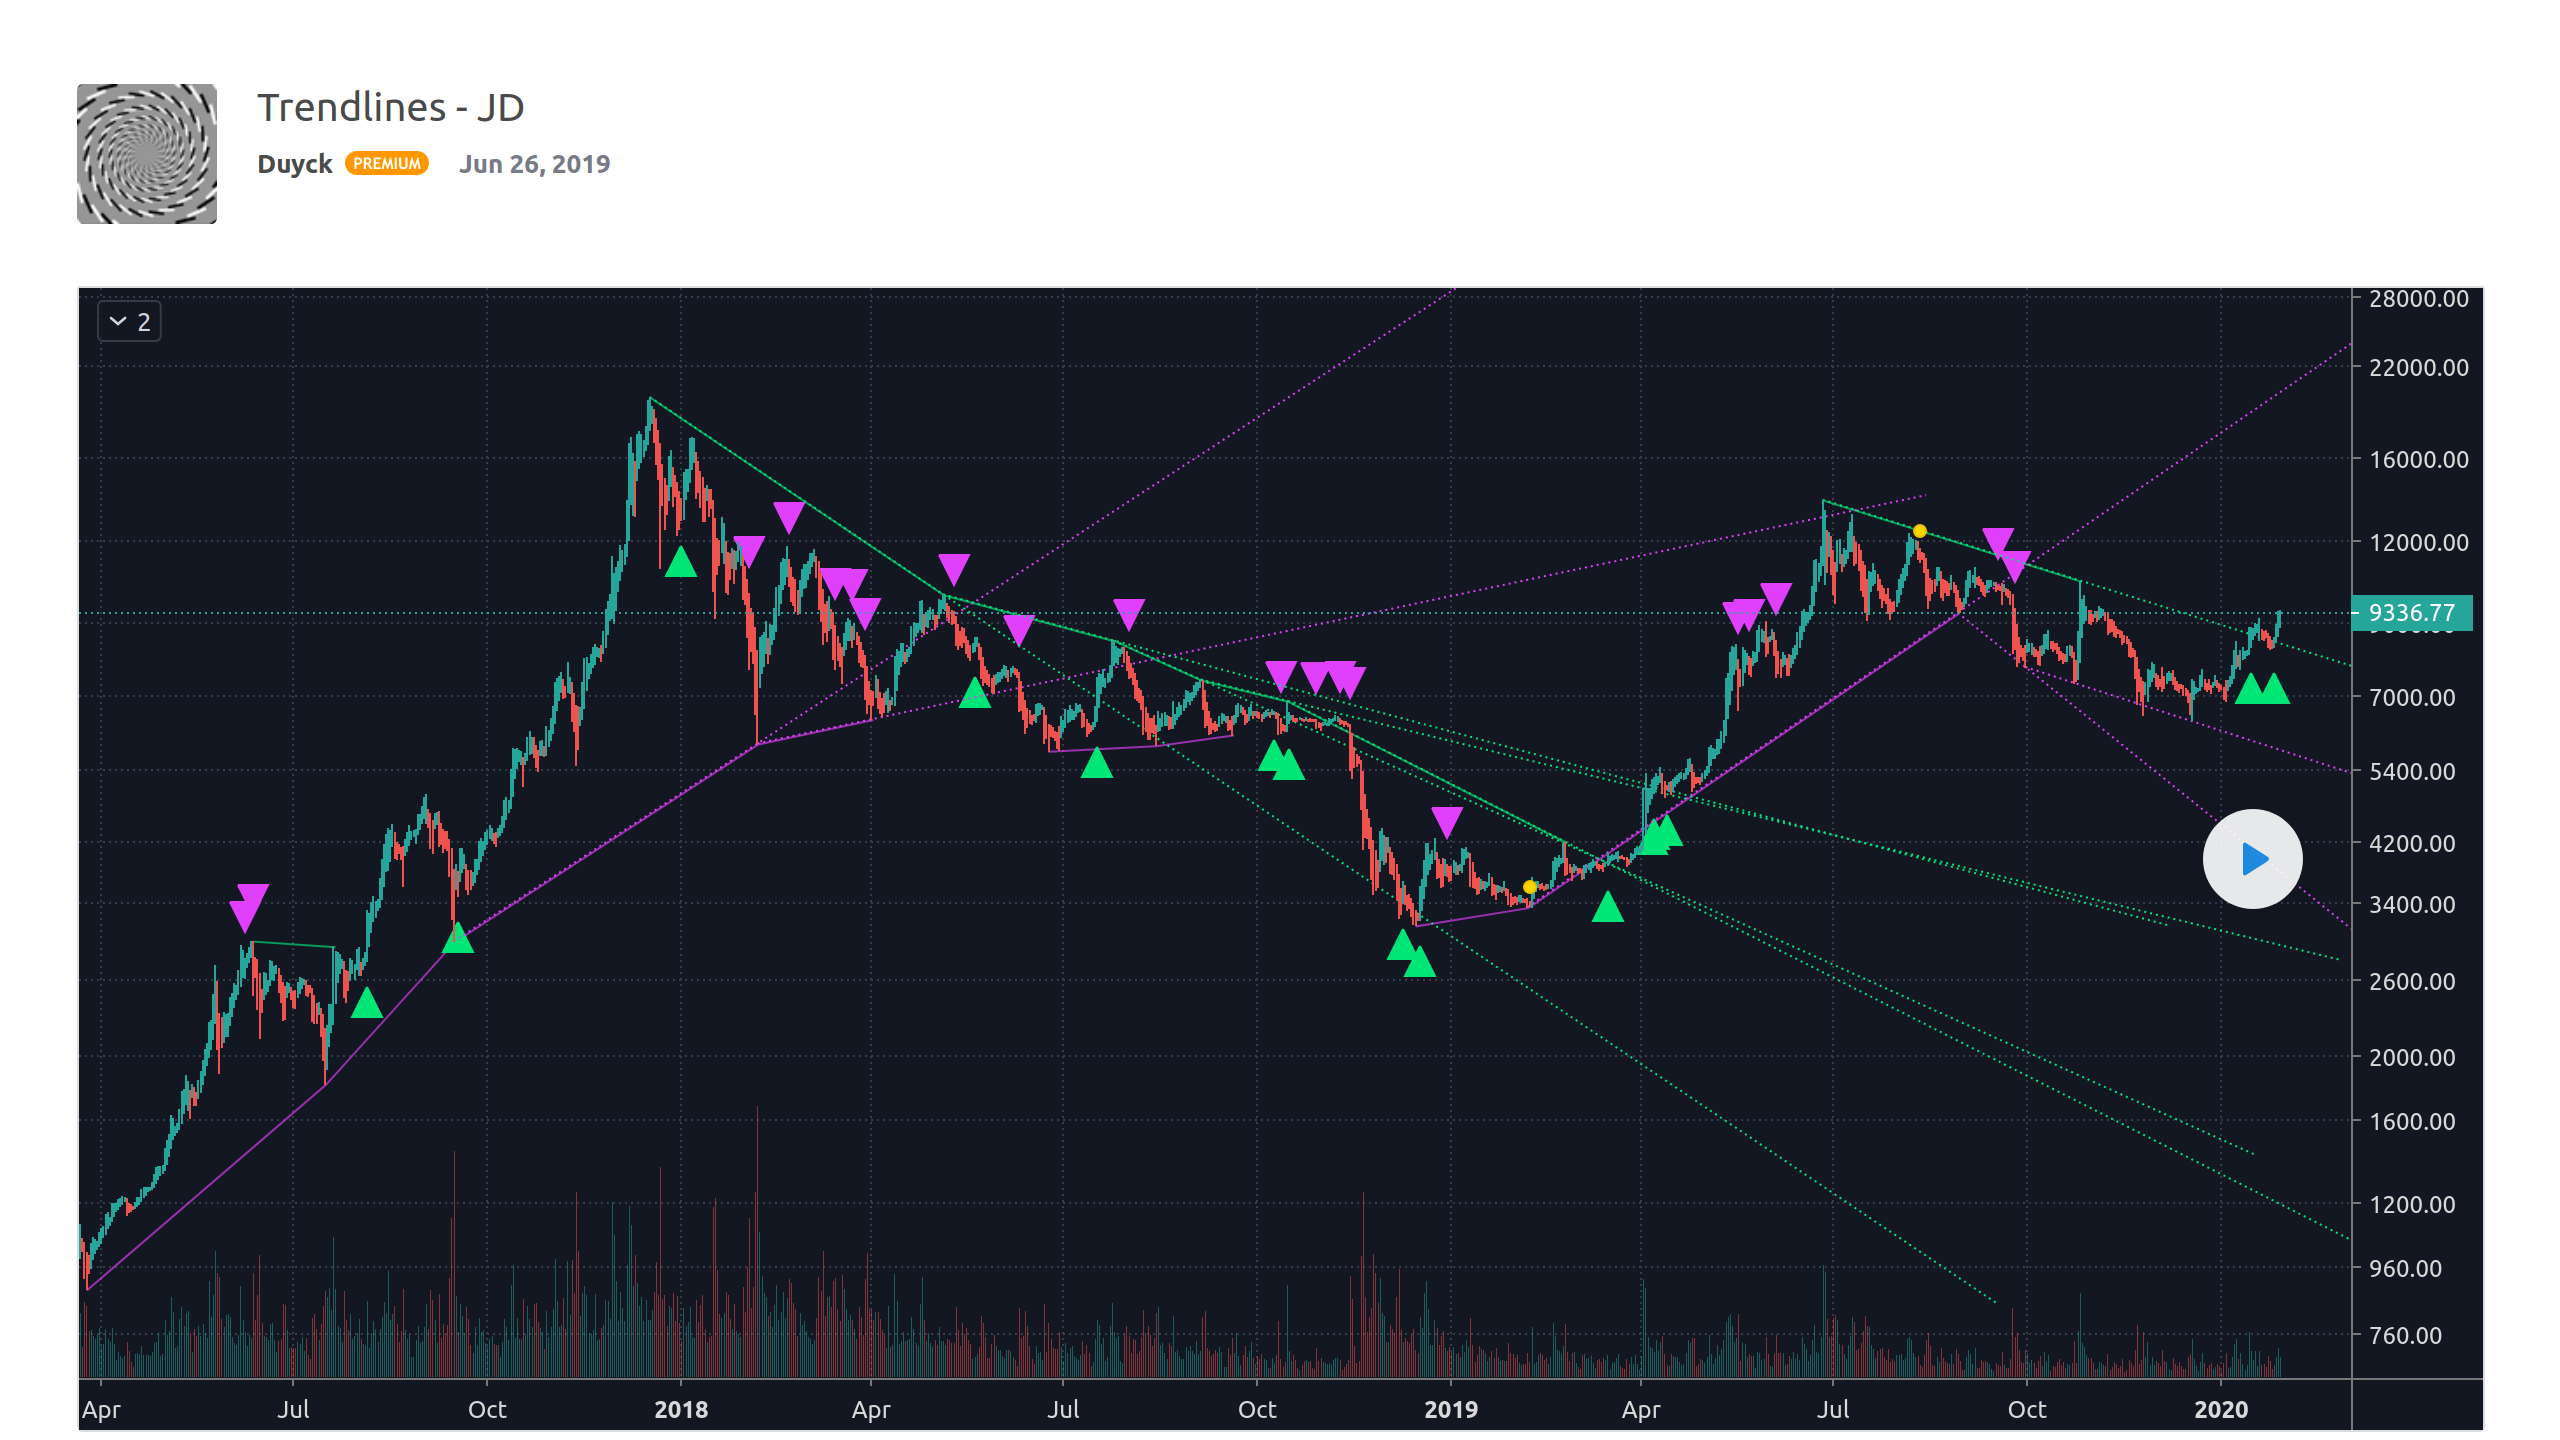
Pine用户手册的阵列章节将帮助您入门。另外,请参阅PineCoders在这些脚本中发挥作用的阵列,他们在测试阵列方面为我们提供了最大帮助,我们由衷地感谢:RicardoSantos 和 Duyck:
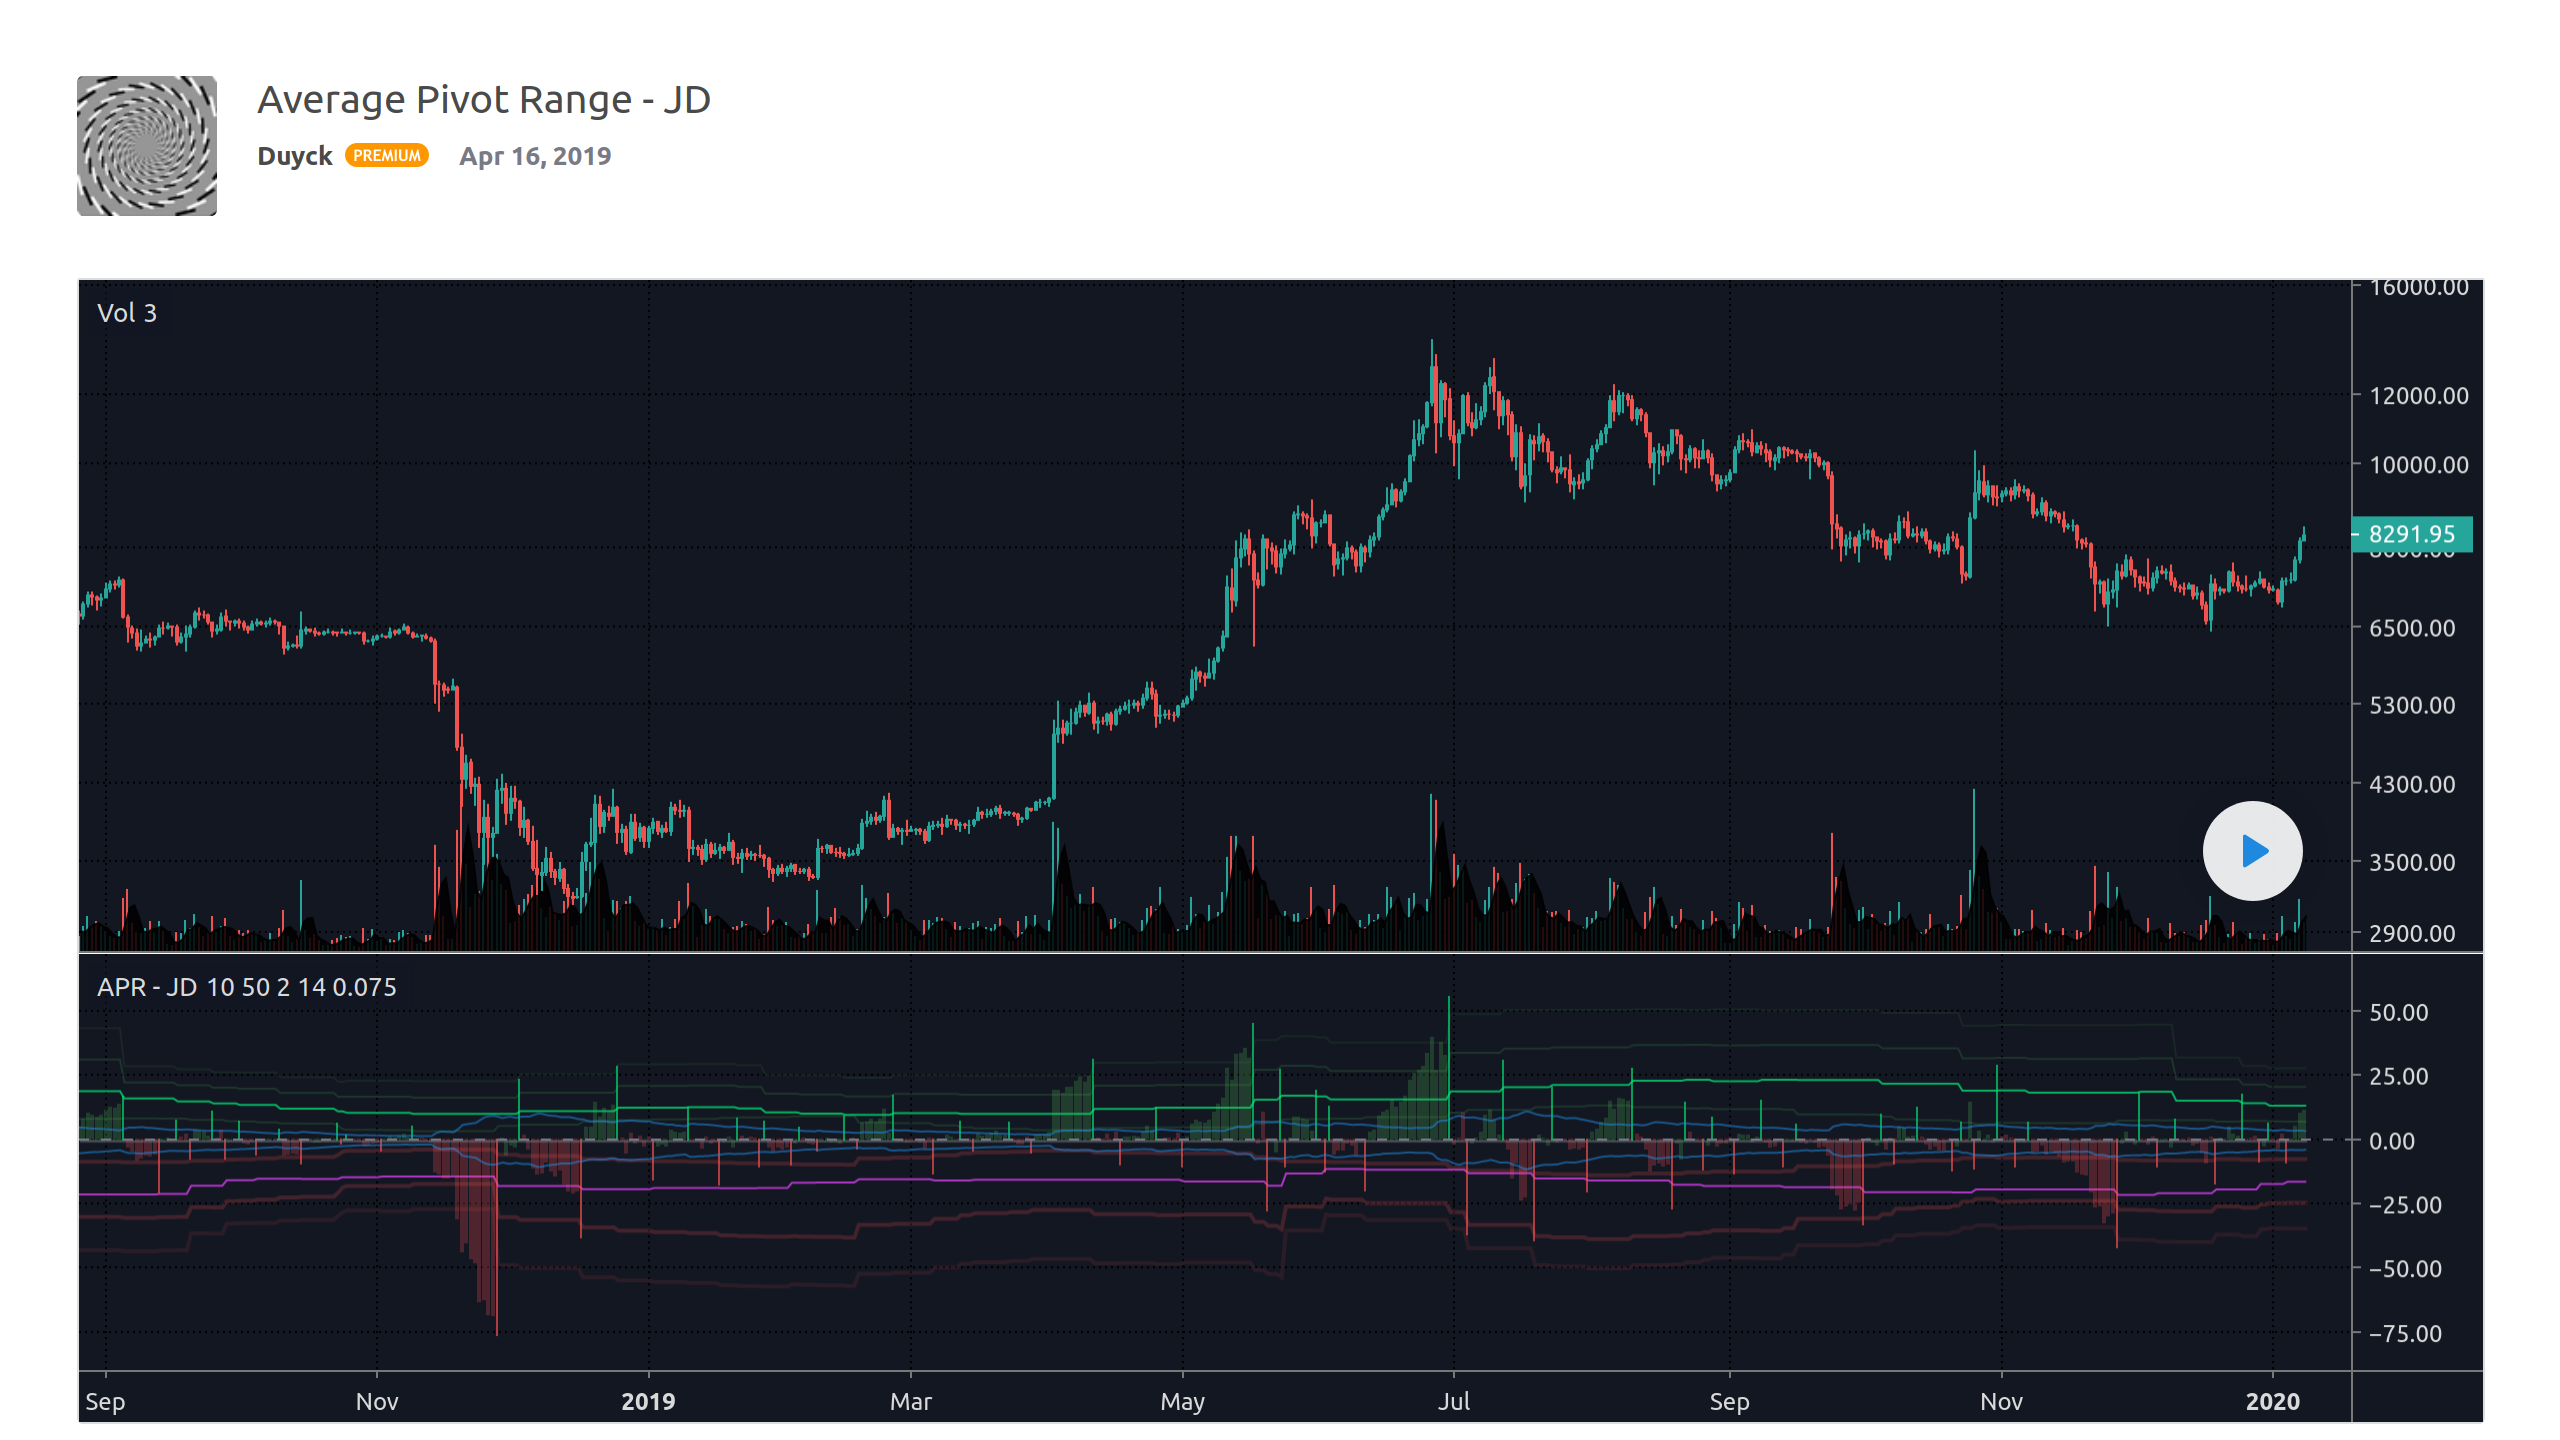
Graph style – 4th Dimension RSI
Function – Multi Dimension Indexer
Function – Polynomial Regression
这些脚本让我们看见了阵列如何重新定义Pine的可能性,以及它们如何为所有TradingView交易者提供比以往更强大的指标和策略。我们喜欢看到它。
我们希望这项新功能对您有用。请继续向我们发送您的反馈以进行改善。我们为您构建TradingView,并希望听听您对我们平台上这些被广泛要求更新的看法。
还没有关注我们的中文微信公众号?快来扫二维码吧!