We’ve just released the latest version of our Chart Library and Trading Terminal, with new styles, bug fixes, and more adaptiveness as well as convenience, especially for mobile devices. Here’s what’s new. Note that you have to be logged into your GitHub account to view the following links.
Major changes:
- New and convenient style of the buttons on the panel (Github issue #4608).
- New adaptive legend view (Github issue #4607), drawing object dialogs (Github issue #4600), and Chart Properties dialog (Github issue #862), especially relevant for mobile devices.
- You can now zoom a specific area of the chart with Ctrl (Github issue #4606).
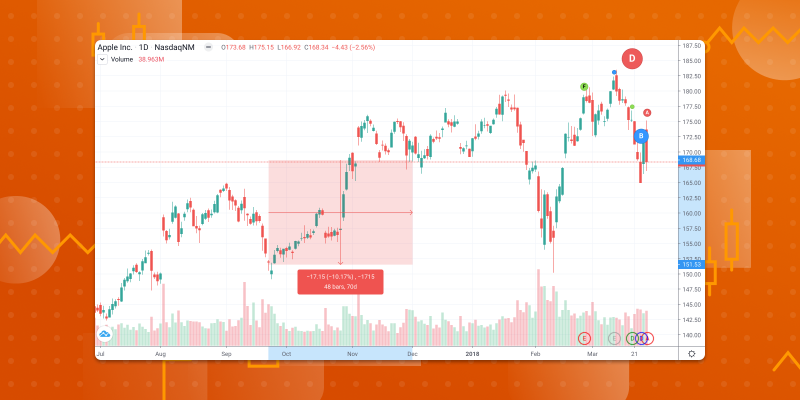
- Updated the Measure Tool style (Github issue #4604), the indicator loading status (Github issue #4603), and the drawing tools info box (Github issue #4602).
- Tracking mode is now available in the library (Github issue #4111); and
- IE support has been stopped and all related tasks have been closed (Github issue #4238).
API changes:
- Added the ability to configure Exchange weekends and working days for the session (Github issue #4467).
- Extended the API for attaching indicator and series to a specific price scale (Github issue #4788), so you can now create an indicator linked to a specific scale and move indicators and series between scales.
- Added an event for changing the series scale and indicator (Github issue #4884). You can subscribe to this event and find out which indicator has moved in real-time.
- Adding an indicator using createStudy (Github issue #4590) and the action of changing the theme can be reversed by the user (Github issue #4982).
- Added the getTheme method that returns the name of the current color theme (Github issue #4534).
- Added the ability to find out/change the color or style of a series of one specific chart in the layout (Github issue #4169); and
- Previously, all drawing objects created via the API were placed on a chart with the main series. Now you can choose which chart to place it on (Github issue #3408).
Terminal:
- Added getters/setters/events for syncing Symbol, Interval, Crosshair, and Time (Github issue #3997).
- Added the always_has_called_order_to_modify featureset to get modified order info (Github issue #4705). You can now choose which order will be returned after the change, modified or parent.
- If interval synchronization is enabled, the Date range will now be applied to all charts (Github issue #4605); and
- Added missing tooltips to the bottom buttons in the DOM Widget (Github issue #3979).
Other features:
- Added the ability to disable horizontal and vertical chart scrolling (Github issue #4483), which is especially convenient for mobile devices.
- A more flexible implementation of the method for changing the colors of library elements. Currently, you can change all colors visible on the original screen. The toolbar_bg is hidden for the widget and can no longer be set (Github issue #3998).
- Added the featureset to display the header in full-screen mode (Github issue #2610).
- Now the font size for drawing objects can be set in pt (Github issue #4353). If an invalid font value is entered, a warning will be displayed.
- Now, instead of using mainSeriesProperties.priceAxisProperties in overrides, you’ll need to use the Price Scale Api, which is in any case more convenient (Github issue #4865).
- Added the ability to create LineToolRiskRewardLong/Short by two points (Github issue #2381), so you can now specify the end date.
Fixed bugs:
- When creating a drawing, if it falls on an area without data, it is then placed at the nearest left point. If the item is created in the future, it will be displayed at the nearest point with the specified resolution (Github issue #4878).
- The featureset timezone_menu now works correctly (Github issue #4836).
- We’ve removed outdated arguments of the executeActionById method from documentation (Github issue #4828).
- Fixed onVisibleRangeChanged method argument types (Github issue #4802).
- Fixed issues with disabling Tracking OHLC and bar changes when the tracking mode is disabled (Github issue #4797).
- The console no longer displays an error related to converting saveLoadAdapter for multi-chart layouts (Github issue #4776).
- Changes to the price scale of an indicator using changePriceScale is now applied immediately (Github issue #4774).
- Fixed the supportMarketOrders flag, the order dialog now displays the price field correctly (Github issue #4765).
- Pips now update immediately when the price changes (Github issue #4761).
- Removed the Expand chart button from the library (Github issue #4744), because it’s only relevant for multi-chart layouts (several charts on the same screen).
- Removed color randomization for the first-created indicator (Github issue #4740). Now the color matches the one specified in the code.
- Fixed the display of the Moving Average at Seconds resolution intervals (Github issue #4730).
- The BUY button now does not become active until after all of the required fields are filled in correctly (Github issue #4718).
- Overrides are now correctly applied when resetting the chart settings (Github issue #4706).
- Watermark settings are now saved correctly in LocalStorage (Github issue #4681). This means that when the page is updated, the settings aren’t reset to default.
- Resolutions are now returned in a single format, 1D (Github issue #4630). Previously, resolutions were returned in different formats, which made processing more difficult.
- Overrides are now applied if the theme is not set (Github issue #4621).
- Fixed problems in working with zOrder when creating drawings (Github issue #4611).
- The callback for saving the chart is now called for any case (Github issue #4573), even if there were no changes made.
- getAllShapes now returns all drawings with the correct names (Github issues #4507 #4498).
- We’ve returned the option to Hide marks on bars to the library context menu(Github issue #4506).
- closePopupsAndDialogs now closes the new context menu of indicators and the screenshot window (Github issue #4438 #4051).
- A redirect to the TradingView site now only occurs when the logo/icon is clicked directly (Github issue #4423), and not when you hover over it and release left mouse button.
- By subscribing to a drawing_event and clicking the drawing, you can now see the ID in the console (Github issue #4302).
- Optimization of the creatShape method (Github issue #4219), now it works faster and contains no errors.
- Removed errors and warnings in the console when loading the chart (Github issue #4196).
- Fixed errors related to the old context menus and dialog windows (Github issue #4136).
- Moving the order line with your mouse wheel now correctly triggers the onMove event (Github issue #4084).
- All the added symbols are now displayed correctly in the legend (Github issue #4058).
- When you share chart screenshots on Twitter, the publication text is now inserted correctly (Github issue #3732).
- Fixed the problem with access to settings when studies_access is enabled (Github issue #3630); and
- Fixed problems with chart scrolling when the cursor pointer goes out of the browser window (Github issue #1908).
We hope this update has been helpful and you’ve enjoyed our latest releases as well as major fixes. Please feel free to send your comments, feedback, and suggestions on this update or what you’d like to see in the future. We love hearing from you and it helps us develop our next big projects.