Johnson & Johnson near support sets up a short-term upside tradCurrent Price: 207.35 (Analysis was generated on Monday Morning)
Direction: LONG
Confidence level: 48%(Data coverage is thin and conviction is moderate, but price location and trader behavior favor a cautious upside bias over the next week)
Targets
Target 1: 211.00
Target 2: 214.00
Stop Levels
S
Next report date
—
Report period
—
EPS estimate
—
Revenue estimate
—
10.44 USD
14.07 B USD
88.82 B USD
2.41 B
About Johnson & Johnson
Sector
Industry
CEO
Joaquin Duato
Website
Headquarters
New Brunswick
Founded
1887
Identifiers
3
ISIN US4781601046
Johnson & Johnson is a holding company, which engages in the research and development, manufacture and sale of products in the health care field. It operates through the following segments: Consumer Health, Pharmaceutical, and Medical Devices. The Consumer Health segment includes products used in the baby care, oral care, beauty, over-the-counter pharmaceutical, women's health, and wound care markets. The Pharmaceutical segment focuses on therapeutic areas, such as immunology, infectious diseases, neuroscience, oncology, pulmonary hypertension, and cardiovascular & metabolic diseases. The Medical Devices segment offers products used in the orthopedic, surgery, cardiovascular & neurovascular, and eye health fields. The company was founded by Robert Wood Johnson I, James Wood Johnson and Edward Mead Johnson Sr. in 1886 and is headquartered in New Brunswick, NJ.
Related stocks

JNJ in Uptrend and ripe for entryJNJ is exhibiting a clear uptrend, supported by a strong and well-defined candlestick pattern that suggests a favorable entry opportunity. The technical setup is reinforced by solid fundamentals, including growth in quarterly revenue and EPS, return on equity above 33%, return on invested capital ex

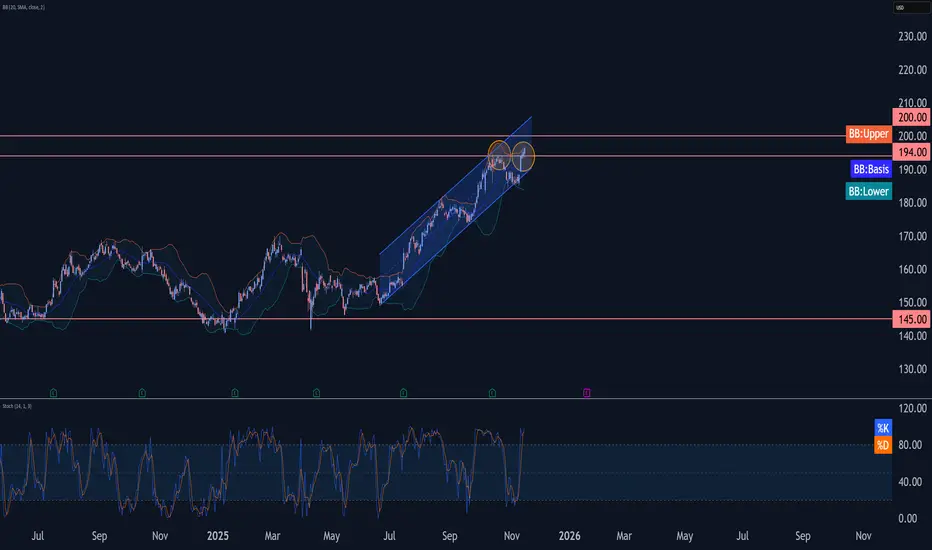
JNJ DIC 2025JNJ reclaiming 200 support;
absorption >200,
prior distribution ~180.
Upside 230-231, downside 200/192.
#JNJ #XLV #SPY

New Setup: JNJCoping with Market Cycles -- "We want to have more invested when the market rises than when it falls, and to own more of the things that rise more or fall less, and less of the others."
I'm liking JNJ because it's oversold and forming a tight wedge and price is being squeezed of the 20SMA. If the B

JNJ - Time To Lock In ProfitIs printing a shakeout that completes a double stab up slightly higher high (liquidity sweep)
And now a bearish impulsive candle is printing.
JNJ has been very strong, but I think this signals that one way or another there will be another wave down in the pipeline.
I'll be looking to pick this on

JOHNSON & JOHNSON Short-term correction ahead.Johnson & Johnson (JNJ) has been trading within a 5-month Channel Up since the June 20 Low, with the 1D MA50 (red trend-line) in firm Support.
The 4H RSI is printing a peak formation similar to all previous Higher Highs of the pattern. What followed after all those tops were pull-backs just under t

JNJ Price Target Summary (This Week)
Johnson & Johnson (JNJ) is currently trading around $204.
Analyst consensus price targets for the next 12 months are mostly in the $200–$207 range, with the highest targets around $230, but these are long-term estimates — not short-term.
A move to $228 this week is unlikely, as JNJ is a large, st

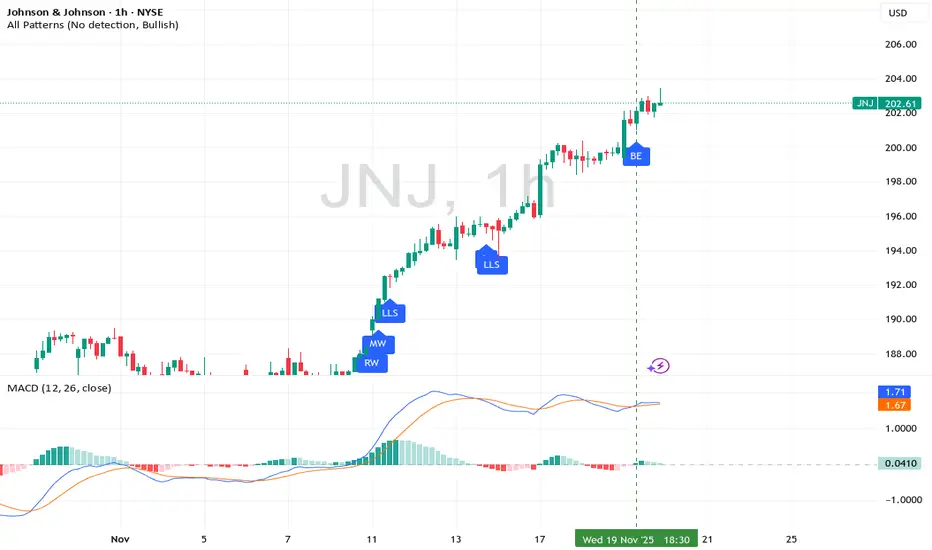
"On the 1 hour timeframe i looked for a candlestick pattern"I missed this entry on this stock NYSE:JNJ
but atleast i got to see the entry.
This entry happen,
On the 1 hour timeframe i looked for a candlestick pattern
to show me the bottom reversal
After seeing the candlestick in this case the
bullish engulfing
Showed me the bottom reversal
then Boom
t
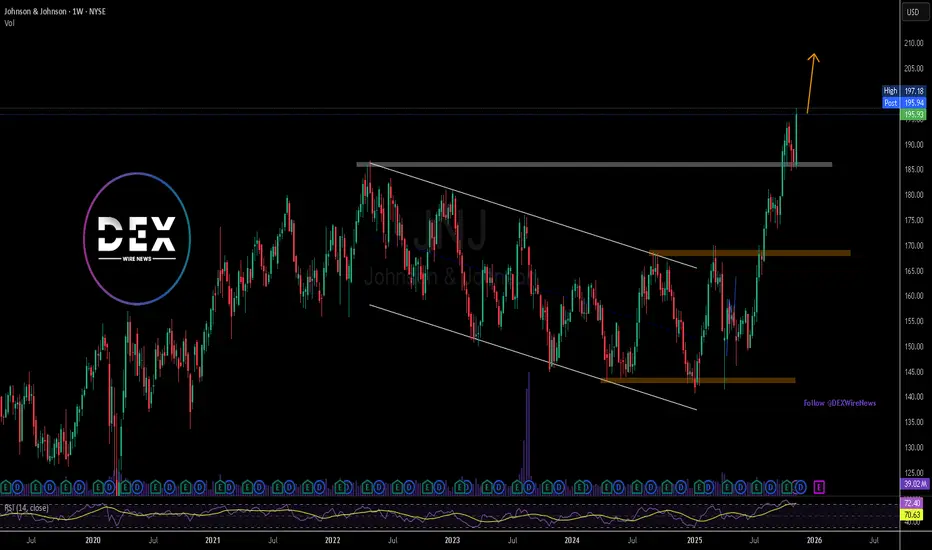
Johnson & Johnson (JNJ) Finds Support at Key Level Johnson & Johnson (JNJ) continues to demonstrate strong defensive positioning and renewed momentum as structural shifts in its business and improving sentiment fuel a breakout from a multiyear downtrend. After the successful separation of its consumer health arm, J&J is now more focused on its pharm
Johnson & Johnson Wave Analysis – 14 November 2025- Johnson & Johnson broke pivotal resistance level 194.00
- Likely to rise to resistance level 200.00
Johnson & Johnson recently broke above the pivotal resistance level 194.00, which stopped the previous impulse wave (3) in the middle of October.
The breakout of the resistance level 194.00 accel
See all ideas
Summarizing what the indicators are suggesting.
Neutral
SellBuy
Strong sellStrong buy
Strong sellSellNeutralBuyStrong buy
Neutral
SellBuy
Strong sellStrong buy
Strong sellSellNeutralBuyStrong buy
Neutral
SellBuy
Strong sellStrong buy
Strong sellSellNeutralBuyStrong buy
An aggregate view of professional's ratings.
Neutral
SellBuy
Strong sellStrong buy
Strong sellSellNeutralBuyStrong buy
Neutral
SellBuy
Strong sellStrong buy
Strong sellSellNeutralBuyStrong buy
Neutral
SellBuy
Strong sellStrong buy
Strong sellSellNeutralBuyStrong buy
Displays a symbol's price movements over previous years to identify recurring trends.
US478160CT9
Johnson & Johnson 2.45% 01-SEP-2060Yield to maturity
5.28%
Maturity date
Sep 1, 2060
US478160CM4
Johnson & Johnson 3.5% 15-JAN-2048Yield to maturity
5.26%
Maturity date
Jan 15, 2048
JNJJ
Johnson & Johnson 3.75% 03-MAR-2047Yield to maturity
5.24%
Maturity date
Mar 3, 2047
US478160BV5
Johnson & Johnson 3.7% 01-MAR-2046Yield to maturity
5.24%
Maturity date
Mar 1, 2046
US478160CS1
Johnson & Johnson 2.25% 01-SEP-2050Yield to maturity
5.23%
Maturity date
Sep 1, 2050
US478160CX0
Johnson & Johnson 5.25% 01-JUN-2054Yield to maturity
5.22%
Maturity date
Jun 1, 2054
JNJB
Johnson & Johnson 4.5% 05-DEC-2043Yield to maturity
5.08%
Maturity date
Dec 5, 2043
US478160CR3
Johnson & Johnson 2.1% 01-SEP-2040Yield to maturity
4.94%
Maturity date
Sep 1, 2040
JNJ.GX
Johnson & Johnson 4.85% 15-MAY-2041Yield to maturity
4.90%
Maturity date
May 15, 2041
JNJ.GT
Johnson & Johnson 4.5% 01-SEP-2040Yield to maturity
4.82%
Maturity date
Sep 1, 2040
US478160BY9
Johnson & Johnson 2.45% 01-MAR-2026Yield to maturity
4.75%
Maturity date
Mar 1, 2026
See all JNJ bonds
Curated watchlists where JNJ is featured.


Frequently Asked Questions
The current price of JNJ is 204.39 USD — it has decreased by −0.66% in the past 24 hours. Watch Johnson & Johnson stock price performance more closely on the chart.
Depending on the exchange, the stock ticker may vary. For instance, on NYSE exchange Johnson & Johnson stocks are traded under the ticker JNJ.
JNJ stock has fallen by −1.17% compared to the previous week, the month change is a 1.89% rise, over the last year Johnson & Johnson has showed a 40.48% increase.
We've gathered analysts' opinions on Johnson & Johnson future price: according to them, JNJ price has a max estimate of 240.00 USD and a min estimate of 180.00 USD. Watch JNJ chart and read a more detailed Johnson & Johnson stock forecast: see what analysts think of Johnson & Johnson and suggest that you do with its stocks.
JNJ stock is 1.32% volatile and has beta coefficient of 0.17. Track Johnson & Johnson stock price on the chart and check out the list of the most volatile stocks — is Johnson & Johnson there?
Today Johnson & Johnson has the market capitalization of 492.44 B, it has increased by 0.15% over the last week.
Yes, you can track Johnson & Johnson financials in yearly and quarterly reports right on TradingView.
Johnson & Johnson is going to release the next earnings report on Jan 21, 2026. Keep track of upcoming events with our Earnings Calendar.
JNJ earnings for the last quarter are 2.80 USD per share, whereas the estimation was 2.76 USD resulting in a 1.54% surprise. The estimated earnings for the next quarter are 2.49 USD per share. See more details about Johnson & Johnson earnings.
Johnson & Johnson revenue for the last quarter amounts to 23.99 B USD, despite the estimated figure of 23.76 B USD. In the next quarter, revenue is expected to reach 24.15 B USD.
JNJ net income for the last quarter is 5.15 B USD, while the quarter before that showed 5.54 B USD of net income which accounts for −6.95% change. Track more Johnson & Johnson financial stats to get the full picture.
Yes, JNJ dividends are paid quarterly. The last dividend per share was 1.30 USD. As of today, Dividend Yield (TTM)% is 2.51%. Tracking Johnson & Johnson dividends might help you take more informed decisions.
Johnson & Johnson dividend yield was 3.40% in 2024, and payout ratio reached 84.80%. The year before the numbers were 3.00% and 84.93% correspondingly. See high-dividend stocks and find more opportunities for your portfolio.
As of Jan 11, 2026, the company has 139.8 K employees. See our rating of the largest employees — is Johnson & Johnson on this list?
EBITDA measures a company's operating performance, its growth signifies an improvement in the efficiency of a company. Johnson & Johnson EBITDA is 31.15 B USD, and current EBITDA margin is 31.71%. See more stats in Johnson & Johnson financial statements.
Like other stocks, JNJ shares are traded on stock exchanges, e.g. Nasdaq, Nyse, Euronext, and the easiest way to buy them is through an online stock broker. To do this, you need to open an account and follow a broker's procedures, then start trading. You can trade Johnson & Johnson stock right from TradingView charts — choose your broker and connect to your account.
Investing in stocks requires a comprehensive research: you should carefully study all the available data, e.g. company's financials, related news, and its technical analysis. So Johnson & Johnson technincal analysis shows the sell today, and its 1 week rating is buy. Since market conditions are prone to changes, it's worth looking a bit further into the future — according to the 1 month rating Johnson & Johnson stock shows the buy signal. See more of Johnson & Johnson technicals for a more comprehensive analysis.
If you're still not sure, try looking for inspiration in our curated watchlists.
If you're still not sure, try looking for inspiration in our curated watchlists.