BTC Playbook: 90k Fades, 84k Swing Accumulation__________________________________________________________________________________
Market Overview
__________________________________________________________________________________
Bitcoin is consolidating under 90 000 after rebounding from 87 688, with a corrective tone where the 12H downtrend still caps momentum. The near-term battle is defined by 89 429 support and 90 000–90 600 supply overhead as macro keeps volatility elevated.
Momentum: Bearish tilt within a corrective range; rallies fade below 90 200–90 600 while buyers defend 89 429 and 87 688.
Key levels:
- Resistances (4H–1D): 89 950–90 200 (multi‑TF supply), 90 600 (HTF shelf), 93 547–94 555 (pivot‑high band).
- Supports (2H–1D): 89 429 (4H pivot‑low), 87 688 (pivot‑low), 83 800–84 200 (Cluster A with D pivot‑low inside).
Volumes: Normal on LTF and HTF; no extreme footprint to negate the 12H down bias.
Multi-timeframe signals: 12H Down and 1W Down dominate a tentative 1D Up; structure remains capped beneath 90 600 despite the daily bounce.
Harvest zones: 84 100 (Cluster A) / 79 800–80 300 (Cluster B) — preferred dip‑buy areas for inverse pyramiding when a clear reversal prints.
Risk On / Risk Off Indicator context: NEUTRE VENTE; confirms a cautious stance and aligns with fading bounces into HTF resistance.
__________________________________________________________________________________
Trading Playbook
__________________________________________________________________________________
With the dominant trend corrective and risk‑off, play defense: fade into resistance, accumulate only on confirmed floor reversals.
Global bias: NEUTRAL SELL while price is capped below 90 600; invalidation for bears on sustained closes above 90 600.
Opportunities:
- Buy the dip: 1D/2H reversal at 84 100 (Cluster A) with confirmation; first targets 89 429 then 89 950–90 200.
- Breakout long: Reclaim and hold 90 200 on 2H–4H, looking for 90 600 and 93 547–94 555.
- Tactical sell: Fade 89 950–90 200 rejection; add on a loss/retest‑fail of 89 429 toward 87 700.
Risk zones / invalidations:
- Break below 83 500 would invalidate the 84k long thesis (Cluster A failure).
- Sustained close above 90 600 would invalidate the fade‑the‑rip approach.
Macro catalysts (Twitter, Perplexity, news):
- Fed “hawkish cut” and a heavy week (NFP/CPI/PCE/quad‑witch) keep a risk‑off skew; event spikes can force range breaks.
- JPM tokenized money‑market fund on Ethereum — supportive for institutional adoption but not a near‑term driver.
- USD/JPY volatility and China softness argue for selective risk‑taking.
Harvest Plan (Inverse Pyramid):
- Palier 1 (12.5%): 84 100 (Cluster A) + reversal ≥2H → entry
- Palier 2 (+12.5%): 79 100–80 700 (-4/-6% below Palier 1) (Cluster B included) → reinforcement
- TP: 50% at +12–18% from PMP → recycle cash
- Runner: hold if break & hold first R HTF (89 950–90 200)
- Invalidation: < HTF Pivot Low 83 800 or 96h no momentum
- Hedge (1x): Short first R HTF on rejection + bearish trend → neutralize below R
__________________________________________________________________________________
Multi-Timeframe Insights
__________________________________________________________________________________
Across TFs, lower timeframes trend down while the daily shows a reflex bounce; weekly context stays corrective.
12H/6H/4H/2H/1H/30m/15m: Downtrend pressures persist beneath 89 950–90 200 and 90 600; repeated rejections favor tactical fades, with 89 429 as the intraday line in the sand.
1D: Green bar but still boxed by 90 200–90 600; a firm reclaim/hold opens room toward 93 547–94 555, else the path of least resistance remains sideways‑to‑down.
1W: Corrective and below HTF supply; until 90 600+ is reclaimed on a closing basis, risk skews to mean‑reversion into lower demand clusters.
__________________________________________________________________________________
Macro & On-Chain Drivers
__________________________________________________________________________________
Macro is mixed-to‑cautious and keeps the tape liquidity‑sensitive; on‑chain/derivatives lean defensive but can flip quickly on a clean reclaim.
Macro events: A “hawkish cut” backdrop and a packed US data slate (NFP/CPI/PCE/quad‑witch) raise event risk; USD/JPY volatility and China’s softness constrain risk appetite even as institutional on‑chain pilots (e.g., JPM) provide a slow‑burn positive.
External Macro Analysis: The Risk On / Risk Off Indicator reads VENTE with credit stress (HYG VENTE) and weak speculative appetite (ARKK VENTE); partial conflicts in semis/small caps imply mid‑cycle churn. This supports the NEUTRAL SELL technical bias.
Bitcoin analysis: After large liquidations, options structure and IV compression drive intraday; modest fund/ETF inflows are supportive but not decisive, while a reclaim could spark upside convexity.
On-chain data: Demand softer with short‑term realized losses; OI lighter, funding neutral — consistent with a reactive, headline‑driven regime.
Expected impact: Macro/on‑chain favor reactive trading — fade into 90k supply unless 90 200→90 600 is reclaimed and held; dips into 84k/80k improve risk‑reward for swing accumulation.
__________________________________________________________________________________
Key Takeaways
__________________________________________________________________________________
BTC sits in a corrective range under HTF supply with a risk‑off lean and normal volumes.
The trend is bearish‑to‑neutral while capped below 90 600. The highest‑quality setup is a confirmed reversal at 84 100 (Cluster A), with deeper adds near 80k (Cluster B) if tested. Macro remains catalyst‑heavy, so respect event risk and require confirmation. Stay patient, let the levels do the work, and harvest volatility with discipline.
Fed

EUR/USD Daily Outlook: Bullish Structure | COT & SeasonalityOn the daily chart, EUR/USD has developed a clean recovery structure after the November low, characterized by a well-defined sequence of higher lows and price holding above the short-to-medium term ascending trendline. The 1.1650–1.1600 area represents a key dynamic and structural demand zone, already defended multiple times, while the impulsive breakout toward 1.1730 confirmed renewed institutional interest on the long side. Price is now trading just below a relevant daily supply zone between 1.1750 and 1.1820, aligned with prior highs and a distribution area visible on higher timeframes. As long as this zone is not cleared with a strong daily close, the most likely scenario is a corrective pause or a controlled pullback toward 1.1680–1.1650 before any renewed attempt at the highs. From a COT perspective, the backdrop remains constructive for the euro: non-commercials are still net long EUR FX, with a reduction in short exposure and a positioning structure consistent with accumulation rather than distribution. At the same time, the US Dollar Index shows non-commercials still heavily net short, suggesting that large players are not aggressively defending the dollar and that pullbacks on EUR/USD are more likely continuation opportunities than structural reversals. From a seasonality standpoint, December has historically shown a moderately positive bias for EUR/USD, particularly in the second half of the month, favoring gradual upside moves rather than sharp directional spikes—consistent with a typical year-end environment of compressed volatility but positive directional bias. In summary, the broader bias remains bullish, though not an immediate breakout scenario: the highest-probability path favors technical pullbacks toward the 1.1650–1.1680 area to build trend-aligned long exposure, while only a confirmed daily break above 1.1820 would open room toward 1.1900. Structural invalidation sits below 1.1550, which currently remains a low-probability scenario.

Fed Just Opened the Door — USDJPY Could Bleed Hard!!Hey Traders, in today’s session we are monitoring USDJPY for a selling opportunity around the 156.300 zone. The pair continues to trade within a broader downtrend, and price is now retracing toward a key trend + S/R confluence at 156.300 — an area that has consistently acted as a supply zone for sellers.
Technical Structure
USDJPY remains in a bearish market structure (lower highs / lower lows).
Current pullback is approaching the 156.300 correction zone, where downside continuation becomes highly probable.
Dollar Macro Backdrop: Perfect Storm for USD Weakness
On the other side, DXY broke below its uptrend and is now pulling back toward the 98.800 retracement zone, confirming a broader shift in momentum.
The fundamentals are even more compelling:
1. The Fed did cut yesterday — 25bps.
This reinforces a clear dovish turn, and historically the USD underperforms aggressively in the weeks following the first cut of a new cycle.
2. The Fed's balance sheet is expanding again.
An expanding balance sheet = USD bearish liquidity environment.
3. The January FOMC is currently NOT priced for a cut — and that’s the opportunity.
The market is underpricing the risk of back-to-back cuts.
Now labor market data becomes the main catalyst.
And the reality is:
If we get any sign of further labor market weakness — which is increasingly likely — the market will start pricing in a January cut very fast.
And that leaves MUCH more room for USD weakness across the board.
Trade Focus
Monitoring price reaction at 156.300 for a bearish continuation setup.
If DXY resumes weakness out of 98.800 and labor data disappoints, USDJPY could accelerate aggressively to the downside.
Trade safe,
Joe.

EURUSD breaks higher: Fed-ECB path to drive 3rd wave to 1.19?EURUSD is trading above 1.17 on the 4-hour chart after the dollar fell to a 2-month low following Wednesday's Fed rate cut. With a potential running triangle breakout in play and a dovish Fed facing a stable ECB, the pair is eyeing the 2025 high at 1.1920 and potentially new peaks into 2026.
In this video, we break down why Powell's dovish tone and a deeply divided Fed are narrowing the rate differential with the ECB, which might upgrade growth and proceed with no cuts in 2026. Then, we map out the wave structure: a potential 3rd wave impulse targeting 1.18–1.19, with buy-the-dip zones at 1.17 and 1.1650, and larger projections toward 1.2020–1.2220 from a cup-and-handle pattern.
Key drivers
Fed cut and Powell dovish: The Fed cut rates on Wednesday, where Powell emphasised a "wait-and-see" mode, pretty much ruling out hikes in 2026; markets now price two more cuts despite the official dot plot projecting only one.
Deeply divided Fed: The December dot plot showed four members see no cuts in 2026, four see one, four see two, and three expect rates below 3% by year-end 2026, while three actually wanted to hike — No consensus.
ECB stability and growth upgrade: ECB President Lagarde said the eurozone economy shows "remarkable strength" and the ECB may upgrade growth forecasts at the December 18th meeting, with policy in a "good position" (i.e., no cuts).
Rate differential narrowing: The Fed is at 3.50–3.75% and cutting, the ECB is at 2.00% and on hold. Markets now price only a 45% chance of an ECB cut by September 2026, narrowing the spread in favour of the euro.
Technical structure : EURUSD has broken out of a running triangle with a breakout level around 1.1580–1.1600. The current leg appears to be a third-wave impulse targeting 1.18–1.19, with a larger cup-and-handle projection pointing to 1.2020–1.2220.
Trade plan : Buy pullbacks into 1.17 (50% Fibonacci retracement) or 1.1650 (deeper support) with a stop below 1.1580, targeting 1.18, 1.19, and potentially 1.20+; invalidation below 1.1580 would suggest a corrective structure instead.
Trading the EURUSD breakout? Share your entry levels and wave counts in the comments and follow for more Fed-ECB divergence and technical trade setups.
This content is not directed to residents of the EU or UK. Any opinions, news, research, analyses, prices or other information contained on this website is provided as general market commentary and does not constitute investment advice. ThinkMarkets will not accept liability for any loss or damage including, without limitation, to any loss of profit which may arise directly or indirectly from use of or reliance on such information.

USDCAD: Massive Pullback Incoming or Final Trap?USDCAD is reacting from a major demand area at 1.3720–1.3770, which aligns with:
• the lower boundary of the yearly ascending channel;
• an institutional zone that has been defended multiple times (Q3 and early Q4);
• a daily RSI showing relative oversold conditions;
• a liquidity cluster below the October lows that has now been swept.
The rebound is technically justified, but its sustainability will largely depend on CAD structure (strong in the latest COT data) and on December seasonality, which is historically unfavorable for USDCAD.
The base case is a bullish pullback toward 1.3890–1.3930, followed by renewed downside pressure if macro sentiment continues to support the CAD.
The daily chart highlights:
• Primary trend: still bullish, but undergoing a deep corrective phase.
• Midline channel break → bearish acceleration into the demand area.
• Current price action: sharp rejection with increased relative volume at the lows (typical structural “spring”).
• The 1.3880–1.3930 zone is the first major supply: confluence between previous structure, the last breakdown area, and a psychological pre-pivot region.
Key technical levels:
Support: 1.3720 (demand), 1.3660 (extreme), 1.3570 (macro support).
Resistance: 1.3880, 1.3930, 1.4050.
Technical outlook:
As long as the price remains above 1.3720, the market favors a corrective rebound.
Below 1.3660, price opens the path toward 1.3570.
Seasonality – December
December is historically a bearish month for USDCAD, with negative readings across 20-, 15-, 10-, and 5-year datasets:
• 20-year avg: -0.0014
• 10-year avg: -0.0091
• 5-year avg: -0.0195 (significantly negative)
• Only the 2-year pattern shows a more neutral/volatile structure.
Seasonality takeaway: bearish bias, suggesting the current rebound is more likely a technical pullback rather than the start of a new trend.
COT Analysis (CAD + USD Index)
CAD – COT data (Nov 4, 2025)
• Non-Commercials increased CAD shorts aggressively (+8,288) while reducing longs (-1,180).
→ Indicates speculative CAD weakness in recent weeks.
• Commercials significantly increased CAD longs (+13,164).
→ Typical of institutions accumulating CAD at discounted prices.
Interpretation:
CAD displays a clear divergence: speculators are bearish, while commercials are increasingly bullish. This suggests a potential macro turning point where institutions anticipate medium-term CAD strength.
USD Index – COT data (Nov 4, 2025)
• Non-Commercials increased both longs (+6,038) and shorts (+5,474).
→ Polarized market.
• Commercials increased longs (+1,188).
→ Marginal support for the USD.
Macro COT conclusion:
• CAD: institutional buying pressure.
• USD: indecision and polarization.
Overall COT bias → medium-term bearish USDCAD, although consistent with a short-term corrective bounce.
Retail Sentiment
• Short: 37%
• Long: 63%
Retail positioning is clearly long.
Contrarian interpretation: downside risk remains elevated after the pullback.
Macro Context
• Oil remains volatile but structurally firm → historically CAD-supportive.
• The Fed maintains a cautious stance with potential rate cuts in 2026 → structural pressure on the USD.
• The BoC, although dovish, may delay cuts relative to the Fed → supportive for CAD in the medium term.
Probability 60% – Base Scenario
Pullback toward 1.3880–1.3930 before renewed bearish pressure.
Confirmations:
• Daily close above 1.3820
• Bullish H4 structural shift
Target: 1.3890
Extension: 1.3930
Failure level: below 1.3720.
Alternative Bearish Scenario – Probability 40%
A direct break below 1.3720 → continuation toward 1.3660 and then 1.3570 (macro level).
Confirmations:
• Pullback failure / squeeze
• H4 bullish breakout in oil
• Daily rejection on the USD Index.
USDCAD is currently rebounding within a broader corrective structure.
COT and seasonality do not support a strong bullish reversal, but short-term price action allows room for a move toward 1.39, where institutional interest will likely re-emerge to resume the broader macro bearish narrative.
Barring macro shocks, the preferred structure remains:
corrective rally → short setup at 1.3880–1.3930 → target 1.3720 and potentially 1.3660.

BTC Neutral-Sell: Fade 93-94k, Loot 84k ClusterMarket Overview
__________________________________________________________________________________
Price is hovering in mid-range beneath a sticky 93–94k daily supply, with rallies repeatedly faded and buyers defending the 89.6k/87.8k band. Macro is mildly supportive on dips, but higher‑timeframe momentum hasn’t flipped yet.
Momentum: Bearish-to-range tilt under 93–94k as repeated supply rejections cap bounces.
Key levels:
- Resistances (HTF): 93,100–94,200 (1D supply), 94,800 (4H), 98,330 (W).
- Supports (HTF): 89,600 (240m PL), 87,800 (720m PL), 83,900–84,400 (1D/1H cluster with D PL).
Volumes: Normal on HTF; moderate intraday acting as an amplifier around key retests.
Multi-timeframe signals: 12H/6H/4H trend leaning down while 1D can print countertrend up phases; overall mixed, with rallies best treated as tactical until 93–94k is reclaimed.
Harvest zones: 84,200 (Cluster A) / 76,000–76,800 (Cluster B) — ideal dip-buying zones for inverse pyramiding once reversal prints.
Risk On / Risk Off Indicator context: NEUTRE VENTE — mild risk-off backdrop that confirms the fading-rally environment.
__________________________________________________________________________________
Trading Playbook
__________________________________________________________________________________
The dominant structure is a range with a bearish skew under HTF supply; trade tactically, fade weak rallies, and prepare buy plans at high-confluence floors.
Global bias: Neutral Sell below 93–94k; key invalidation for shorts is a decisive daily close above 94,214.
Opportunities:
- Tactical sell: Fade 93,100–94,200 rejections with weak retests and capped momentum.
- Breakdown sell: Short a 4H/6H close and failed retest below 89,600 targeting 87,800 then 84,400–83,900.
- Dip-buy: Only on clean ≥2H reversal at 84,000–84,400 (Cluster A) or a strong signal at 87,400–87,800 for tactical bounces.
Risk zones / invalidations:
- Break and hold above 94,214 would invalidate the fade-supply short idea and open 95k–98,330.
- Sustained close below 84,000 would invalidate the high-confluence long plan at Cluster A.
Macro catalysts (Twitter, Perplexity, news):
- Fed delivered a hawkish cut and started T‑bill purchases (~$40B/m) — liquidity positive but guidance firm.
- US spot BTC ETFs show net inflows — cushions dips, not a trigger by itself.
- China signaling incremental easing — supportive for risk if it persists.
Harvest Plan (Inverse Pyramid):
- Palier 1 (12.5%): 84,200 (Cluster A) + reversal ≥2H → entry
- Palier 2 (+12.5%): 80,800–79,100 (-4/-6% below Palier 1)
- TP: 50% at +12–18% from PMP → recycle cash
- Runner: hold if break & hold first R HTF (93,100–94,200)
- Invalidation: < HTF Pivot Low 83,900 or 96h no momentum
- Hedge (1x): Short first R HTF on rejection + bearish trend → neutralize below R
__________________________________________________________________________________
Multi-Timeframe Insights
__________________________________________________________________________________
Across TFs, price is coiling under daily supply with lower highs; countertrend pops exist but remain capped unless the 1D lid breaks.
12H/6H/4H/2H/1H: Drift down to neutral-sell; repeated failures into 93–94k and defense at 89,600 then 87,800. Best quality demand sits lower at 84,000–84,400; deeper capitulation interest at 76,000–76,800.
1D: Can print up phases, but only reclaiming and holding above 94,214 would turn supply into support and shift targets toward 95k and 98,330.
Confluences: 84,000–84,400 aligns with the Daily Pivot Low 83,871; overhead 93–94k is multi‑test supply; volumes normal HTF with moderate intraday spikes at tests.
__________________________________________________________________________________
Macro & On-Chain Drivers
__________________________________________________________________________________
Macro liquidity is incrementally supportive (Fed cut + T-bill buys; China easing tone), but the risk regime reads cautious and caps impulsive upside.
Macro events: Fed’s hawkish cut with bill purchases adds modest liquidity; US data mixed (claims higher, trade deficit narrower); China telegraphs ongoing support — net effect: dips cushioned, euphoria capped.
External Macro Analysis: The Risk On / Risk Off Indicator leads with a bearish read, late‑cycle tone, and credit stress flags; this contradicts a clean bullish impulse and supports a Neutral Sell technical bias until conditions flip.
Bitcoin analysis: ETF inflows are constructive and overhead liquidity is thin, but 93–94k remains the gating level; 90k acts as a liquidity magnet; 95k is a higher‑TF “beacon” once 93.2k is reclaimed.
On-chain data: Demand softened, OI lighter, funding neutral; IV compressed — favors mean‑reversion and disciplined harvesting over momentum chasing.
Expected impact: Macro/flows provide a floor on sharp dips, yet risk regime and HTF supply argue for patience — fade weak rallies and harvest high‑confluence floors only on confirmation.
__________________________________________________________________________________
Key Takeaways
__________________________________________________________________________________
BTC remains range‑bound with a bearish skew under 93–94k while macro liquidity offers limited cushioning.
- Trend: Neutral/bearish until 94,214 is reclaimed; expect probes lower inside the range.
- Setup: Fade 93–94k failures; prepare a disciplined inverse‑pyramid buy at 84,000–84,400 with ≥2H confirmation.
- Macro: Fed T‑bill buys and ETF inflows cushion dips, but the risk regime is still Neutral Sell.
Stay tactical like a seasoned dungeon runner — conserve stamina in the grind and strike on high‑confluence reversals.
Title ideas
- BTC Neutral-Sell: Fade 93–94k, Loot 84k Cluster
- Bitcoin Range Grind: 94k Cap, 84k Harvest Plan
- BTC Playbook: Tactical Fades Now, 84k Buy Later

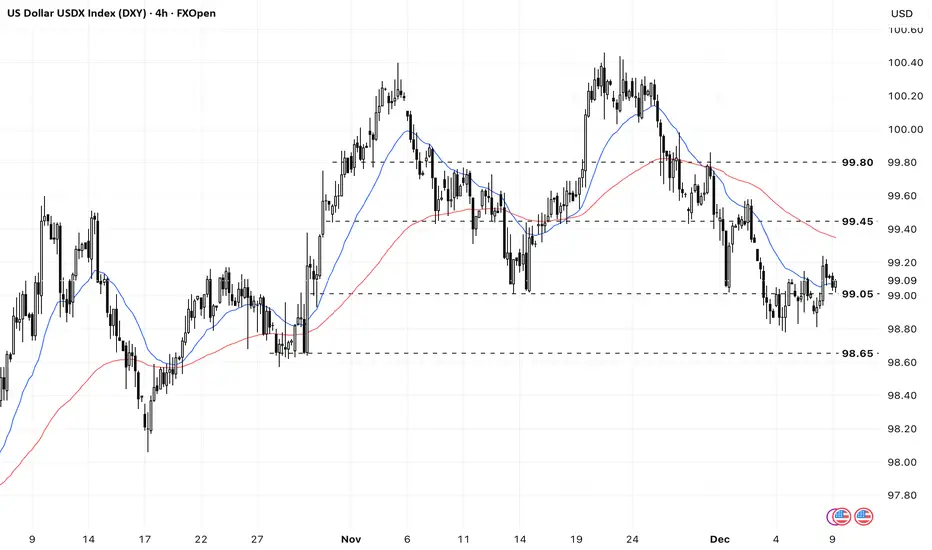
DXY rebounded slightly due to the expectation more hawkish FedThe US dollar rebounded after the recent weakness due to increased odds of a rate hike at tomorrow's meeting.
Meanwhile, today's US October JOLTS data may offer further clarity on the labor market following the delayed October NFP. Markets are anticipating the JOTLS to fall to 7.2 million, which could contract the job openings per unemployment rate under the 1.0 level and add further concern about the labor market, despite a low unemployment rate.
DXY breached 99.00 and EMA21. The index remains between the bearish EMAs, indicating potential consolidation.
If DXY breaks below 99.00 again, the index could retreat toward the next support at 98.65.
Conversely, if the DXY moves above the EMA78, the index may advance toward the next resistance level at 99.45.
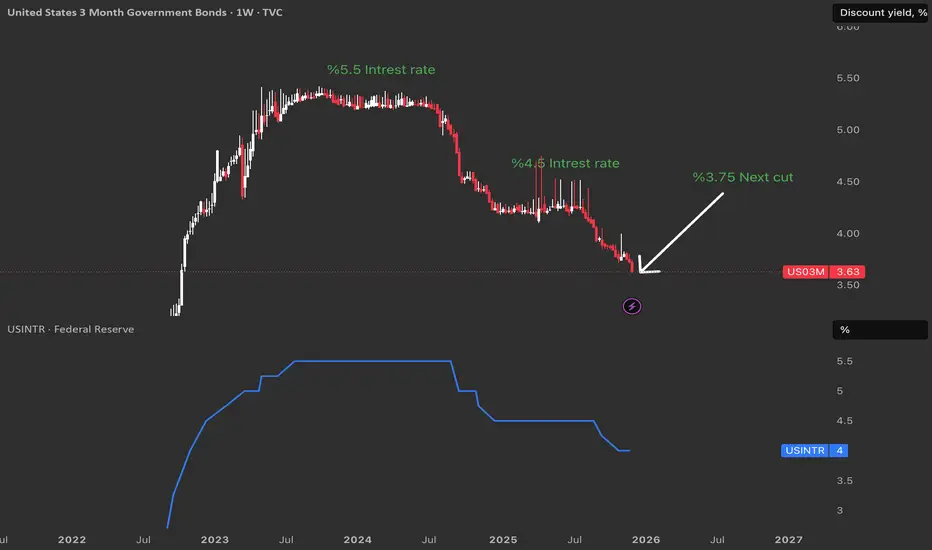
How US03M Are Front‑Running the Next Fed Cut The link between bonds and rates
The US03M tracks the yield investors demand to lend to the U.S. government for three months, and this yield moves closely with the Federal Funds Rate set by the Fed.
When the Fed hikes, short‑term Treasury yields usually rise toward the new policy rate, and when markets expect cuts, these same yields start dropping before the official decision.
Why US03M front‑runs the Fed 🕒
US03M is a pure play on near‑term monetary policy, so traders price in where they think the Fed Funds Rate will be over the next quarter, not where it is today.
As a result, sharp declines in US03M while the official Fed rate is still flat often signal that fixed‑income markets are betting on upcoming rate cuts.
Why a 25 bps cut is likely 🎯
With US03M hovering roughly a quarter of a percent under the current effective policy rate area shown on the chart, the bond market is effectively voting for at least a 25 bps reduction at the next meaningful decision.
If the Fed cuts by 25 bps, US03M is already priced for that move, so the bigger reaction will come only if the Fed surprises with either a larger cut or no cut at all, giving traders a clear benchmark for risk positioning.
GBP/USD: Institutions Accumulate, USD Weakens – Key PullbackMacro Context and USD Index (DXY) – Neutral/Weak USD Bias
The COT report on the Dollar Index shows a configuration that suggests sustained bearish pressure on the USD:
Non-commercial traders are adding both long positions (+6,038) and short positions (+5,474), but the overall structure remains clearly short-dominant (32,207 shorts vs. 16,645 longs).
Commercials significantly increase their USD long exposure (+1,188), though their activity typically reflects hedging rather than a directional view.
Open interest rises sharply, signaling renewed institutional participation on the sell side of USD.
In summary, net pressure remains bearish on the USD, a condition that favors upside continuation in GBP/USD.
COT on the British Pound (GBP) – Clear Improvement in Institutional Sentiment
The GBP report is far more revealing:
Non-commercials aggressively cut long exposure (–19,354) while sharply increasing shorts (+15,403).
However, commercials substantially increase their GBP long exposure (+40,231) while reducing short exposure (+504).
This dynamic is typical of market turning points:
When non-commercials rapidly reduce longs and add shorts, it often represents short-term emotional selling.
Commercials, meanwhile, accumulate heavily, suggesting that current price levels are perceived as attractive value zones.
Interpretation:
GBP is likely entering a structural accumulation phase.
Combined with USD weakness → this supports a moderately bullish medium-term bias on GBP/USD.
Retail Sentiment – Contrarian Confirmation of Potential Upside
Retail short: 56%
Retail long: 44%
Retail positioning is predominantly short → classic contrarian signal → reinforces a bullish scenario for GBP/USD.
Seasonality – December Historically Bullish
December typically shows positive seasonal behavior, especially across the 5-year and 2-year curves.
The 10-year curve is slightly bullish as well; only the 20-year curve is mostly neutral.
Interpretation: December tends to favor accumulation and upward extensions, particularly in the second half of the month.
Price Action & Key Levels
Price recently bounced from the ascending channel highlighted in green.
A strong bullish impulse candle broke previous micro-structure, and the pair is now undergoing a technical pullback.
The blue zone (1.3160–1.3230) represents the major daily demand area that initiated the latest rally.
Primary Scenario (Bullish – Higher Probability):
A retracement toward 1.3240–1.3260 is expected, aligning with a retest of the ascending trendline.
From this region, a bullish continuation toward:
• 1.3420 (first supply zone)
• 1.3550 (intermediate liquidity pocket)
• 1.3600–1.3650 (macro supply and seasonal target)
The daily RSI remains neutral, with no signs of exhaustion, leaving ample room for further upside.

Waiting for an Impulse Ahead of the Fed Decision #USDJPYUSDJPY remains in a steady bullish structure and is holding near local highs amid a strong US dollar and the continued accommodative policy of the Bank of Japan. At the same time, the market is entering a waiting phase ahead of the key event of the week — the Federal Reserve decision, which is expected to sharply increase volatility.
The market is pricing in a 0.25% rate cut by the Fed, but the decisive factor for further direction will be the tone of the press conference. Comments on inflation, economic conditions, and the future path of monetary policy will shape the medium-term outlook.
Technically, the pair is consolidating below the resistance zone near recent highs, while maintaining a bullish structure above key moving averages. There is no sign of aggressive selling pressure at this stage.
Key logic
Before the Fed decision — a high probability of range-bound trading and false moves.
After the decision — a breakout from consolidation and the formation of a directional impulse.
The main focus is on the reaction at the upper boundary of the range and volume behavior
Scenarios
Bullish: breakout above local resistance and impulsive continuation higher after Fed signals.
Corrective: pullback toward the nearest support area while preserving the overall bullish structure.
Bearish scenario is only possible in case of a sharp shift in Fed rhetoric and a breakdown of the current structure.
USDJPY is at a decision point, and today’s Fed meeting will be the key trigger for the next directional move in the pair.

Stop Loss Killers Completed – Bullish Expansion Ahead?After three consecutive Stop-Loss Killers (SLK1, SLK2, SLK3), the market appears to have flushed out remaining buyers and collected liquidity below key lows. This structure often signals the end of a manipulation phase and the beginning of a potential bullish expansion.
With the FOMC rate-cut announcement expected this evening, the market now has both structural and fundamental conditions for an upside move. If the sweep was indeed the final liquidity grab, a rally toward the upper target zone may follow next.

BTC vs. The Fed: The "Neutral Coil" Before the ExplosionDescription: Today represents the collision of a massive macro catalyst (FOMC) and a technically "coiling" market. As professional traders, we do not gamble on the outcome of the speech; we identify the breakout levels that the speech will trigger.
1. The Macro Setup: Priced to Perfection According to the CME FedWatch Tool, the market has priced in an 89.6% probability of a rate cut.
The Trap: When certainty is this high, the "upside" of the news is often limited (priced in), while the downside risk of a "hawkish surprise" is violent. The market is leaning one way, which makes the reaction unpredictable.
2. The Technical Reality: Dead Neutral Replacing complex algorithms with standard, time-tested indicators reveals a market that is holding its breath.
RSI (14): Currently sitting at 48.45. This is effectively 50—dead neutral. Bulls and bears are in perfect equilibrium waiting for a trigger.
Bollinger Bands: Price is chopping directly on the 20 SMA (Middle Band). We are neither overbought nor oversold. We are in "fair value" territory, which is typically where trends go to pause before a volatility expansion.
ADX (Trend Strength): The ADX has dropped to 25, signaling that the previous directional trend has exhausted itself.
3. The Levels to Watch (The Trade) Because the technicals are neutral, we must wait for price to leave this "value zone" to confirm the winner.
Bullish Confirmation: We need a decisive Daily Close above the 0.382 Fib level ($97,600) and the upper resistance knot. Reclaiming this level opens the door to test the $100k psychological barrier.
Bearish Invalidation: If the Fed disappoints, watch the recent swing lows around $84,800. A loss of this support invalidates the recovery and exposes the lower Bollinger Band.
Summary: Do not front-run the Fed. The indicators (RSI 48, ADX 25) are telling us there is no trend right now. Wait for the volatility to break the range, then follow the momentum.
DISCLAIMER: Trading involves significant risk. This analysis is for educational purposes only and is not financial advice. Do your own due diligence.

Gold (XAU) — Short-Term Bearish Pressure Before Bullish ContinuaGold is showing signs of short-term downside pressure. I expect an initial decline into the 4100–4130 zone. However, if the Federal Reserve does not deliver the expected rate cuts and maintains higher levels for longer, there is a real possibility of an extended drop toward the 3940–4000 area before the market stabilizes.
Despite these short-term risks, the medium- and long-term outlook remains bullish. The current structure still reflects a healthy corrective move within a larger upward trend. Once liquidity is cleared below, I expect strong bullish continuation toward the 4600–4700 zone.
Higher-timeframe momentum still favors buyers, and the overall price behavior aligns more with institutional accumulation than with true trend exhaustion.
Drop your asset in the comments + hit the like button and I’ll prepare a custom analysis for you.
Stay patient and trade with precision.

Bitcoin Range Play: 94.2k Gate or 84k MagnetMarket Overview
__________________________________________________________________________________
Price is compressing beneath a dense 92,285–94,213 resistance band into the FOMC, with higher timeframes still tilted down. The tape shows a corrective range: rallies into resistance are being faded while demand sits much lower.
Momentum: Bearish-to-range bias under 94,213 as HTF trend filters (12H/1D) point Down; bounces are tactical and short-lived without confirmation.
Key levels:
- Resistances (HTF): 92,285–94,213 (240–1D confluence), 98,330 (Weekly).
- Supports (HTF): 90,900–91,100 (2H shelf), 89,550 (240 PL), 83,900–84,400 (1D/1H ISPD cluster + D Pivot Low).
Volumes: Normal to moderate overall; noteworthy 1H rejection on very high volume above ~93.5k (bearish context while below resistance).
Multi-timeframe signals: 1D/12H/6H Down, 4H Up tactical, 2H/1H/30m/15m Up tactical; HTF downtrend plus overhead resistance argues for patience or fades until a clean reclaim.
Harvest zones: 77,100 (Cluster A) / 83,700–84,400 (Cluster B) — ideal dip-buy areas for inverse pyramiding, with Cluster B aligned to the Daily Pivot Low.
Risk On / Risk Off Indicator context: NEUTRE VENTE — risk-off regime, confirming the cautious momentum beneath HTF resistance.
Trading Playbook
__________________________________________________________________________________
With HTF down-filters active, adopt a neutral-sell stance below 94,213 and let the FOMC be your catalyst filter.
Global bias: Neutral-sell below 94,213; key invalidation for shorts on a daily close > 94,600 with persistence.
Opportunities:
- Tactical sell: Fade 92,285–94,213 if rejection/weak breadth; target 91.9k/89.55k.
- Breakout buy: Daily close and hold > 94,213 (≥2–3 bars on execution TF) opens 98.33k.
- Dip-buy: 83,700–84,400 cluster only on ≥2H reversal; deeper 77.1k on capitulation with strong signal.
Risk zones / invalidations:
- Break below 89,550 unlocks the magnet toward ~84k cluster; longs invalidated there if no reversal.
- Daily close > 94,600 invalidates the fade and favors 98.33k follow-through.
Macro catalysts (Twitter, Perplexity, news):
- FOMC decision/presser today; tone likely dictates whether 94,213 breaks or 89.55k/84k retests.
- US bank access headlines (OCC letter, PNC spot BTC) are structurally supportive but not overriding HTF resistance yet.
- Hard-asset beta bid (silver > $60) hints at medium-term constructive backdrop if policy is supportive.
Harvest Plan (Inverse Pyramid):
- Palier 1 (12.5%): 77,100 (Cluster A) + reversal ≥2H → entry
- Palier 2 (+12.5%): 74,000–72,500 (-4/-6% below Palier 1) → reinforcement
- TP: 50% at +12–18% from PMP → recycle cash
- Runner: hold if break & hold first R HTF (94,213)
- Invalidation: < HTF Pivot Low or 96h no momentum (D Pivot Low 83,900)
- Hedge (1x): Short first R HTF on rejection + bearish trend → neutralize below R (94,213)
Multi-Timeframe Insights
__________________________________________________________________________________
Timeframes are split: HTF downtrend governs, while lower TFs attempt tactical bounces into stacked resistance.
1D/12H/6H: Downtrend intact beneath 92,285–94,213; failure wicks above ~93.5–94.2k reinforce sell-the-rip; downside magnets remain 89,550 then the ~84k cluster.
4H: Tactical Up but counter to HTF; range structure with supply at 93.5–94.2k and support ~89.6k offers fade entries unless 94,213 is reclaimed decisively.
2H/1H/30m/15m: Up tactical momentum stalls below 94,213; watch 92,285 retests for lower highs. A clean 2H reversal at 89,550 can bounce to 92,285; loss of 89,550 exposes ~84k.
Major confluence: 83,700–84,400 aligns ISPD (1D/1H) with the D Pivot Low — the highest quality demand if tested; 92,285–94,213 is the key supply wall to beat.
Macro & On-Chain Drivers
__________________________________________________________________________________
Into the FOMC, positioning is cautious; structural headlines are improving but flows are not yet decisive.
Macro events: The Fed decision and guidance dominate; a dovish tilt could force a squeeze through 94,213 toward 98.33k, while a hawkish tone favors renewed tests of 89,550/84k. Silver’s surge above $60 underscores hard-asset demand if policy eases.
External Macro Analysis: Broader risk appetite is mixed; elevated implied vol and event risk align with a wait-and-see stance — consistent with our neutral-sell bias until 94,213 is reclaimed.
Bitcoin analysis: Price pinned under 93–97k resistance; several analysts flag limited resistance to ~106k on a confirmed break above ~97k; HTF bull structure intact only while mid-60ks stay unbroken on the really big picture.
On-chain data: ETF net flows modest (7d ~ flat); spot CVD softened; OI lighter; structure fragile unless HTF levels are reclaimed.
Expected impact: Macro/on-chain currently cap upside under resistance; a dovish FOMC could flip the tape to breakout mode, otherwise the path of least resistance is range-backfill into 89.55k and possibly the ~84k cluster.
Key Takeaways
__________________________________________________________________________________
BTC sits in a corrective range beneath 94,213 with HTF down-filters active and event risk front and center.
- Trend: Bearish-to-range while below 94,213; respect the 92,285–94,213 supply until a decisive reclaim.
- Most relevant setup: Fade rejections at 92,285–94,213 with targets to 91.9k/89.55k; switch long only on ≥2H or daily confirmation at ~84k or above 94,213.
- Key macro factor: FOMC decision likely sets direction; dovish break > 94,213 versus hawkish roll back into 89.55k/84k.
Stay disciplined: wait for your signal, then commit — this is a boss fight, not a button mash.

USD/CAD: Will the Great Divergence Break the Greenback?The financial world stands on the precipice of a defining moment for North American currency markets. The USD/CAD pair hovers near 1.3855, ticking nervously as traders count down to a rare double-header of central bank decisions. December 10, 2025, marks a pivotal divergence point where economic pathways between the United States and Canada split sharply. This is not merely a technical adjustment; it is a fundamental collision of monetary policy, geopolitical strategy, and industrial resilience. The outcome will likely dictate the Loonie’s trajectory for the coming year.
Macroeconomics: A Tale of Two Trajectories
The macroeconomic landscape reveals a stark contrast between the two nations. The Federal Reserve prepares to slash interest rates for the third consecutive time, targeting a range of 3.50%-3.75%. Markets price this move at nearly 88% probability. The US labor market displays clear signs of cooling, necessitating easier financing conditions to prevent a recession. Conversely, the Bank of Canada (BoC) stands firm. Canada’s economy defied expectations with a robust 2.6% annualized GDP growth in Q3, crushing earlier forecasts. This resilience compels the BoC to hold rates at 2.25% to prevent reigniting inflation, which remains sticky at 2.2%.
Geostrategy: The Fertilizer Chess Game
Beyond interest rates, a high-stakes geopolitical trade war complicates currency valuation. The US administration’s threat of severe tariffs on Canadian fertilizer imports paradoxically jeopardizes US food security. American farmers rely heavily on Canadian potash, importing over half of Canada’s production. Tariffs here act as a double-edged sword: they aim to punish Canada but simultaneously drive up input costs for the US agricultural sector. This strategic misstep weakens the US Dollar’s purchasing power domestically while forcing the administration to print subsidies, further diluting the currency.
Industry Trends: Agriculture Under Siege
The agricultural industry sits at the epicenter of this financial storm. The promise of $12 billion in aid to US farmers highlights the structural damage already inflicted by trade barriers. This subsidy model creates a vicious cycle of dependency rather than innovation. While Canadian fertilizer producers face tariff headwinds, their product remains essential, granting them significant pricing power. US farmers face a "margin squeeze" that ripples through the broader economy, softening the US economic outlook and diminishing the appeal of the Greenback relative to the resource-backed Loonie.
Management & Leadership: Powell vs. Macklem
Leadership styles at the central banks further amplify market volatility. Fed Chair Jerome Powell operates under intense political pressure and conflicting data, forcing a reactionary "data-dependent" approach. His leadership currently signals caution and retreat. In contrast, BoC Governor Tiff Macklem displays a steady hand, anchoring policy to tangible growth metrics like the recent 180.6K job surge. This stability in Canadian monetary leadership attracts foreign capital seeking predictable returns, creating a natural demand for the Canadian Dollar over the politically volatile USD.
Business Models: Supply Chain Resilience
The trade dispute forces companies to rethink business models. Canadian exporters are diversifying markets beyond the US, strengthening long-term resilience. Meanwhile, US importers face a supply chain crisis, unable to quickly source alternative fertilizer at competitive rates. This rigidity in the US supply chain exposes a critical weakness in the American business model for agriculture. Investors recognize this structural flaw, leading to capital flows that favor the adaptability of the Canadian export sector, thereby supporting the CAD against the USD.
Conclusion: The Loonie’s Rebellion
The confluence of diverging interest rates and self-inflicted US trade wounds creates a perfect storm for USD/CAD bears. The Federal Reserve’s dovish pivot contrasts sharply with the Bank of Canada’s confident hold, widening the yield spread in favor of Canadian assets. Combined with the strategic failure of fertilizer tariffs, fundamental drivers point toward a weaker US Dollar. Traders must watch the 1.3850 level closely; a break below likely signals the start of a prolonged downtrend for the pair. The divergence is real, and the Loonie is ready to rebel.

Gold (XAU/USD) at a CrossroadsGold has been consolidating within a well-defined ascending channel on the 4H timeframe, following a strong rally from late October. Recent price action has formed a clear range between the previous weekly high and low, with intraday swings narrowing, a classic sign of compression before expansion.
As the market awaits today’s Federal Reserve interest rate decision, the technical and macro setups appear to be converging.
On the 4-hour chart, gold continues to respect a broad upward channel, with a midline that has acted as a pivot zone. Current price action is hovering just above the channel midline and near the previous day high (PDH) and previous week low (PWL) levels, suggesting indecision.
Key Zones to Watch:
Support:
4,164–4,170 – Confluence of prior lows, minor Fibonacci zones
4,134 – Structural swing low; loss of this level could signal a deeper correction
4,040–4,050 – Historical demand zone and previous reaction area
Resistance:
4,246–4,265 – PDH / PWH zone; the top of current range
4,381 – Channel upper bound and extended target if bullish continuation resumes
Price has been trapped between ~4,170 and 4,265, forming a sideways structure or distribution phase. This type of price action often precedes large moves, the question is: which direction?
Macro Context – Fed Expected to Cut, But Tone May Be Hawkish
Today’s FOMC meeting is widely expected to deliver a 25 basis point rate cut, marking a potential shift from the high-rate regime of the past 18 months. However, market attention is squarely focused on the tone of the Fed’s forward guidance.
Several Fed officials have recently pushed back on aggressive easing expectations, signaling that even if a cut comes now, the path ahead may not be as dovish as markets hope. This sets the stage for what analysts call a “hawkish cut”, a rate reduction delivered with caution, and paired with messaging that suggests further cuts will be gradual or data-dependent.
Implications for gold:
-A hawkish tone may push U.S. yields and the dollar higher, applying pressure on gold
-A dovish surprise (or less hawkish tone) could boost gold, as it benefits from lower yields and a weaker USD
-The outcome could trigger significant short-term volatility, especially as gold is sitting near key technical levels
Bullish Scenario:
Fed cuts + dovish or neutral tone → yields fall, USD weakens
Gold breaks above 4,265 and
Upside targets: 4,320, 4,381, and possibly 4,400+ into early Q1 2026
Bearish Scenario:
Fed cuts, but tone is hawkish → yields rise, USD strengthens
Gold breaks below 4,164, then 4,134

AUDUSD moves sideways after the RBA holds rates steady
The RBA turned hawkish after holding the rate at 3.60%. The central bank acknowledged that inflation risks have increased despite three rate cuts since Feb, noting that recovering demand and rising wages are making it more difficult to return inflation to the target.
Governor Bullock emphasized that the RBA remains focused on inflation and signaled that, if price pressures persist, the bank may need to take appropriate action.
With policy divergence widening between the Fed and the RBA, the aussie dollar may continue to appreciate against the US dollar.
AUDUSD slightly broke below the ascending channel's lower bound before consolidating within the range of 0.6620–0.6650. The price remains above bullish EMAs, indicating a potential uptrend extension.
If AUDUSD reenters the ascending channel, the price may retest the following resistance at 0.6650.
Conversely, if AUDUSD breaks below EMA21 and the support at 0.6620, the price may retreat toward the next support at 0.6580.

NQ1! — Fed Week: 25,650 Inflection | Tight Decision📊 NQ1! NASDAQ 100 E-MINI FUTURES
December 9, 2025 | by officialjackofalltrades
🟡 CAUTIOUS |Fed Week Special Edition
EXECUTIVE SUMMARY - THE PRE-FED SETUP
Current Price: $25,651.50 | Date: December 9, 2025 | Change: -$48.25 (-0.19%)
The Nasdaq 100 E-mini futures are consolidating in a tight range between 25,000-26,300 as markets brace for tomorrow's Federal Reserve decision. After December E-mini Nasdaq futures rose +0.10% on Tuesday, the index is now sitting in a critical decision zone with massive implications for tech stocks.
The Technical Picture:
Pattern: Range-bound consolidation (4 weeks)
Current Position: Middle of range at 25,650
Resistance: 26,200-26,300 (tested multiple times, rejected)
Support: 24,700-24,900 (solid floor since November)
Key Level: 25,200 (bull/bear line)
The Fundamental Backdrop:
Big Tech was mixed at the close: Amazon booked a modest gain, while Apple, Meta and Microsoft finished slightly in the red. More importantly, These industry titans have consistently outpaced the broader S&P 500, with the S&P 500 Top 10 rising over 600% in total since January 1, 2016.
But here's the tension: AI capex coming from tech companies listed in the S&P 500 is $400 billion or more per year, going forward. The biggest AI company OpenAI has disclosed revenues of just $13 billion for 2025.
The Trade: Long from 25,200-25,600, target 26,500-27,200, stop 24,650. Risk/reward: 1:2.5 .
MARKET CONTEXT - WHAT'S REALLY HAPPENING
The Pre-Fed Paralysis
Stock indexes gave up early gains and settled mixed on Tuesday as bond yields climbed after the Oct JOLTS report showed job openings unexpectedly rose to a 5-month high.
This is classic pre-FOMC behavior : markets waiting for the catalyst before committing.
Investing.com - U.S. stock futures inch down ahead of the start of trading for December, with investors keeping tabs on a possible rate cut.
The AI Valuation Debate
Here's what's creating the consolidation: AI optimism vs. valuation concerns .
BULLISH CAMP:
Nvidia leads the tech sector with a market cap of $4.4 trillion
24/7 Wall St. forecast projects Nvidia revenue rising from $121 billion in 2025 to more than $265 billion by 2030
For the Mag 7 group, total earnings are expected to increase by +12.6% on +9.5% higher revenues in 2025
BEARISH CAMP:
OpenAI may have lost $12 billion in the third quarter of 2025 alone, according to a disclosure by Microsoft
806 Russell 2000 companies (40%) have no earnings or negative earnings
The revenues currently being generated by AI companies are far smaller than the amount of capex being directed at them
My Take: This is why NQ is stuck in range. Bulls see AI growth, bears see bubble. Fed decision tomorrow will tip the scale.
TECHNICAL ANALYSIS - THE RANGE-BOUND BATTLE
Pattern: Consolidation Rectangle (4 Weeks)
Your purple boxes perfectly capture the support/resistance clusters . Let me break down what the chart is telling us:
Key Technical Levels:
🔴 RESISTANCE (Selling Zones):
26,200-26,300: Tested 4 times since November, strong rejection zone
26,500-26,700: If we break above, this is next target
27,000-27,200: Extension target if Fed is dovish
🟢 SUPPORT (Buying Zones):
25,200-25,400: Minor support, current price zone
24,900-25,100: Major support cluster (your bottom purple box)
24,700-24,800: Absolute floor, tested Nov 19
24,300-24,500: Nuclear support if range breaks
Current Position: The Nasdaq 100 Futures price has ranged from 25,657.50 to 25,693.75 today extremely tight range showing indecision.
Technical Indicators:
Moving Averages:
50-day MA: ~25,400 (acting as support)
200-day MA: ~24,200 (long-term uptrend intact)
Golden Cross: Active since October = bullish
Volume:
The current trading volume for Nasdaq 100 Futures is 6,395 very low , typical pre-Fed paralysis.
RSI:
Currently: ~52-55 (neutral)
Not overbought (room to run)
Not oversold (no panic)
MACD:
Flat, coiling for breakout
Waiting for directional catalyst
SCENARIO ANALYSIS - THREE FED OUTCOMES
SCENARIO A: Dovish Cut (55% Probability) - BULLISH
What Happens:
Fed cuts 25bps ✓
Dot plot shows 3-4 more cuts in 2026 ✓
Powell emphasizes "labor market concerns" ✓
Tech gets green light to continue AI spending ✓
Market Reaction:
Immediate: NQ pumps 1.5-2% to 26,000-26,200
Day 1-3: Breakout above 26,300, test 26,700
Week 1-2: Rally to 27,000-27,500
Month 1: Target 27,800-28,200 (+9-10%)
Winners:
Nvidia (NVDA), AMD (AMD), Broadcom (AVGO) lead
Mag 7 outperform
High-growth tech rallies hard
Trade Setup:
Enter: Current 25,650 OR breakout above 26,300
Add: On pullback to 26,000 after breakout
Target: 27,500 (+7.2%)
Stop: 25,100 (-2.1%)
Risk/Reward: 1:3.4
SCENARIO B: Hawkish Cut (35% Probability) - CHOPPY
What Happens:
Fed cuts 25bps ✓
BUT dot plot shows only 1-2 cuts in 2026 ❌
Powell says "inflation still concerning" ❌
Tech valuations questioned ❌
Market Reaction:
Immediate: NQ drops 1-1.5% to 25,200-25,400
Day 1: Volatility, test 24,900 support
Week 1-2: Choppy recovery to 25,800-26,000
Month 1: Grind back to 26,200-26,500 (+2-3%)
Losers:
High-valuation AI stocks hit hard
Stocks with high capex vs. revenue scrutinized
Small caps underperform
Trade Setup:
DO NOT chase before Fed
Buy: Dip to 24,900-25,100 (support)
Target: 26,000-26,300 (+5-6% from dip)
Stop: 24,650 (-2%)
Risk/Reward: 1:2.5
SCENARIO C: No Cut OR Very Hawkish (10% Probability) - BEARISH
What Happens:
Fed HOLDS at 3.75-4% ❌
OR cuts but says "this is the last one" ❌
Powell cites AI bubble concerns ❌
Tech sell-off accelerates ❌
Market Reaction:
Immediate: NQ crashes 2-3% to 24,700-25,000
Day 1: VIX spikes, panic selling
Week 1-2: Test 24,300-24,500
Month 1: Bottom around 23,800-24,200 (-7-8%)
Trade Setup:
Exit ALL longs immediately
Wait for capitulation
Buy: 24,000-24,300 (major support)
Target: Recovery to 25,500-26,000 (+6-8%)
High stress, high reward
THE TRADE SETUP - PROFESSIONAL EXECUTION
🟢 PRIMARY LONG SETUP: BUY NQ1!
Entry Strategy (Scale In):
Option A: Conservative (Wait for Dip):
25,000-25,200 (IF hawkish dip)
24,800-25,000 (IF deeper dip to support)
Best for: Risk-averse traders
Stop Loss: 24,650 (HARD STOP)
Below 24,650 = range break on daily
Below this = technical structure invalidated
Max loss from 25,650 entry:
Take Profit Targets:
TP1: 26,200-26,500
Range breakout + resistance retest
Action: Take 40% profit, move stop to 25,200
Gain: +2.1-3.3% | Risk/Reward: 1:2
TP2: 27,000-27,500
Momentum continuation post-Fed
Technical indicators show Strong Buy signal
TP3: 27,800-28,200
Full breakout, AI optimism returns
Long-term forecast shows potential to $28,452
Entry Confirmation Checklist:
Before entering, CHECK:
✅ Price holding above 25,200 (bull/bear line)
✅ Volume spike on bounce (15K+ contracts on 4H)
✅ Fed announces 25bps cut (as expected)
✅ Powell's tone dovish or neutral (not hawkish)
✅ Mag 7 stocks holding up (NVDA, MSFT, AAPL)
✅ VIX below 16 (fear contained)
WAIT FOR 4/6 BEFORE FULL POSITION
Use Micro E-minis (MNQ) for Better Sizing:
MNQ = $2/point (vs NQ $20/point)
Same moves, 1/10th capital
Better for risk management
Fed Day Protocol (December 10):
2:00 PM ET - Fed Statement:
Tighten stops to 25,100 before announcement
READ statement immediately
Ignore first 5 minutes (algo chaos)
2:30 PM ET - Powell Press Conference:
WATCH LIVE - tone matters more than words
Dovish = add to position on dip
Hawkish = cut 50%, tight stops
5. Emergency Exits:
❌ Daily close below 24,650 = EXIT ALL
❌ VIX spikes above 22 = EXIT 50%
❌ Fed announces NO cut = EXIT ALL
❌ Powell says "last cut for 6+ months" = EXIT 50%
❌ Mag 7 stocks crash 3%+ = EXIT 50%
FUNDAMENTAL ANALYSIS - THE AI CONUNDRUM
CATALYST #1: The Magnificent 7 Dominance
Nvidia, Microsoft, and Apple make up 20.7% of the S&P 500 and 43.6% of the Vanguard Information Technology ETF.
This concentration means:
NQ lives or dies by Mag 7 performance
Fed policy directly impacts these valuations
Any weakness cascades fast
Current Status:
Nvidia: $4.37T market cap
Apple: $4.20T market cap
Microsoft: $4T+ market cap
CATALYST #2: The AI Spending Paradox
Here's the $400 billion question :
AI capex from S&P 500 tech companies is $400 billion or more per year. The biggest AI company OpenAI has disclosed revenues of just $13 billion for 2025.
The Math Doesn't Add Up:
Spending: $400B/year
Revenue: $13B/year
Gap: $387B/year of unprofitable spending
"Can the 10 AI companies generate enough revenue to justify the capex?"
says Torsten Sløk, chief economist at Apollo Global Management.
BUT: Nvidia revenue projected to rise from $121B in 2025 to $265B by 2030 revenue IS growing, just not fast enough yet.
CATALYST #3: Earnings Growth Remains Strong
Mag 7 earnings expected to increase +12.6% on +9.5% higher revenues in 2025.
Excluding the Mag 7, total earnings for remaining S&P 500 companies expected to grow +8.7% in 2025.
Translation: Even without AI hype, earnings are solid.
CATALYST #4: Fed Policy is CRITICAL
With U.S. 10-year Treasury yields hovering just above 4% and the Fed set to decide on a widely expected rate cut, growth stocks remain sensitive to even small changes in rate expectations.
Why This Matters:
Lower rates = higher valuations for growth
Higher rates = multiple compression
Tech has highest duration risk
RISK FACTORS - THE BEAR CASE
RISK #1: AI Bubble Concerns
Nvidia's Jensen Huang says he doesn't believe we're in an AI bubble. Amazon's Jeff Bezos says we probably are in one. OpenAI's Sam Altman has invoked a bubble, adding, "I do think some investors are likely to lose a lot of money".
Even AI leaders are split!
RISK #2: Valuation Stretched
OpenAI may have lost $12 billion in Q3 2025 alone, yet is valued at $500 billion by VCs.
If valuations reset, NQ drops 15-20%.
RISK #3: Concentration Risk
Since October 2022, roughly 75% of gains in S&P 500 have come from just seven stocks.
If Mag 7 stumbles, entire index falls .
RISK #4: Technical Breakdown
Break below 24,650 = target 23,800-24,200 (-6-7%)
THE BOTTOM LINE
Here's what I KNOW on December 9, 2025:
✅ Fed expected to cut 25bps tomorrow
✅ NQ technical indicators show Strong Buy
✅ Mag 7 earnings growing +12.6% in 2025
✅ NQ in consolidation range 25,000-26,300
✅ Support at 24,900 has held 4 times
✅ Your purple boxes show clear support/resistance
Here's what I DON'T know:
Will Powell be dovish or hawkish?
How many 2026 cuts will dot plot show?
Will AI bubble concerns accelerate?
But here's the MATH:
Risk: 25,650 → 24,650
Reward: 25,650 → 27,500
Extended: 25,650 → 28,200
The Play:
Small position NOW 25,650
IF hawkish dip to 24,900-25,100
IF dovish → ADD on breakout above 26,300
Stop 24,650
Target 27,500, then 28,200
Position accordingly.
Follow officialjackofalltrades for institutional-grade futures analysis, Fed-day strategies, and professional risk management.
Drop a 📊 if you're trading NQ through the Fed decision.
Drop a 🎯 if this analysis helped your setup.
Drop a 💰 if you're ready for 27,500+ breakout.
Disclaimer: This is not financial advice. This post is for educational and informational purposes only. Always do your own research and manage your own risk.

XAUUSD Set for Surge? Safe-Haven Demand and Fed Cut Bets AlignHey Traders,
In today’s session we are monitoring XAUUSD for a potential buying opportunity around the 4,200 zone. Gold remains in a strong uptrend, and the current correction is bringing price back toward the key 4,200 support–resistance area, which could offer a favorable entry.
Fundamentally, GOLD should continue to benefit from the ongoing weakening of the U.S. Dollar, driven by expectations of a 25bps rate cut. As we head into Wednesday’s FOMC, markets are likely to keep front-running the event, which typically pressures the dollar lower.
Just be cautious—if we see too much front-running, the classic “buy the rumor, sell the fact” reaction could hit once the decision is officially announced.
Additionally, rising geopolitical tensions between Venezuela and the United States are increasing safe-haven demand, which further supports upside for Gold.
Trade safe,
Joe.

Bitcoin Pre‑FOMC: 92.3k Reclaim or 84k Reload__________________________________________________________________________________
Market Overview
__________________________________________________________________________________
Bitcoin remains in a controlled range beneath 92,285–94,213, with sellers defending overhead supply while buyers cluster around the mid-to-high 80Ks. Momentum is two‑sided but tilts cautious as macro risk remains event‑driven into the Fed.
Momentum: Range with a bearish tilt under 92,285; rallies fade at HTF resistance while 88–84k buys time for consolidation.
Key levels:
- Resistances (4H/1D): 92,285–94,213; 98,330 (weekly underside).
- Supports (4H/1D): 89,258–88,122; 83,871–84,405 (dense cluster with D Pivot Low).
Volumes: Mostly normal on 1–6H with occasional 15m spikes; overall moderate.
Multi-timeframe signals: 12H Down vs 1D Up; 4H attempts up but stalls at 92,3k; net NEUTRAL SELL bias until reclaim.
Harvest zones: 75,700 (Cluster A) / 83,600–84,400 (Cluster B) — ideal dip‑buy areas for inverse pyramiding if a flush prints a ≥2H reversal.
Risk On / Risk Off Indicator context: Neutral sell bias; it confirms the cautious momentum and favors disciplined fades at resistance unless 92,3k is reclaimed.
__________________________________________________________________________________
Trading Playbook
__________________________________________________________________________________
Strategically, treat this as a range with overhead supply; lean patient and reactive, not predictive.
Global bias: NEUTRAL SELL while price is capped below 92,285; invalidation of the cautious stance on a sustained reclaim and hold above 92,285.
Opportunities:
- Buy: 84,0–84,6k cluster only on ≥2H bullish reversal; scale toward 90,2–90,6k, then 92,3–94,2k.
- Breakout: Long on break & retest of 92,3k with breadth; target 94,2k then 98,3k.
- Tactical sell: Fade 92,3–94,2k rejection with weak breadth; manage to 90,4k then 88,3–88,0k.
Risk zones / invalidations: Break and daily/12H hold above 94,6k would invalidate the near‑term short bias; loss of 83,6–83,9k would invalidate the long-at‑84k thesis.
Macro catalysts (Twitter, Perplexity, news):
- FOMC decision and guidance are the near‑term pivot; a dovish tilt could clear 92,3k, a firm tone risks a re‑test of 88k/84k.
- ETF flows slightly negative — a mild headwind to risk‑on.
- External dashboard: Risk On / Risk Off Indicator in sell mode; credit‑sensitive gauges soft, early‑cycle tech mixed — mid‑cycle feel.
Harvest Plan (Inverse Pyramid):
- Palier 1 (12.5%): 75,700 (Cluster A) + reversal ≥2H → entry
- Palier 2 (+12.5%): 72,500–71,200 (-4/-6% below Palier 1) → reinforcement
- TP: 50% at +12–18% from PMP → recycle cash
- Runner: hold if break & hold first R HTF (92,285)
- Invalidation: < HTF Pivot Low (83,900) or 96h no momentum
- Hedge (1x): Short first R HTF on rejection + bearish trend → neutralize below R
__________________________________________________________________________________
Multi-Timeframe Insights
__________________________________________________________________________________
Across frames, the market grinds in a capped range: higher timeframes hold key resistance while midframes lean downtrend, keeping the tape tactical.
12H/6H/2H/30m/15m (Down bias): Price capped below 92,3k with frequent fades; supports at 89,0–88,1k and the 84k cluster attract mean‑reversion bounces.
1D/4H (Up attempt but constrained): Structure can repair if 92,3k breaks and holds; until then, path of least resistance is sideways‑to‑down inside the range.
1H (Mixed): Local supply at 90,9–91,3k acts as a lid; reclaiming this band is often a precursor to testing 92,3k.
__________________________________________________________________________________
Macro & On-Chain Drivers
__________________________________________________________________________________
Macro is event‑driven into the Fed, with mixed risk gauges and soft crypto fund flows tempering trend conviction.
Macro events: Fed decision and press conference in focus; a dovish read supports a 92,3k reclaim while a firm stance risks extending the range or probing 88k/84k. Global yields firmed on ECB tone; gas prices soft aid disinflation.
External Macro Analysis: The Risk On / Risk Off Indicator leans sell; credit‑risk gauges cautious; early‑cycle tech mixed — a mid‑cycle profile that aligns with a neutral‑sell technical bias unless 92,3k flips.
Bitcoin analysis: ETF net outflows are a mild headwind; corporate bids provide dip demand but not trend control. 92k is the ceiling to clear; 88k is pivotal support.
On-chain data: Ownership concentration rising as small holders ebb; whale transfers noted but directional intent unclear; realized volatility remains muted, consistent with “controlled vol.”
Expected impact: Macro/on‑chain context supports a patient, reactive stance — bullish if 92,3k is reclaimed with volume, cautious if 88k breaks toward the 84k cluster.
__________________________________________________________________________________
Key Takeaways
__________________________________________________________________________________
Range with a cautious tilt persists beneath 92,3k as the market awaits the Fed.
- Trend: Neutral to bearish inside 92,285–94,213 resistance; buyers defend 88–84k.
- Best setup: Buy only on confirmed 84k reversal or 92,3k break‑and‑retest; fade weak rejections into 92,3–94,2k.
- Macro: FOMC guidance is the catalyst that can resolve the range and validate or negate the 92,3k reclaim.
Stay patient and surgical — in this Tarkov‑style map, the best loot is in defended zones, not in blind pushes.

USDCAD plunges as BOC vs Fed divergence grows! Can it continue?USDCAD has broken sharply lower following Canada's surprise jobs blowout on Friday, with the pair now pricing in a divergence: the Bank of Canada is expected to hold rates Wednesday, while the Fed is expected to cut.
Canada added 54,000 jobs in November, and the unemployment rate plunged to 6.5%, taking a BOC cut off the table. Meanwhile, the Fed is 90% priced to cut by 25bps on Wednesday, narrowing the rate differential and weakening the US dollar against the loonie.
Key drivers
Canada jobs report beat expectations with +54k positions (vs expected loss), unemployment fell to 6.5% from 6.9% — three straight months of gains totalling 181k jobs.
BOC decision this week virtually certain to hold at 2.25% after cutting in October and signalling the easing cycle is likely over.
Fed FOMC decision on Wednesday priced in at 90% odds for a 25bps cut to 3.75–4%, the third consecutive cut driven by cooling US labour and dovish Fed commentary.
Technical: USDCAD corrected to 50% Fibonacci (1.4140–60) of the 1.4790–1.3543 impulse leg and is now breaking down in a potential head and shoulders pattern with neckline at 1.3543.
Downside targets: 1.3370–1.3396 (61.8% extension + 50% retracement confluence), 1.3068 (61.8% retracement), and 1.2895 (100% extension full measured move).
Risk scenario: Neckline hold above 1.3543 could see bounce back toward 1.36 or 1.43, but below 1.4140, the path of least resistance is lower.
Are you trading the USDCAD breakdown? Share your head and shoulders setups in the comments and follow for more central bank divergence and technical trade ideas.
This content is not directed to residents of the EU or UK. Any opinions, news, research, analyses, prices or other information contained on this website is provided as general market commentary and does not constitute investment advice. ThinkMarkets will not accept liability for any loss or damage including, without limitation, to any loss of profit which may arise directly or indirectly from use of or reliance on such information.

Stop!Loss|Market View: GOLD🙌 Stop!Loss team welcomes you❗️
In this post, we're going to talk about the near-term outlook for GOLD ☝️
Potential trade setup:
🔔Entry level: 4167.192
💰TP: 3900.356
⛔️SL: 4370.061
"Market View" - a brief analysis of trading instruments, covering the most important aspects of the FOREX market.
👇 In the comments 👇 you can type the trading instrument you'd like to analyze, and we'll talk about it in our next posts.
💬 Description: After breaking out of the accumulation in a symmetrical triangle, gold prices formed an accumulation near the 4200 level, indicating the emergence of a potential limit seller who, after breaking out of the accumulation, will sell the instrument to those willing to buy at the breakout. Against this backdrop, a downward movement is likely expected, and given the potential volatility this week, two scenarios are being considered.
Thanks for your support 🚀
Profits for all ✅

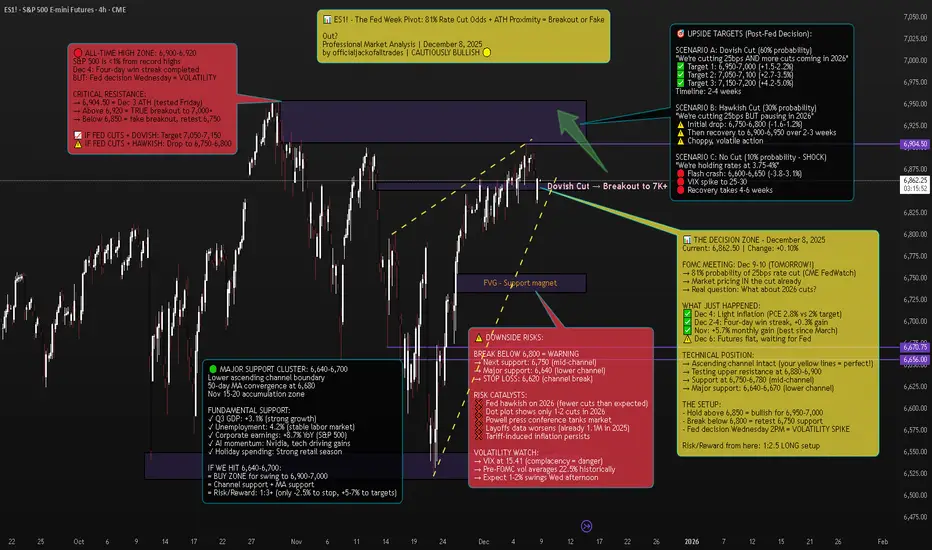
ES1! S&P 500 E-mini Futures - The Fed Week Pivot📈 Executive Summary - The Setup
Current Price: 6,862.50 | Date: December 8, 2025 | Change: +6.75 (+0.10%)
The S&P 500 E-mini futures are sitting less than 1% from all-time highs on the eve of the Federal Reserve's most anticipated meeting of 2025. After a four-day win streak that added 0.3% to the index, markets are now in a classic consolidation pattern at resistance, waiting for Wednesday's 2PM ET catalyst.
The Technical Picture:
Pattern: Ascending channel (intact since November)
Current Position: Testing upper resistance at 6,880-6,900
ATH: 6,904.50 (December 3) - 0.6% away
Support: 6,750-6,780 (mid-channel), 6,640-6,670 (lower channel)
The Fundamental Backdrop:
FedWatch shows a near-90% probability the FOMC will cut the target range for the federal funds rate by another 25 basis points. But here's what markets are REALLY pricing: not just the cut itself (that's a given), but Powell's guidance on 2026.
Minutes from the October meeting showed "many" FOMC members saying no more cuts are needed at least in 2025. Yet the market now indicates an 80% likelihood of a December rate cut, following dovish statements from NY Fed President John Williams and Fed Governor Christopher Waller.
The Trade: This is a tactical long from 6,850-6,870 targeting 6,950-7,050, with stop at 6,820. Risk/reward: 1:2.5.
But the real opportunity? Buying any Fed-induced dip to 6,750-6,800 for a swing to 7,000+.
🔎 Market Context - What's REALLY Happening
The Pre-Fed Calm
US stock futures stall as traders wait for the Fed meeting, with the S&P 500 just below record highs. This is textbook behavior: The indexes have quietly stitched together consistent gains. The Dow and Nasdaq scored back-to-back positive weeks; the S&P 500 added another 0.3% and now sits only a touch from record territory.
S&P 500 futures (ES) traded around 6,880-6,885, roughly 0.1% higher by 6:00-7:30 a.m. ET on Monday.
But don't mistake the calm for weakness. Even after November's wobble, dip-buyers came back as shutdown fears faded and AI jitters cooled.
The Fed's Dilemma
The Federal Reserve is in an impossible position:
Argument FOR cutting:
Concerns about a softening labor market
Employers cut more than 1.1 million jobs through November, the most since 2020 and a 54% increase from the same period a year ago
Job growth remains too low to keep up with labor supply growth and a rising unemployment rate
Argument AGAINST cutting:
Latest inflation scorecard, the Fed's preferred PCE index, is running at 2.8 percent a year, close to its 2 percent goal but not quite there
The annualized inflation rate grew to 3% in September from 2.9% in August and 2.7% in July
Officials expressing skepticism about the need for an additional cut that markets had been widely anticipating, with "many" saying that no more cuts are needed at least in 2025
The Missing Data Problem:
Here's something CRITICAL that most traders don't know: The U.S. central bank will have to make its decision without some key government data. Hiring data for November and the latest inflation number have been delayed until mid-December, after the Fed's meeting, because of the U.S. government shutdown.
The meeting minutes indicated the decision-making was complicated by a lack of government data during the 44-day federal government shutdown. Powell himself compared this to "driving in the fog".
Translation: The Fed is making a $28 TRILLION (SPY market cap) decision BLIND.
The Internal FOMC War
"It's difficult to recall a time when the Federal Open Market Committee has been so evenly divided about the need for additional rate cuts than the upcoming December meeting," Michael Pearce, chief U.S. economist at Oxford Economics, said.
Jerome Powell faces a credibility issue as he tries to satisfy hawks and doves on the most divided Fed in recent memory.
The October meeting vote was 10-2, but the 10-2 vote was not indicative of how split officials were at an institution not generally known for dissent. The minutes revealed multiple camps:
Some favored cutting
Some supported cutting but could have supported holding
Several were against cutting
For December, Mericle expects at least two dissents in favor of no rate cut as well as one in favor of a larger rate cut.
📊 Technical Analysis - The Ascending Channel At Decision Point
The Pattern: Ascending Channel (Bullish Structure)
Your chart annotation is PERFECT. The yellow dashed ascending channel captures the exact structure driving ES1! since the November bottom.
Channel Characteristics:
Lower Support: 6,640 (tested Nov 15, Nov 29) → 6,670 (current)
Upper Resistance: 6,850 (Nov 25) → 6,900 (Dec 3-6) → 6,920 (projected)
Angle: ~25° (strong bull trend)
Tests: 6 touches (3 upper, 3 lower) = highly reliable pattern
Current Position: We're at the UPPER boundary of the channel, testing 6,880-6,900 resistance.
Key Technical Levels:
🔴 RESISTANCE (Selling pressure zones):
6,880-6,900: Current test, upper channel boundary
6,904.50: All-time high from December 3
6,920-6,950: True breakout zone (if we clear ATH)
7,000: Psychological milestone
🟢 SUPPORT (Buying interest zones):
6,850: Immediate support, bull/bear line
6,800-6,820: Minor support cluster + FVG
6,750-6,780: Mid-channel support + 23.6% Fib
6,700-6,720: 38.2% Fib retracement
6,640-6,670: Major support (lower channel + 50-day MA + November accumulation)
Technical Indicators:
Moving Averages:
50-day MA: ~6,680 (rising, bullish)
200-day MA: ~6,450 (rising, bullish)
Golden Cross: Active since mid-November = long-term bullish
RSI (Relative Strength Index):
Current: 58-60 (neutral/slightly bullish)
Not overbought (room to run to 70+)
Not oversold (not panic selling)
Interpretation: Healthy consolidation before next leg
Volume Analysis:
Declining volume into Fed decision = normal pre-FOMC behavior
Stock volatility averages around 22.5% in the month preceding rate cuts, compared with roughly 15% during normal periods
Expect volume spike Wednesday 2PM-4PM (100K+ contracts)
VIX (Fear Index):
VIX at 15.41, down -0.37 (-2.34%)
This is LOW = market complacency
Pre-FOMC, VIX typically rises to 18-22
IF VIX spikes to 20+ Wednesday = sell signal
🎯 Scenario Analysis - Three Possible Outcomes
SCENARIO A: Dovish Cut (60% Probability) - BULLISH
What Happens:
Fed cuts 25bps to 3.50-3.75% range ✓
Dot plot shows 3-4 more cuts in 2026 ✓
Powell says "labor market concerns outweigh inflation" ✓
Balance sheet runoff stops as planned (December 1) ✓
Market Reaction:
Immediate: ES pumps 1-1.5% to 6,930-6,950
Day 1-3: Consolidation at 6,920-6,950
Week 1-2: Breakout to 7,050-7,100
Month 1: Target 7,150-7,200 (+4.2%)
Sector Leaders:
Small caps (Russell 2000) +2-3%
Tech (Nasdaq) +1.5-2%
Financials +1-1.5%
Trade Setup:
Enter: ANY dip to 6,850-6,870 before Fed
Add: On breakout above 6,910 with volume
Target: 7,050 (+2.7%), 7,150 (+4.2%)
Stop: 6,820 (-0.6%)
Risk/Reward: 1:4
SCENARIO B: Hawkish Cut (30% Probability) - NEUTRAL/CHOPPY
What Happens:
Fed cuts 25bps to 3.50-3.75% range ✓
BUT dot plot shows only 1-2 cuts in 2026 ❌
Powell says "we're near neutral, will pause to assess" ❌
Market had priced in 3-4 cuts for 2026 = DISAPPOINTMENT
Market Reaction:
Immediate: ES drops 0.8-1.2% to 6,790-6,820
Day 1: Volatility, chop between 6,780-6,850
Week 1-2: Dip-buying brings it back to 6,870-6,900
Month 1: Grind back to 6,950-7,000 (+1.3%)
Sector Rotation:
Small caps (Russell 2000) -1.5-2%
Tech holds up better (mega-caps)
Defensives (utilities, staples) outperform
Trade Setup:
DO NOT chase before Fed (risk of -1.2% drop)
Buy: Dip to 6,750-6,800 (mid-channel support)
Target: 6,900-6,950 (+2-3% from dip entry)
Stop: 6,720 (-1%)
Risk/Reward: 1:2
SCENARIO C: No Cut OR Very Hawkish (10% Probability) - BEARISH
What Happens:
Fed HOLDS at 3.75-4% range (SHOCK) ❌
OR cuts but says "this is the last one for 6+ months" ❌
Powell cites inflation persistence, tariff risks ❌
Market has 90% priced in for cut = PANIC
Market Reaction:
Immediate: ES flash crashes 2-3% to 6,650-6,750
Day 1: Volatility, VIX spikes to 25-30
Week 1-2: Bounce attempt to 6,750-6,800 fails
Month 1: Retest 6,600, then recovery to 6,800-6,850
Sector Carnage:
Small caps (Russell 2000) -3-4%
Tech -2-3%
Everything bleeds
Trade Setup:
Exit ALL longs immediately on no-cut announcement
Wait for VIX to spike above 25
Buy: Capitulation at 6,600-6,650 (lower channel)
Target: Recovery to 6,850-6,900 (+3-4%)
Risk/Reward: 1:3 (but high stress)
🎯 THE TRADE SETUP - Professional Execution Plan
🟢 PRIMARY LONG SETUP: BUY ES1!
Entry Strategy (Scale In):
Option A: Conservative (Wait for Fed)
50% at 6,750-6,780 (IF hawkish cut dips)
50% at 6,720-6,750 (IF deeper dip)
Best for: Risk-averse traders
Option B: Tactical (Enter Now)
40% at 6,860-6,870 (current - small position)
30% at 6,820-6,840 (IF pre-Fed dip)
30% at 6,750-6,780 (IF post-Fed dip)
Best for: Experienced traders comfortable with volatility
Stop Loss: 6,620 (HARD STOP)
Below 6,620 = channel break on daily close
Below this = technical structure invalidated
Max loss from 6,862 entry: -3.5%
Take Profit Targets:
TP1: 6,950-7,000 (Probability: 70%)
Initial breakout above ATH
Psychological 7,000 level
Action: Take 40% profit, move stop to 6,850
Gain: +1.3-2.0% | Risk/Reward: 1:2
TP2: 7,050-7,100 (Probability: 50%)
Momentum continuation
Channel projection
Action: Take 30% profit, trail stop to 6,920
Gain: +2.7-3.5% | Risk/Reward: 1:3
TP3: 7,150-7,200 (Probability: 30%)
Full breakout extension
TradingView puts it, with a potential breakout in S&P 500 futures above the 6,900 area
Action: Take 20% profit, let 10% ride
Gain: +4.2-4.9% | Risk/Reward: 1:4
Entry Confirmation Checklist:
Before entering, CHECK:
✅ Price holding above 6,850 (bull/bear line)
✅ Volume spike on bounce (80K+ contracts on 15min)
✅ RSI crosses above 60 (momentum shift)
✅ VIX drops below 16 (fear subsiding)
✅ Fed announces 25bps cut (as expected)
✅ Powell's tone is dovish or neutral (not hawkish)
WAIT FOR 4/6 BEFORE FULL POSITION
Fed Day Volatility Protocol:
December 10, 2PM ET - Fed Announcement:
1:45 PM: Tighten stops to 6,830 (before announcement)
2:00 PM: Fed statement released - READ IMMEDIATELY
2:00-2:05 PM: Algorithmic reaction (ignore, volatile)
2:05-2:30 PM: Human digestion of statement
2:30 PM: Powell press conference begins - WATCH LIVE
2:30-3:15 PM: Powell Q&A determines direction
3:15-4:00 PM: Final positioning for overnight
IF DOVISH: Add to position on dip to 6,900
IF HAWKISH: Cut 50%, trail rest tight at 6,820
Weekly Monitoring:
Check EVERY DAY:
Fed speakers: Any 2026 guidance changes
Economic data: Jobs (Dec 16), CPI (Dec 18)
Technical levels: Is channel intact?
VIX: Spikes above 20 = warning
Volume: Declining = weak trend
Emergency Exit Conditions:
❌ Daily close below 6,620 = EXIT ALL (channel break)
❌ VIX spikes above 25 = EXIT 50%, tight stop on rest
❌ Fed announces NO cut (10% scenario) = EXIT ALL immediately
❌ Powell says "this is the last cut for 2026" = EXIT 50%
❌ ES gaps down >1.5% overnight = reassess, likely exit
📊 Fundamental Analysis - Why This Matters
CATALYST #1: The Fed's Impossible Position
Federal Reserve policymakers are expected to cut interest rates at this week's meeting despite inflation remaining above their target amid concerns about a softening labor market.
This is the classic Fed dual mandate dilemma:
Mandate #1: Maximum employment (FAILING - 1.1M layoffs in 2025)
Mandate #2: Stable prices (FAILING - inflation at 2.8% vs 2% target)
They can't fix both. So they have to choose.
David Mericle, chief U.S. economist at Goldman Sachs notes job growth remains too low to keep up with labor supply growth and a rising unemployment rate.
My take: The Fed will prioritize employment over inflation. That's dovish = bullish for stocks.
CATALYST #2: Corporate Earnings Remain Strong
Despite all the macro noise, corporate profits are SOLID:
S&P 500 earnings: +8.7% YoY
Tech sector leading: +12-15% earnings growth
AI spending driving margins higher
Q4 guidance mostly positive
Carvana (CVNA) stock rose 8% before the bell on Monday following news on Friday that it will join the S&P 500 as part of the index's quarterly rebalancing.
Translation: Fundamentals support higher prices, Fed just needs to cooperate.
CATALYST #3: Seasonal Tailwinds
Could spark a "year-end melt-up", as TradingView puts it, with a potential breakout in S&P 500 futures above the 6,900 area.
December-January has positive seasonality:
Holiday spending strong
Tax-loss selling done (Nov-early Dec)
January effect (fresh capital inflows)
Pension/401k rebalancing (buy equities)
Historically, S&P 500 averages +1.3% in December and +1.1% in January.
CATALYST #4: Institutional Positioning
Bloomberg's interviews with 39 investment managers show that most are still planning for a risk-on 2026, citing expectations of continued AI-driven productivity and earnings growth.
But here's the key: Asset managers such as EFG Asset Management and BNP Paribas Asset Management caution that with 2025 already a strong year, they are reluctant to increase equity exposure into thin year-end liquidity, preferring instead to wait for better entry points in early 2026.
Translation: Institutions are WAITING to buy. Any Fed-induced dip to 6,750-6,800 will be AGGRESSIVELY bought.
⚠️ Risk Factors - The Bear Case
RISK #1: Hawkish Powell Tanks Market
Feroli noted that the firm is anticipating at least two dissents in favor of no rate cut as well as one in favor of a larger rate cut.
If Powell leans hawkish to appease the dissenting hawks, market could drop 1-2%.
RISK #2: Tariff-Induced Inflation
Minutes mentioned Trump's tariff policies in forecasts they provided in early September, projecting higher inflation and unemployment, slower growth and a lower federal funds ratel.
If inflation accelerates in 2026 due to tariffs, Fed might have to HIKE again = very bearish.
RISK #3: Labor Market Deterioration
Employers cut more than 1.1 million jobs through November, the most since 2020 and a 54% increase from the same period a year ago.
If this accelerates, could trigger recession fears.
RISK #4: Technical Breakdown
Break below 6,620 = channel invalidated → target 6,500-6,550 (-4.5-5.2%)
🔥 The Bottom Line
Here's what I KNOW on December 8, 2025:
✅ 81% probability of 25bps cut Wednesday
✅ S&P 500 less than 1% from ATH
✅ Your ascending channel is PERFECT technical structure
✅ 39 investment managers planning risk-on 2026
✅ Corporate earnings strong (+8.7% YoY)
✅ Seasonal tailwinds (December +1.3% avg)
✅ Support at 6,750-6,800 = institutional buy zone
Here's what I DON'T know:
Will Powell be dovish or hawkish?
How many 2026 cuts will dot plot show?
Will Q&A reveal recession concerns?
But here's what the MATH says:
Risk: 6,862 → 6,620 = -3.5% (if channel breaks)
Reward: 6,862 → 7,050 = +2.7% (base case)
Extended: 6,862 → 7,150 = +4.2% (bull case)
Risk/Reward: 1:2.5 minimum
The Play:
Small position NOW at 6,860-6,870 (20-30% of intended size)
IF hawkish dip to 6,750-6,800 → ADD 50-70%
IF dovish → ADD on breakout above 6,910
Stop at 6,620 (non-negotiable)
Target 7,050, then 7,150
This is a PROBABILITY game. 60% dovish, 30% hawkish, 10% shock. Position accordingly.
📍 Follow officialjackofalltrades for institutional-grade technical analysis, professional risk management, and trades backed by data.
Drop a 📊 if you're trading the Fed decision.
Drop a 🎯 if this helped your ES1! analysis.
Drop a 💰 if you're ready for 7,000+ SPX.