RDDT Reddit Options Ahead of EarningsAnalyzing the options chain and the chart patterns of RDDT Reddit prior to the earnings report this week,
I would consider purchasing the 210usd strike price Calls with
an expiration date of 2025-11-7,
for a premium of approximately $11.00.
If these options prove to be profitable prior to the earnings release, I would sell at least half of them.
Fundamental Analysis

THE KOG REPORT - FOMCTHE KOG REPORT – FOMC
This is our view for FOMC, please do your own research and analysis to make an informed decision on the markets. It is not recommended you try to trade the event if you have less than 6 months trading experience and have a trusted risk strategy in place. The markets are extremely volatile, and these events can cause aggressive swings in price.
We’ve done pretty well this week so we’ll only share the levels and potential path but say that it’s really not worth getting involved in the FOMC move itself. We’d rather wait for them to move the price and then look for a set up to get a trade due to the extreme volatility on gold this month.
Below, we have the support level 3965-75 which needs to hold us up in order for this daily candle to close bullish and attempt to target the higher liquidity regions of 4050 and above that 4095. A break above which is very possible will take us into our area or interest which is around the 4150 region. It’s that region we will want to watch, if approached and we get a reaction, an opportunity to short from there may be available to traders.
Because we’re already in long from the swing, there is no point attempting to short it from here, instead, if we do go downside into the lower levels, we will be looking at the 3840-60 regions for a reaction in price to then attempt the scalp long.
RED BOXES:
Break below 3985 for 3955 and 3938 in extension of the move
Break above 4003 for 4020, 4030 and 4061 in extension of the move
Please do support us by hitting the like button, leaving a comment, and giving us a follow. We’ve been doing this for a long time now providing traders with in-depth free analysis on Gold, so your likes and comments are very much appreciated.
As always, trade safe.
KOG

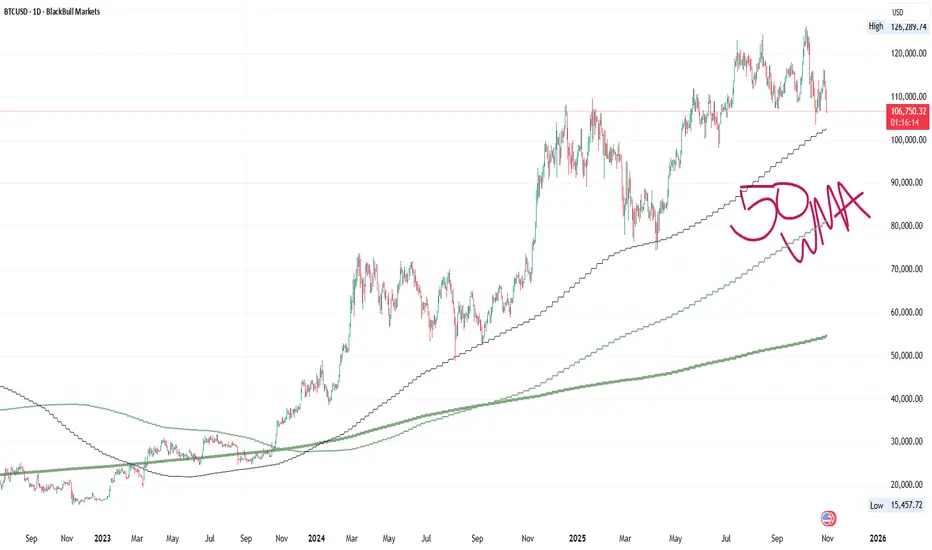
Bitcoin’s 50-week moving average could signal path to $150,000 Bitcoin has consistently held above its 50-week moving average since March 2023. Each time the market has attempted to break below, buyers have quickly stepped in, keeping the uptrend intact.
This moving average has become a key indicator defining Bitcoin’s broader bullish structure. As long as price remains above it, the focus potentially stays on new record highs, with the next major target projected between 140,000 and 150,000.
This outlook aligns with MicroStrategy co-founder Michael Saylor, who expects Bitcoin to reach $150,000 by the end of 2025. He described 2025 as the most transformative year yet for the digital-asset industry. According to Saylor, the $150,000 target also reflects the consensus among equity analysts covering both MicroStrategy and the broader Bitcoin ecosystem.
GBPNZD BUY!!Targeted an orderblock on the daily, price reacted nicely and is about to continue its rally to the upside

EURUSD BUY!!Price reacted inside a 2hrly breakerblock , then created clear a break of the last height , anticipating price to come back into the orderblock below before moving to target.


When Fundamentals Mislead — Only the Chart Tells the TruthGold Analysis – Special Weekly & Monthly Closing Edition
This report combines daily, weekly, and monthly charts to look beyond short-term noise — connecting technical, economic, and geopolitical factors for a broader perspective.
Economic & Geopolitical Highlights
1. Fed Rate Cut (-25 bps) — Neutral
The move was fully priced in; gold showed no bullish response.
2. Jerome Powell’s Press Conference — Bearish
He noted that a December rate cut is “no longer guaranteed,” cutting odds from 90% to 60%, weighing on gold.
3. Trump–Xi Meeting — Bearish
Talks were commercially positive, signaling tariff relief — reducing safe-haven demand.
4. Trump’s Comments on Nuclear Tests — Mildly Bullish
Even verbal tension keeps geopolitical uncertainty alive in the background.
Hot Topics Still on the Table:
Trump–Putin meeting in Hungary
Sanctions on Russian oil firms
New U.S. tariffs
U.S. government shutdown updates
In short — fundamentals remain highly unstable and reactive.
As I posted earlier on X:
“When Fundamentals Mislead — Only the Chart Tells the Truth.”
So, let’s see what the truthful chart has to say
Technical Analysis – Daily Chart
Current price: $4012
Gold trades below the 10-EMA ($4042) and 20-EMA ($4023) — both acting as near-term resistance.
The metal has stayed under the 10-EMA since Tuesday, Oct 21, repeatedly failing to reclaim it despite several intraday attempts.
Even the brief contact with the 20-EMA on Monday was rejected quickly, sending price lower again.
For now, gold is trying to retest the 20-EMA (4023).
The key question:
Will it manage to reclaim it, or is it preparing to visit the 50-EMA near $3852 instead?
Using Fibonacci retracements, potential correction zones appear between 3831–3701,
while Fibonacci expansions suggest 3785–3728 — roughly the same area.
These aren’t distant targets for gold, which has recently dropped nearly $400 in a single day — reminding us that “what flies too high often falls faster.”
Weekly Chart
10-EMA Support: $3870
20-EMA Support: $3670
The broader trend shows a retest of major support after a long bullish stretch.
Monthly Chart
High: $4381
Low: $3819
Range: $562
Midpoint (Key Pivot): $4100
October’s close will define the year-end bias:
Above 4100 → bullish continuation possible
Below 4100 → opens room for a deeper correction toward 3830–3700
As of now, gold is trying to hold above $4000, after hitting a weekly low at $3886 on Tuesday.
Support & Resistance Levels
Resistance:
4023 – 4030 – 4042 – 4100 – 4121 – 4144 – 4161 – 4381
Support:
3990 – 3961 – 3914 – 3886 – 3843 – 3831 – 3785 – 3728 – 3701 – 3670 – 3645
Trader’s Note – Before the Weekly & Monthly Close
Avoid emotional trades before the weekend or a major monthly close.
Long positions: watch 4040–4100 as a heavy resistance cluster.
Short positions: trail profits near 3870–3830.
Print these levels and keep them beside your screen — risk management matters more than prediction.
Disclaimer:
This analysis is for educational and informational purposes only and does not constitute trading advice.
Market conditions can change rapidly with new data or headlines.

$EUGDPQQ -Europe GDP (Q3/2025)ECONOMICS:EUGDPQQ
Q3/2025 +0.2%
source: EUROSTAT
- The Eurozone economy expanded by 0.2% quarter-on-quarter in Q3 2025,
up from 0.1% in Q2 and slightly above market expectations of 0.1%, according to a flash estimate.
France grew 0.5%, exceeding expectations of 0.2%, driven by a sharp rise in exports, while Spain remained the best performer among the bloc’s largest economies, expanding 0.6% as expected, supported by strong household consumption and fixed investment.
Meanwhile, Germany stagnated due to a decline in exports, and Italy stalled, with the industrial sector contracting and services showing no growth.
On an annual basis, Eurozone GDP rose 1.3%, above expectations of 1.2%.
The better-than-expected figures ease pressure on the ECB to cut interest rates in the near term, supporting the view that the economy remains resilient despite geopolitical tensions and trade policy uncertainty.

$EUINTR -ECB Holds Rate at 2.15% (October/2025)ECONOMICS:EUINTR 2.15%
October/2025
source: European Central Bank
- The ECB kept interest rates unchanged for the 3rd meeting,
reflecting confidence in the eurozone’s economic resilience and continued easing of inflationary pressures.
In her remarks after the meeting, ECB President Lagarde emphasized that the ECB is “in a good place” and remains committed to taking all necessary actions to preserve that stability.

Silver bull will try to throw you off, but long term healthyA pause that could refresh might be warranted in silver and gold.
I am still optimistic for precious metals long term.
Silver is still undervalued based on historical metrics and money supply.
I worry about the rise in metals and what it implies for the broad stock market indices.

#BTCUSDT(BITCOIN): Swing Buy, Price Heading Towards Previous HH!Bitcoin is nearing a previous high of 126K. As of the latest data, it trades around 112K, with a 24-hour volume of $38 billion and a market capitalisation of $2.1 trillion. However, before reaching that level, it’s likely to correct towards our entry zone between 108K and 110K. This level is significant because we anticipate a substantial increase in market volume. Historical data shows that similar corrections have led to a 15–20% increase in trading activity.
On-chain metrics indicate a 7% rise in active wallets over the past week, and institutional inflows totalled approximately $1.3 billion in the last seven days. The Bitcoin dominance index currently sits at 54%, suggesting continued interest despite broader market fluctuations.
This short-term view allows us to observe the price accumulating and on the verge of distribution. Based on your trading style, you can select one of three targets:
- Target 1: 118K (conservative)
- Target 2: 122K (moderate)
- Target 3: 126K (aggressive)
We wish you the best of luck and trade safely. If you find our work helpful, please like and comment on our ideas.
Team Setupsfx_

S&P 500 Index Showing Weakness – Correction Ahead?Over the past seven days, the S&P 500 index( SP:SPX ) has been on a bullish run, frequently hitting new all-time highs. However, in the last two or three weeks, it's been influenced by the ongoing tariff tensions between the U.S. and China .
Let's look at the latest news about the S&P 500 index :
The IMF has flagged that market valuations might be a bit high, hinting at possible corrections. Plus, there's been a fresh look at how well China’s sticking to the 2020 trade deal, and on top of that, a new trade agreement in Southeast Asia is in the mix. So that’s the quick rundown!
Right now, if we look at the S&P 500 on a 1-hour timeframe, the index is near its Resistance lines and has lost its uptrend line , which is a sign of weakening momentum .
We also saw a Shooting Star Candlestick pattern form in the last few hours with good volume, adding credibility to the potential for a pullback .
From an Elliott Wave standpoint, it seems the S&P 500 has completed its wave 3, and we might see a wave 4 correction in the coming hours or days.
There's a noticeable Negative Regular Divergence(RD-) between the recent tops , and even on the daily timeframe, there's a divergence signaling potential weakness.
I expect the S&P 500 could drop at least to its Support line , around the $6,857 .
Note: The cryptocurrency market, and especially Bitcoin , has been highly correlated with the S&P 500 index these weeks, and a possible correction in this index could lead to a correction in this market.
Please respect each other's ideas and express them politely if you agree or disagree.
S&P 500 Index Analyze (SPX500USD), 1-hour time frame.
Be sure to follow the updated ideas.
Do not forget to put a Stop loss for your positions (For every position you want to open).
Please follow your strategy and updates; this is just my Idea, and I will gladly see your ideas in this post.
Please do not forget the ✅' like'✅ button 🙏😊 & Share it with your friends; thanks, and Trade safe.

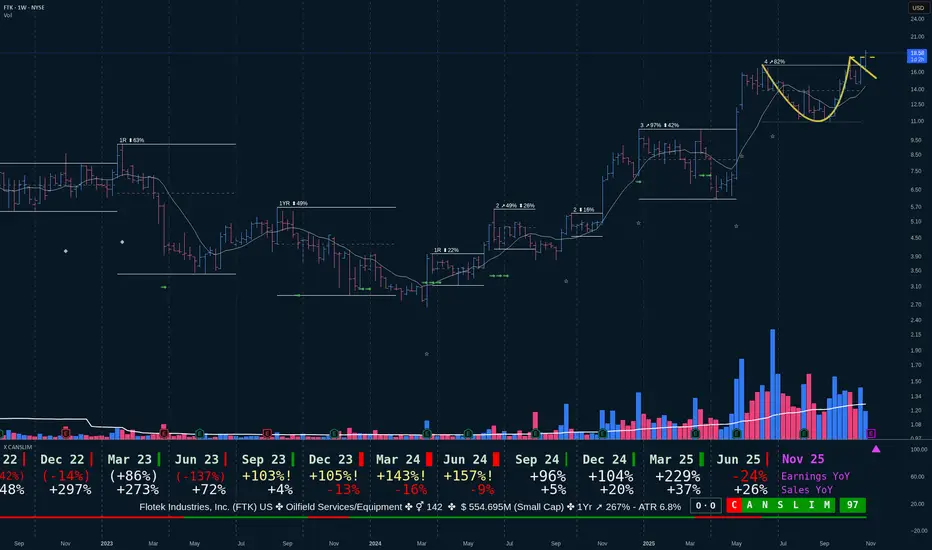
FTK is clearing a Cup with Handle baseKey points at the time of writing.
✣ Market
Cycle : Bull market cycle since June 2025
Direction: Up 100%
✣ Fundamentals.
Earnings somewhat mixed with a tendency to improve this year.
Institutional ratio is of 3.8 Buyers for 1 seller TTM with a ownership of 10.9%
✣ Technicals.
Clearing a Cup with Handle pattern.
Stock at base 4 is recent rally
TTM Performance is xx%
✣ Events / News
Earnings due next week !
Despite not being CANSLIM qualified it's clearing current base 4 ahead of earnings next week!
I expect a rise in price if there is some follow through in the coming days and most important if next week earning confirm the recent trend.
Soybeans Surge on Thin Ice: Lessons from 2019Soybean prices have surged nearly 8% in two weeks, driven by renewed US-China trade tensions. While this looks like a familiar, event-driven rally, the fundamentals tell a different story.
Conflicting Weak Fundamentals
China has not purchased any US soybeans for the 2025/26 marketing year. In 2024/25, Chinese buying stalled after May. That’s unusual given that the prior year saw over 500,000 tons of late-season sales. The slowdown dropped China’s share of total US soybean commitments to 45% from 55%, the lowest since 2018.
Source – Reuters
That matters because 2018 marked the last time soybeans became a trade weapon. Back then, US soybean exports fell 18% from 2017/18 to 2018/19 despite record production. Exports recovered briefly in 2020-21 but have since declined again. If history rhymes, the 2025 conflict could have longer-term consequences for US producers and exporters.
The puzzle is that prices have climbed despite worsening fundamentals. Futures rose after the latest escalation, hinting that traders may be pricing in an eventual resolution. If tensions ease before the seasonal export peak over the next two months, demand could lift prices further. If not, the current rally may prove unsustainable. The key uncertainty lies in timing - whether a diplomatic thaw comes soon enough to coincide with US export strength.
Source – Kansas City Fed
Performance and Parallels with 2019
The structure of this year’s rally mirrors the 2019 pattern. Then, too, optimism around US-China negotiations drove soybean futures higher. On 13 December 2019, as the Phase-One trade deal was announced, CBOT soybean futures rallied about 9.8% for the month. That uptrend persisted until the onset of COVID-19, which derailed demand and disrupted logistics, preventing the expected rebound in US exports.
The technical setup also echoes that period. In both 2019 and 2025, the Relative Strength Index (RSI) crossed into overbought territory above 70-a rare signal under normal conditions. Between 2020 and 2022, RSI readings were inflated by one-off global shocks. In contrast, the 2019 and 2025 spikes both stem from optimism around de-escalation, underscoring how trade détente tends to trigger strong momentum buying.
Today, market sentiment again hinges on reports that China may resume US soybean purchases. Investors are reacting to statements and commentary including remarks from industry figures suggesting Beijing could pivot back toward US supply as signs that tariffs or import restrictions may soften. If these expectations materialize, the rally could extend into early 2026, though the fundamental picture remains weak.
Historical Trade Example
To illustrate how optimism-driven price spikes have historically translated into trade outcomes, consider the 2019 example.
A trader buying one CBOT soybean futures contract (5,000 bushels) at $8.70 per bushel in early December and exiting at $9.50 in early January would have captured a 9% gain.
Entry: 870 cents/bushel
Exit: 950 cents/bushel
Profit/Loss: 80 cents/bushel = USD 0.8/bushel
Each contract of Soybean futures provides exposure to 5000 bushels:
Profit/Loss per Contract = 0.8 x 5000 = USD 4,000
Traders can express the same view using CME Micro Soybean Futures, which provide exposure to one-tenth of the standard contract’s notional value and require lower margin.
The 2025 setup resembles that pattern. If de-escalation signs strengthen into year-end, a similar short-term momentum trade could play out. However, if diplomatic talks stall or China delays purchases, prices could quickly retrace.
The recent rally has also occurred on low trading volume, with limited activity during the upward move and higher volume concentrated near resistance levels. Additionally, the price action around these resistance levels shows long wicks, suggesting a failed breakout and indicating weak momentum.
In essence, this rally is speculative optimism priced into a weak fundamental base. For traders, it is a short-duration opportunity with defined risk: the thesis hinges on improved trade headlines within the next two months. For producers and longer-term investors, the focus should remain on export commitments and Chinese buying patterns rather than short-lived technical surges.
History suggests that while geopolitical relief rallies can deliver sharp gains, they often fade once the narrative loses momentum. The 2025 soybean rally may yet prove another example of that cycle - strong on hope, but fragile on fundamentals.
This content is sponsored.
MARKET DATA
CME Real-time Market Data helps identify trading set-ups and express market views better. If you have futures in your trading portfolio, you can check out on CME Group data plans available that suit your trading needs tradingview.com/cme .
DISCLAIMER
This case study is for educational purposes only and does not constitute investment recommendations or advice. Nor are they used to promote any specific products, or services.
Trading or investment ideas cited here are for illustration only, as an integral part of a case study to demonstrate the fundamental concepts in risk management or trading under the market scenarios being discussed. Please read the FULL DISCLAIMER the link to which is provided in our profile description.

Bitcoin Going to Hell- SELL EVERYTHING NOWlook at the track record of bitcoin whenever it reaches an All time high,
a correction of 80% is to be expected at least
good luck

GBPUSD Extends Bearish Momentum After Structure BreakGBPUSD remains under bearish pressure after a clear break of the structure from the 1H resistance area. Price action shows a potential short-term retest before continuing lower toward the support zone, signaling sellers’ dominance in the market.
Key Levels:
Sell Entry: 1.3195
Take Profit: 1.3129
Stop Loss: 1.3242
Reasoning:
Technically, the pair has confirmed a downside structure break with consistent lower highs, indicating momentum in favor of sellers. The 1H chart shows price rejecting the resistance area and forming a bearish continuation setup.
Fundamentally, the British Pound remains weak amid concerns over slowing UK growth and firm U.S. dollar demand supported by steady Treasury yields and hawkish Federal Reserve outlook. This continues to weigh on GBP/USD sentiment.
Disclaimer:
This analysis is for educational purposes only and not financial advice. Always manage risk and follow your own trading plan before executing any trade.

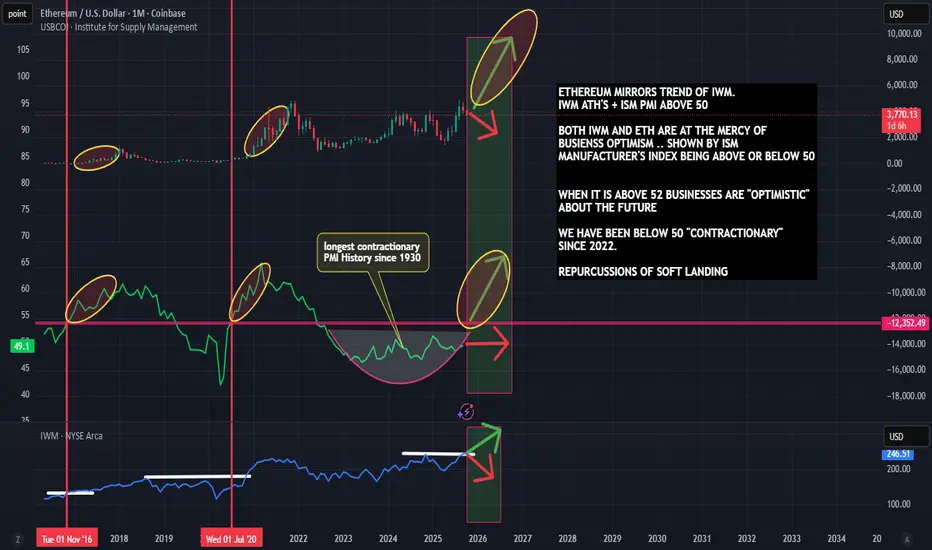
Ethereum Moves with The Business Cycle and Small Cap StocksThere's still hope for Ethereum and Altcoins into 2026
Why Altcoins Never Caught the Bull: The Missing Piece in the Crypto Cycle
Bitcoin, gold, and the S&P 500 (SPY) have long proven their close relationship with M2 money supply — when liquidity expands, they rise.
But Ethereum and the broader altcoin market play by a slightly different rulebook. They don’t just need liquidity… they need optimism.
Specifically, expanding small-cap stocks and a strong business sentiment environment.
Higher-risk assets — from growth stocks to altcoins — thrive when the economy believes in itself. And throughout this entire crypto cycle, that optimism never fully materialized.
Despite strong narratives, legal wins, and technological progress, altcoin expansions never sustained. Why? Because the business cycle is the true king of risk-taking.
🧭 Where to Watch: IWM & PMI
Two of the best gauges for this optimism are:
IWM (Russell 2000) – tracks small-cap stocks and risk appetite
ISM PMI – measures manufacturing activity and future order expectations
When the PMI is above 52, the economy is in expansion mode — and that’s historically when IWM hits new highs.
Interestingly, Ethereum has mirrored IWM’s trend, even showing outperformance when IWM pushes into all-time highs. That means ETH’s bullish potential could be closely tied to the next leg of small-cap and business expansion.
💡 The Takeaway
In the past, money supply (M2) and business optimism rose together.
Now, they’ve decoupled — giving us a clearer way to separate which catalyst drives which asset.
So, the big question:
👉 If business sentiment improves in 2026… does Ethereum finally get its real bull run?
Only time — and the next PMI reading — will tell.
WM Technology, Inc. (MAPS)The stock formed a bottom as a Symmetrical triangle, and took a long time for Accumulation before launching to very high stations above.
At the same time, the bottom is a rounded bottom aiming for targets between $7 and $8.35.
The launch of the stock is very, very close.
Highly & Strongly recommended for BUY 💥 💥💥💥💥💥

XAUUSD - High-Risk Scalp Setup Near Key Support
Gold is testing a defined technical buy zone on the chart, presenting a potential long scalp opportunity. Key Considerations:
· Strategy: Aggressive, fast scalp targeting a bounce from this support level.
· Risk Factors: High sensitivity to geopolitical headlines (noted: Trump). Today is Friday, increasing volatility and potential for unpredictable price action.
· Risk Management: A break and close below this immediate support zone would invalidate the bullish scalp thesis.
Trade with caution and strict risk controls

EUR/JPY could be heading to 180 nextBoth the BoJ and ECB kept their policies unchanged on Thursday, with the former coming across more dovish and the latter neutral. The USD/JPY surged to near 154.50, reaching its best level since February. The EUR/JPY meanwhile broke to a new high for the year and is now on the verge of extending those gains to 180.00. Can it get there?
Well I wouldn't bet against it. We had stronger Eurozone GDP data today which underscored the ECB's "good place" rhetoric.
“From a monetary-policy point of view, we are in a good place,” President Christine Lagarde said at the ECB presser. “Is it a fixed good place? No, but we will do whatever is needed to make sure that we stay in a good place.”
Key levels are shown on the chart, but the long and short of it is this: the path of least resistance remains to the upside.
By Fawad Razaqzada, market analyst with FOREX.com

Ethereum Game Plan - TDLRKZ MODELEthereum Game Plan - TDLRKZ MODEL
📊 Market Sentiment
On 29/10, the FED lowered rates by 25BPS, as expected. However, Powell’s comments introduced uncertainty regarding another cut in December, stating that further policy moves depend on incoming data.
Interestingly, one FED member dissented, preferring no cut this cycle — a shift from September when all members supported easing.
Following the statement, rate-cut expectations dropped from 95% to 68%, prompting traders to take profits and hedge, creating a short-term bearish sentiment across markets.
Despite this, the mid-to-long term outlook remains bullish, given the broader liquidity cycle and easing policy bias.
📈 Technical Analysis
Ethereum is currently accumulating inside a well-defined range.
Price failed to sustain above the $4950 range high and has started retracing toward the HTF bullish trendline, a potential reaction zone aligning with prior liquidity pools and confluences.
If price holds around this zone, ETH could seek the range high again once momentum returns.
📘 Model in Use – Trendline Deviation with HTF LR into Key Zone (TDLRKZ Model)
This model identifies setups where price deviates from HTF trendlines while interacting with liquidity zones and key structural levels.
The goal is to align HTF context with LTF confirmation for high-probability trend continuation setups.
Model Steps:
1️⃣ Identify the HTF trend direction and only trade in that direction.
2️⃣ Mark the HTF bullish trendline supporting price.
3️⃣ Spot HTF Key Zones likely to act as reaction areas.
4️⃣ Locate nearby liquidity pools or order concentrations.
5️⃣ Wait for confluence: when all align, confirm with a 4H market structure break for entry.
📌 Game Plan
Looking for ETH to retrace into $3350 and reject from that level.
If a 4H break of structure occurs and daily candle closes above $3350, this will trigger a long-biased setup.
🎯 Setup Trigger
→ 4H structure break after tagging $3350
→ Daily close above $3350
📋 Trade Management
→ Entry: After confirmation above $3350
→ Stop Loss: Below swing low that caused 4H break of structure
→ Targets:
TP1: $4150 (EQ)
TP2: $4550
TP3: $4950 (Range high)
→ Move SL to breakeven after TP1 is reached.
💬 Check my Substack for deeper macro and sentimental breakdowns — free subscriptions are open.
⚠️ Disclaimer: This content is for educational purposes only and does not constitute financial advice. Always DYOR before trading.

USDJPY constantly reaches its support and resistance USDJPY constantly reaches its support and resistance now its time to reached its support level that means shorts on usdjpy always put stoploss

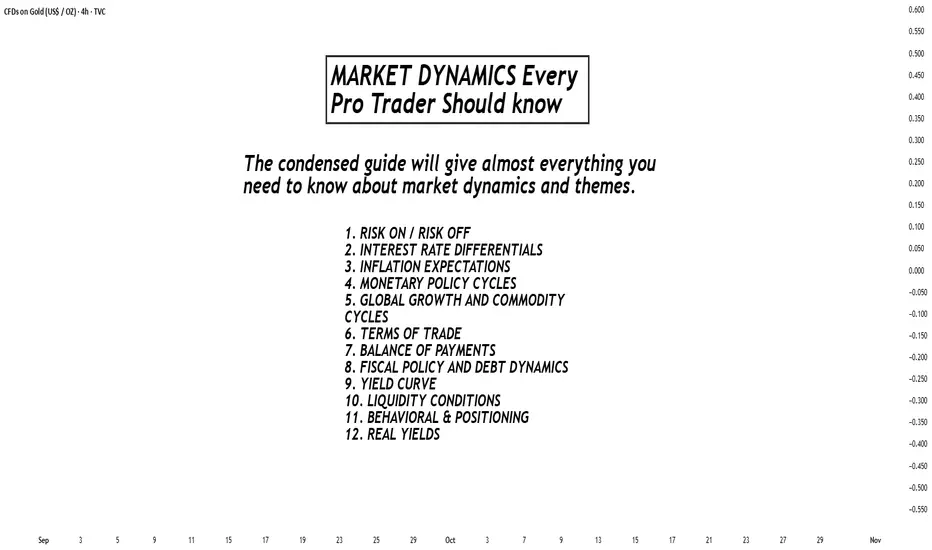
Markets Dynamics Every Pro Trader Should KnowMarkets move based on fundamental forces that shape pro traders behavior, capital flows, and asset valuations. I will cover the most important concepts that drive market behavior across all asset classes and are fundamental to professional traders.
RISK-ON / RISK-OFF DYNAMICS
The most important concept is the oscillation between risk-on and risk-off sentiment—investor willingness to take on risk in pursuit of returns.
Risk-On: Equities, commodities, high-yield bonds, and risk-sensitive currencies like AUD, NZD rise.
Typical triggers are: positive economic data, easy central bank policies, geopolitical stability.
Risk-Off: Safe-haven assets : USD, JPY, CHF, U.S. Treasuries, gold strengthen. This happens as money managers and investors prioritize capital preservation.
Typical triggers: negative economic data, geopolitical tensions, financial crises.
Why USD strengthens during risk-off:
USD has a global reserve currency status, and that structurally creates demand; deepest treasury market for holding capital; trillions in global debt denominated in USD.
Why JPY strengthens during risk-off:
Carry trade unwinding (investors close positions by buying back yen); Japanese institutions bring back home trillions in foreign assets during crises.
INTEREST RATE DIFFERENTIALS
Capital moves toward countries offering higher real interest rates (real rates = nominal rates minus inflation). This creates currency trends over weeks, months, and years.
Higher interest rates leads to higher bond yields, increasing capital inflows, resulting in currency appreciates
The Carry Trade: Borrow in low-yield currencies (JPY, CHF), invest in high-yield currencies (AUD, NZD), profit from interest rate differential. Carry trades unwind strongly during risk-off times due to leverage and crowded positioning.
INFLATION EXPECTATIONS
Markets trade based on where they expect inflation to be in the future, not current readings. Rising inflation expectations means central banks are likely to tighten policy, hence Bond yields rise and that may lead to currency strengthening initially.
Key metrics: CPI (Consumer Price Index), PCE, core vs. headline inflation, break-even inflation from TIPS spreads.
MONETARY POLICY CYCLES
Central banks are the most powerful players in financial markets. They control interest rates and balance sheet operations.
Tightening Cycle (hiking rates, quantitative tightening): Strengthens currency, negative for equities, bond prices fall, slows economic activity.
Easing Cycle (cutting rates, QE): Weakens currency, positive for equities, bond prices rise, stimulates economic activity.
GLOBAL GROWTH AND COMMODITY CYCLES
Strong global growth means higher demand for energy/metals = Commodity prices rise = Strengthens commodity currencies (AUD, CAD, NOK, BRL).
Key indicators to watch: Global PMIs, global trade data, commodity indices, China growth indicators.
TERMS OF TRADE
When a country's export prices rise more than its import prices, local income increases and currency typically strengthens. Example: Australia's AUD strengthens when iron ore and coal prices rise.
BALANCE OF PAYMENTS
Current account measures trade balance, income flows, and transfers.
Surplus (exports > imports): This accumulates foreign reserves, and generally supports currency.
Deficit (imports > exports): This requires capital inflows to fund deficit, and can pressure currency lower.
FISCAL POLICY AND DEBT DYNAMICS
Government spending and taxation are another dynamic that can influence economic growth and inflation.
Expansionary Policy: Higher spending or lower taxes = short-term growth boost = can increase inflation = increases deficit.
Contractionary Policy: Lower spending or higher taxes (this is know as “austerity”) = slows growth =reduces inflation = improves budget balance.
YIELD CURVE
One of the most important dynamics: it plots interest rates of government bonds across different maturities (2-year, 10-year, 30-year).
Normal/Steep Curve: Growth and inflation optimism, typically supports risk-on sentiment.
Flat Curve: Uncertainty about future growth, usually in late-cycle economies.
Inverted Curve (short rates > long rates): Recession warning. markets expect the central bank to cut rates due to the slowing economy. The inverted curve has preceded almost every U.S. recession in the past half decade.
LIQUIDITY CONDITIONS
Liquidity means availability of credit in the financial system.
High Liquidity: Credit is easy and cheap, supports asset prices, enhances risk appetite. Sources of ample liquidity are central bank QE, low interest rates.
Tight liquidity: Credit becomes scarce and expensive, forces deleveraging, triggers risk-off sentiment. Reasons that can lead to low liquidity are central bank QT, rising rates, banking stress.
BEHAVIORAL & POSITIONING DYNAMICS
When too many investors are positioned the same way (crowded trade), small sentiment changes can trigger strong reversals. Extreme bullishness can signal sell opportunities when everyone is fully invested. Extreme bearishness can signal buy opportunities when selling pressure is exhausted.
Key indicators to measure market positioning are: CFTC positioning data, VIX (volatility index), put/call ratios, fund flow data.
REAL YIELDS
Real Yield = Nominal Yield - Expected Inflation
Rising Real Yields: Stronger currency (attracts foreign capital), weaker gold (higher opportunity cost), pressure on growth stocks.
Falling Real Yields: Weaker currency, stronger gold, support for growth/tech equities.
Real yields drive cross-asset flows through opportunity cost (risk-free alternative return), discount rate changes (affects stock valuations), and dollar funding (global capital flows).
BOTTOM-LINE AND DYNAMICS INTERACTIONS
Markets are driven by multiple forces simultaneously. The strongest moves occur when multiple dynamics align in the same direction. Identify the dominant theme (inflation? growth? central bank policy?), understand asset class implications, look for alignment, and monitor for shifts.
Example Scenario - Fed Aggressive Tightening: Fed raises rates and begins QT → U.S. yields rise → Rising real yields → Tighter liquidity → Risk-off sentiment → USD strengthens, AUD/NZD/EM weaken, gold falls, growth stocks underperform.
Success comes from identifying the dominant market theme, understanding implications across asset classes, looking for alignment when multiple dynamics point in the same direction, and monitoring for theme shifts that can reverse the entire market structure quickly.
If you have questions or need any explanation don't hesitate to drop a comment.