Boring Trading Builds Real WealthHollywood has lied to everyone about financial markets. We expect shouting, broken keyboards, and constant adrenaline. Real professional trading looks nothing like that. It looks like a quiet office job. True consistency is actually quite boring.
If you feel a rush of excitement when you click the buy button, you are in danger. You have confused a business with a casino. The market charges a very high price for entertainment.
Recognize the Gambling Mindset
Most traders do not fail because they lack technical knowledge. They fail because they cannot handle their own chemistry. Dopamine is the enemy of your bank account.
Check yourself for these red flags:
- Your heart rate increases when entering a trade.
- You feel a need to recover losses immediately.
- You enter the market just to feel involved.
- If you recognize these signs, stop immediately. You are providing liquidity for the professionals.
The Art of Doing Nothing
There is a dangerous myth that you must always be in a trade to make money. This is false. Cash is a valid trading position. It protects your capital for the right moment.
Amateurs try to catch every market swing. They fear missing out on a move more than they fear losing money. This is FOMO. It forces you to buy at the top and sell at the bottom.
Sniper Versus Machine Gunner
Imagine a machine gunner firing wildly into the dark. They waste ammunition and reveal their position. Now imagine a sniper. They wait for days for a single perfect target.
Professional trading requires the patience of a sniper:
- Wait for the setup to come to you.
- Ignore price action that does not match your plan.
- Preserve your capital for high-probability scenarios.
- If a chart only matches 80 percent of your criteria, you must pass. Missing a trade is not a loss. It is discipline.
Process Over Outcome
The market is chaotic and infinite. You cannot control price action. You can only control your reaction to it. Discipline means following your rules when every emotion tells you to do the opposite.
Shift your focus entirely. Stop thinking about the money you want to make. Focus only on executing your system perfectly. Profit is just the byproduct of a boring, repetitive, and well-executed routine.
Boredom is your best indicator of success.
Wave Analysis

Unlocking Altseason: Chart Signals You Can't IgnoreAltseason without myths: what actually shows up on charts before alts go crazy
Everyone loves to say “altseason is coming” the same way kids say “summer is coming” in March. Feels good, zero responsibility.
But altseason isn’t magic. It’s just money rotating. And that rotation leaves fingerprints on the charts way before your favorite microcap does +500%.
Let me walk you through the main conditions I usually want to see before I start taking alt setups seriously – not memes, not hopium, just price.
1. King Bitcoin does his move first
Healthy altseasons rarely start from flat Bitcoin.
Typical pattern:
- First, a strong impulsive move up on BTC
- After that move, BTC stops trending and starts chopping in a range
- Volatility cools down, candles get smaller, volume drops
TL;DR: Big boys rode BTC, locked in chunky profits, and now their fresh capital is looking for higher beta plays. That’s when alts start feeling “lighter”.
If BTC is nuking or making fresh parabolic highs every day, alts usually just get dragged around like bags on a train.
2. BTC dominance stops climbing and starts bleeding
Open BTC.D (Bitcoin dominance) and zoom out.
Before most big alt runs, I usually see:
- A clear uptrend in dominance while BTC is running
- Then a topping structure: double top, lower high, or a fake breakout above the previous high
- And then – the key part – a confirmed breakdown with lower lows
That’s literally money leaving BTC relative to alts.
No need to overcomplicate:
Rising dominance – market respects Bitcoin.
Falling dominance – market starts gambling on the side quests.
3. ETH vs BTC wakes up
ETHBTC is my canary in the coal mine.
If ETH can’t even beat BTC, why should I expect your random GameFi coin to do it?
Before many altseasons I’ve watched:
- ETHBTC prints a base or higher low
- Breaks local resistance
- Starts grinding up, even if slowly
ETH often leads the rotation. When this pair wakes up, liquidity is starting to accept “more risk”.
4. Total alt market cap breaks structure
Open TOTAL2 or TOTAL3 – that’s your x-ray of altcoins as a whole.
What I like to see:
- A clear downtrend turning into a sideways accumulation range
- Higher lows forming under a big horizontal resistance
- Breakout of that resistance with expanding volume
That’s not your random lucky pump – that’s the whole sector getting repriced.
5. Volume rotation: BTC quiet, alts noisy
Check the volume bars:
- BTC: volume fades while it ranges
- Major alts: volume spikes on green days, pullbacks on lower volume
That’s exactly what “rotation” looks like. Money doesn’t appear from nowhere – it walks from chart to chart.
Maybe I’m wrong, but I think “altseason” is mostly a marketing word influencers use when they ran out of Bitcoin content. On charts it’s just a sequence:
BTC pumps → BTC chills → dominance tops → ETHBTC turns → alt market cap breaks out → volume rotates.
Last nuance: don’t try to guess the exact start like it’s New Year’s midnight. Focus on conditions, not dates. When several of these signals line up, I start hunting alt setups. When they disappear, I stop dreaming about 50x and go back to trading what the market actually gives.
In the end, altseason is just greed with a chart pattern. Learn to spot the pattern – and the greed will find you on its own.

Best Trend Following Strategies for Gold. XAUUSD Day Trading
The recent bull run on Gold is a perfect example of a strong trending market. For traders, such sentiment always provides very profitable trading opportunities.
In this article, I will share 3 best trend-following strategies for day trading Gold that showed extremely high performance the last 3 years.
So what I did, I back tested 4H/1H time frame since the middle of February of 2023 when the bull market started.
I tested various strategies: price action, SMC, multiple indicators, candlestick patterns; and I was looking for the ones that showed the highest accuracy and profitability.
1. Moving Averages Crossover
The first strategy that showed a very high performance was based on a crossover of 2 moving averages.
Exponential MA with 30 length.
Simple MA with 9 length.
For entry signal, Simple MA should cross Exponential MA from the downside and a candle should close above both MAs'.
Stop loss will b e below the closest horizontal support.
The setup is considered to be profitable if, after the entry, the price moved up at least by pips distance from entry to stop loss.
13 setups we spotted.
9 of them were profitable.
Total winning rate is 69%.
2. Trend-Following Patterns
The second strategy that showed a very high performance was based on classic price action patterns.
I was looking for bullish patterns like bullish flag, falling wedge, horizontal range, double bottom, head and shoulders, ascending triangle, cup & handle.
Bullish confirmation was a breakout and a candle close above a neckline of the pattern.
The pattern is considered to be losing if after the breakout of the neckline, the price dropped below its lows.
The pattern is considered to be profitable if, after the entry, the price moved up at least by pips distance from entry to stop loss.
I found and tested 37 bullish patterns.
According to the rules that I described above, 31 pattern turned out to be profitable.
That gives 83% winning rate.
3. Break of Structure (BoS)
The Break of Structure strategy is very old and based on breakouts of current highs.
In a bullish trend, after the price violates the levels of a current Higher High HH, a bullish continuation is expected.
A long trade is opened after the candle closes above HH or on a retest.
With such a strategy, Stop Loss is lying below the last Higher Low HL.
The setup is considered to be profitable if, after the entry, the price moved up at least by pips distance from entry to stop loss
For the same period, I identified 21 Breaks of Structure.
According to the rules, 18 setups were profitable.
Total win rate is 85%.
Remember that you should not overestimate the performance of these strategies. They work perfectly only in times of a strong bullish market. Such periods are extremely rare.
However, once you see a strong bullish season, these strategies will help you to get maximum from it.
❤️Please, support my work with like, thank you!❤️
I am part of Trade Nation's Influencer program and receive a monthly fee for using their TradingView charts in my analysis.

Losing Trades deep dive talk. Introduction to GOLD.GBPJPY short: wishful trading, no MS, no fib, calling the top.
USDCHF long: tight SL, fibs with different biases, choppy structure, bigger fib in direction of the opened position.
USDJPY long: pivotal trading, ranging, consolidation, SL to 120% of biggest candle in the range or to a closest swing.
USTEC long: no engulfing confirmation, tight SL, no retracement (pullback), low confidence in the trade.

My Kind of Trades.My work is focused exclusively on the long-term structure of financial markets.
When markets are viewed through this lens, a key truth becomes clear: markets are not chaotic — they follow structure and repeatable patterns. This approach significantly reduces the noise that dominates most financial commentary: short-term price fluctuations, emotionally driven moves, and surface-level buy/sell signals that lack broader context.
This is deep, contextual analysis — understanding market structure before execution, not reacting to price after the fact.
Structural moves of this nature occur across all markets. One of the clearest examples of why market structure matters is during stock market crashes. We reference extended work analyzing both the Dot-com Bubble and the Global Financial Crisis using long-term S&P 500 charts. Those full deep dives are published elsewhere and go beyond simply mapping crashes — they demonstrate how the two events were structurally linked and, most importantly, why they should have been expected.
Another referenced example includes the analysis of UK Oil prices from 1861 to 2026, again explored in detail elsewhere, showing how the same structural principles persist across centuries, asset classes, and market regimes.
The purpose here is not to reproduce those deep dives, but to underline a core principle: markets have structure — they are not driven by chaos, manipulation, or randomness.
This framework is applied across stocks, commodities, forex and cryptocurrencies.
For extended case studies and full structural breakdowns, this is done elsewhere, where the real analysis happens.
Check the bio for more.

Learning from the loosing trades! Continuation of the series.I study all my losing positions, including my first-ever trade made with a prop firm. Find out what my first losing position was and watch the video.
GBPAUD: not flipping the chart in a bearish trend, distorted fibs, failing to read market structure, poor CSFR.
GBPCHF: Cutting the winners short, SL to BE.
USTEC: no engulfing confirmation, flipping the chart to see the fib confirming entry more closely!
GBPNZD: Entered on a wrong fib, cognitive bias.
USDJPY: Fib < 50, late entry, tight SL, CSFR - poor.

Learning from the losses.Hello, in this series i am going over all my losing trades and study each case to become a better trader! Feel free to join me.
GU: CSFR - poor (candle:size:flow:ratio)
GU: impatience,
USDCHF: Fib less than 50, CSFR poor
GBPCHF: narrow focus, long in short market, calling the bottom
EURUSD: CSFR poor, no engulfing, 61.8 disrespected - last fib in bullish trend.

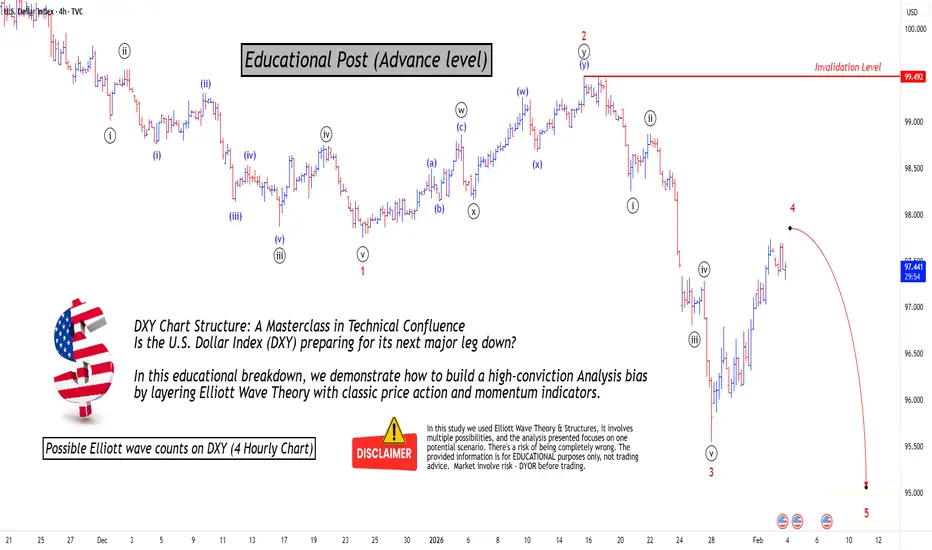
Mastering Technical:DXY Elliott Wave & Multi-Indicators AnalysisTechnical Analysis: DXY Bearish Confluence
This post serves as an educational guide on how various technical analysis tools converge to suggest a strong potential for a continued downtrend in the U.S. Dollar Index (DXY) on the 4-hour timeframe.
Elliott Wave Structure & Bearish Bias
The prevailing Elliott Wave count suggests the DXY is currently completing a corrective minor wave 4 rally within a larger five-wave impulse sequence to the downside. The market bias remains bearish, anticipating the onset of a significant minor wave 5 decline once the current wave 4 correction finishes.
Dow Theory & Price Action Confirmation
Dow Theory principles support the bearish outlook. The price action is clearly establishing a pattern of lower lows and lower highs, a classic signature of an active downtrend. The current rally (wave 4) is simply a higher low correction within this established structure, confirming the overall market direction is down.
Key Confluence Points for Resistance
Multiple technical indicators are clustering at a specific price zone, suggesting a high-probability area where the rally might reverse:
200 EMA Resistance: The price is trading below the 200-period Exponential Moving Average (EMA) on the 4-hour chart. This indicator is positioned just above the current price and is expected to provide significant dynamic resistance (a "hurdle") to the upside.
Fibonacci Retracement Alignment: The crucial 61.8% Fibonacci retracement level of the last major swing low is located very near the 200 EMA. This strong overlap of resistance levels increases the likelihood of a price reversal.
Divergence Analysis
Divergences between price and oscillators further reinforce the bearish sentiment:
Hidden Bearish Divergence: There is existing hidden bearish divergence present. This is a powerful trend-continuation signal that reinforces the expectation that sellers will soon regain control.
Absence of Bullish Signals: A key factor increasing conviction in the bearish bias is the lack of any bullish divergence seen yet on chart. The absence of this potential reversal signal suggests that a strong bullish bounce is not imminent.
Invalidation Level & Potential Targets
Defining risk and reward is essential in trading:
Invalidation Level: The bearish count is only valid as long as the price remains below the critical invalidation level marked at approximately 99.492
Potential Targets: Upon confirmation of the wave 4 top and the start of wave 5, the target for the decline is expected to be lower than the last swing lows (below the wave 3 termination point around 95.100).
I am not Sebi registered analyst. My studies are for educational purpose only.
Please Consult your financial advisor before trading or investing.
I am not responsible for any kinds of your profits and your losses.
Most investors treat trading as a hobby because they have a full-time job doing something else.
However, If you treat trading like a business, it will pay you like a business.
If you treat like a hobby, hobbies don't pay, they cost you...!
Hope this post is helpful to community
Thanks
RK💕
Disclaimer and Risk Warning.
The analysis and discussion provided on in.tradingview.com is intended for educational purposes only and should not be relied upon for trading decisions. RK_Chaarts is not an investment adviser and the information provided here should not be taken as professional investment advice. Before buying or selling any investments, securities, or precious metals, it is recommended that you conduct your own due diligence. RK_Chaarts does not share in your profits and will not take responsibility for any losses you may incur. So Please Consult your financial advisor before trading or investing.
Buy the Rumor and Sell The NewsMarkets move before information becomes official because positioning always precedes confirmation. By the time news is released, expectations are already priced in. “Buy the rumor” describes this positioning phase, where capital reallocates based on anticipation rather than facts.
Traders who act only on confirmation arrive when risk is highest and asymmetry is lowest.
Rumors form when uncertainty exists and narrative fills the gap. Expectations about events, data, upgrades, or macro decisions begin circulating long before outcomes are known. During this phase, liquidity is thin and positioning builds gradually. Price advances not because certainty exists, but because participants want exposure before clarity removes opportunity.
As the rumor spreads, price often trends cleanly. Pullbacks are shallow, momentum holds, and dips are bought quickly. This is not because the outcome is guaranteed, but because risk is perceived as acceptable relative to potential upside.
The danger appears near confirmation. When the news becomes official, uncertainty collapses. Everyone knows the outcome, and participation peaks. Liquidity increases sharply as late buyers enter and early participants begin exiting. This is why markets frequently stall, reverse, or distribute immediately after positive news. The trade was never about the event itself. It was about positioning ahead of it.
Selling after confirmation is not manipulation. It is inventory management. Capital that entered early needs liquidity to exit. News provides that liquidity. When expectations are fully priced, continuation requires new incentive, not old information.
The practical takeaway is not to trade headlines. It is to observe behavior before them. Watch how price reacts during anticipation. Strong trends with controlled pullbacks suggest accumulation. Choppy price with sharp spikes suggests distribution forming. When confirmation arrives, reassess rather than assume continuation.
“Buy the rumor” works because markets move on expectations and pause on certainty. Traders improve when they stop reacting to news and start reading how the market positions itself in advance. The edge lies in understanding when probability is expanding and when it has already been spent.

Learning form the losers!
GBPJPY - cutting winners short, struggling with confidence, market structure trade.
GBPJPY - calling the top, countertrend.
NZDUSD - FOMO trading. (not respecting the fib strucutre, candle:size:flow ratio sucks.
GBPUSD - mixing biases - Swing with daytrade, daytrade with scalping.

The times when price pretends to change the trendIn this chart, I want you to look at how price created a new higher high. Then upon retracement it went so deep to create a fake out. Yen pairs often behave like this. So take your time and go through the structure of price and you'll notice that a currency pair like this GBPJPY chart sometimes breaks into lower lows but fails to continue that low and change the trend.
The market requires a lot of observation. Clean all your indicators and just look at the chart. You'll realise you will start seeing certain patterns. Take note of these patterns and work on giving them context. After you get your context you can place back your indicators.

Commodities Don’t Move Together… They Take TurnsOne mistake I see a lot of traders make
they treat commodities like one big trade.
Gold, silver, oil, copper… same button, same mindset.
But commodities don’t move together.
They rotate.
Gold usually speaks first.
Not because growth is strong, but because confidence is changing. Liquidity shifts, risk perception shifts, and gold quietly reacts.
Silver comes next.
That’s when protection starts turning into opportunity. Volatility increases. Participation increases.
Then you see it in the industrial metals.
Copper, platinum, palladium. This is where demand stops being a theory and starts showing up on the chart.
Energy tends to move later.
By then, growth is obvious and inflation is no longer a surprise. Oil isn’t early. It’s confirmation.
Most traders wait for confirmation.
Few pay attention to the sequence.
The goal isn’t to predict the entire cycle.
It’s to recognize where we are inside it… and stop trading the wrong phase.
That alone filters out a lot of bad decisions.
⚠️ Disclaimer: This is not financial advice. Always do your own research and manage risk properly.
📚 Stick to your trading plan regarding entries, risk, and management.
Good luck! 🍀
All Strategies Are Good; If Managed Properly!
~Richard Nasr

RSI Indicator LIES! Untold Truth About Relative Strength Index
The Relative Strength Index (RSI ) is a classic technical indicator that is applied to identify the overbought and oversold states of the market.
While the RSI looks simple to use, there is one important element in it that many traders forget about: it's a lagging indicator . This means it reacts to past price movements rather than predicting future ones. This inherent lag can sometimes mislead traders, particularly when the markets are volatile or trade in a strong bullish/bearish trend.
In this article, we will discuss the situations when RSI indicator will lies to you. We will go through the instances when the indicator should not be relied and not used on, and I will explain to you the best strategy to apply RSI.
Relative Strength Index analyzes the price movements over a specific time period and displays a score between 0 and 100.
Generally, an RSI above 70 suggests an overbought condition, while an RSI below 30 suggests an oversold condition.
By itself, the overbought and overbought conditions give poor signals , simply because the market may remain in these conditions for a substantial period of time.
Take a look at a price action on GBPCHF. After the indicator showed the oversold condition, the pair dropped 150 pips lower before the reversal initiated.
So as an extra confirmation, traders prefer to look for RSI divergence - the situation when the price action and indicator move in the opposite direction.
Above is the example of RSI divergence:
Crude Oil formed a sequence of higher highs, while the indicator formed a higher high with a consequent lower high. That confirmed the overbought state of the market, and a bearish reversal followed.
However, only few knows that even a divergence will provide accurate signals only in some particular instances.
When you identified RSI divergence, make sure that it happened after a test of an important key level.
Historical structures increase the probability that the RSI divergence will accurately indicate the reversal.
Above is the example how RSI divergence gave a false signal on USDCAD.
However, the divergence that followed after a test of a key level, gave a strong bearish signal.
There are much better situations when RSI can be applied, but we will discuss later on, for now, the main conclusion is that
RSI Divergence beyond key levels most of the time will provide low accuracy signals.
But there is one particular case, when RSI divergence will give the worst , the most terrible signal.
In very rare situations, the market may trade in a strong bullish trend, in the uncharted territory, where there are no historical price levels.
In such cases, RSI bullish divergence will constantly lie , making retail traders short constantly and lose their money.
Here is what happens with Gold on a daily.
The market is trading in the uncharted territory, updated the All-Time Highs daily.
Even though there is a clear overbought state and a divergence,
the market keeps growing.
Only few knows, however, that even though RSI is considered to be a reversal, counter trend indicator, it can be applied for trend following trading.
On a daily time frame, after the price sets a new high, wait for a pullback to a key horizontal support.
Your bullish signal , will be a bearish divergence on an hourly time frame.
Here is how the price retested a support based on a previous ATH on Gold. After it approached a broken structure, we see a confirmed bearish divergence.
That gives a perfect trend-following signal to buy the market.
A strong bullish rally followed then.
RSI indicator is a very powerful tool, that many traders apply incorrectly.
When the market is trading in a strong trend, this indicator can be perfectly applied for following the trend, not going against that.
I hope that the cases that I described will help you not lose money, trading with Relative Strength Index.
❤️Please, support my work with like, thank you!❤️
I am part of Trade Nation's Influencer program and receive a monthly fee for using their TradingView charts in my analysis.

Gold, Inflation, and the money velocity correlation.Good day traders and investors,
The “you’ll own nothing and be happy” Prophecy, no. Prediction, no. Planning, yes. It means, you’ll be priced out and there is nothing you can do about it.
Central planning at it’s finest, or worst, depending on your point of view. Make no mistake, these moves by Gold are direct result of central planning. Nothing is accidental.
Golds unprecedented rise should scare you, even if you own some. Golds rise to me is screaming the next wave of inflation is coming and will likely be twice as powerful from the previous wave. The money velocity could be a conferential confirmation. Money velocity is the rate of money moving and changing hands in the economy. It’s generally a very good thing, and healthy robust economy should have a very high velocity. However, there can be instances where it can be fueled by inflation, so it can be deceptive and that’s not so good. It could be rising because of higher prices. The last couple years the velocity was stagnate and going sideway. Just recently it started to up tick, exactly like in 2020 with golds rise. The lower version of the velocity chart which is the rate of change annually that came out of 2020 was the highest ever in recorded history. This could prove to be good or bad thing. If it catches support and keeps going higher along with inflation, it will not be a goof thing. However if inflation does get back into control then it would not be bad, as it would show accelerated growth in the economy (likely not, at least for now).
It wasn’t until after Gold found a top and went sideways while consolidated that inflation really came in. The market needed time to absorbed what happened. It realized products were to cheap, to how much money was out there and inflation took it’s course. History could repeat over the next couple years IMO. Bitcoin could get some of this pouring into it along with alts, just like back in 2021. It took time, a few months for it to come in and propel Bitcoin to it’s new highs. During golds run bitcoin was essentially just going sideways, then corrected to key market structure at 9.8k to 10k. Once it found support, it took off from there and didn’t stop until 70k. This could happen very similarly this time. A retest of 69k could be the bottom of the correction before it build up of pressure for the final run up either late this year or 2027.
This is my prediction from my analysis at this time. Let me know what you think down below.
I’ll leave you with a quote you may or may not know.
“Allow me to issue the currency of a nation and I care not who rules it”
Regards,
WeAreSat0shi

How to Identify Market Highs & Lows - The Foundation of TradingHow to Identify a High and a Low - Trading Foundation
Educational video covering one of the most critical skills in trading: the ability to correctly identify market highs and lows. Master this, and market structure becomes clear.
📚 Why This Matters:
Price = Trader Perception
Understanding highs and lows isn't just technical—it's psychological:
At a High:
Traders perceive price is expensive → Take profits → Ask for discount (pullback)
At a Low:
Traders perceive price is cheap → Take profits on shorts → Ask for discount (rally)
The Opportunity:
If we can clearly identify true highs and lows, we can anticipate these turning points and position ourselves advantageously.
This is the foundation of all market structure analysis.
📊 The Simple Rules:
How a HIGH is Formed:
Rule: A high is formed when a Higher High (HH) creates a minimum of 2 Lower Lows (LL)
What This Means:
Price makes a new high (HH)
Then creates at least 2 consecutive lower lows
This confirms the high is established and price is moving away
Visual Pattern: HH (High formed)
/ \
/ \
/ LL1
/\
/ LL2
How a LOW is Formed:
Rule: A low is formed when a Lower Low (LL) creates a minimum of 2 Higher Highs (HH)
What This Means:
Price makes a new low (LL)
Then creates at least 2 consecutive higher highs
This confirms the low is established and price is moving away
Visual Pattern:
HH2
/\
/ HH1
/
LL (Low formed)
When a High is Broken:
Scenario:
High is formed (HH + 2 LLs) ✓
Price rallies back and breaks ABOVE that high
Then shifts to creating a Momentum Low
What This Tells Us:
Sellers have stepped in at the high. Despite breaking higher, price couldn't sustain and reversed to make a momentum low = bears in control.
Trading Implication: Potential reversal or distribution zone
When a Low is Broken:
Scenario:
Low is formed (LL + 2 HHs) ✓
Price drops back and breaks BELOW that low
Then shifts to creating a Momentum High
What This Tells Us:
Buyers have stepped in at the low. Despite breaking lower, price couldn't sustain and reversed to make a momentum high = bulls in control.
Trading Implication: Potential reversal or accumulation zone
📚 Key Takeaways:
✅ HIGH: HH followed by minimum 2 LLs
✅ LOW: LL followed by minimum 2 HHs
✅ Minimum 2 swings required for confirmation (not 1)
✅ Break + momentum shift = highest probability signals
✅ This is objective - no guessing, just structure
✅ Foundation skill - master this before complex strategies
This is the foundation. Everything else in trading builds on this simple but powerful concept.
👍 Boost if you found this educational
👤 Follow for more trading fundamentals
💬 Can you identify highs and lows now? Practice and share!

5 IMPOTANT TYPES OF ELLIOTT WAVE PATTERNS !!Hello traders, today we will talk about 5 TYPES OF ELLIOTT WAVE PATTERNS
( FIRST SOME BASIC INFO )
What is Elliott Wave Theory?
The Elliott Wave Theory suggests that stock prices move continuously up and down in the same pattern known as waves that are formed by the traders’ psychology.
The theory holds as these are recurring patterns, the movements of the stock prices can be easily predicted.
Investors can get an insight into ongoing trend dynamics when observing these waves and also helps in deeply analyzing the price movements.
But traders should take note that the interpretation of the Elliot wave is subjective as investors interpret it in different ways.
(KEY TAKEAWAYS)
The Elliott Wave theory is a form of technical analysis that looks for recurrent long-term price patterns related to persistent changes in investor sentiment and psychology.
The theory identifies impulse waves that set up a pattern and corrective waves that oppose the larger trend.
Each set of waves is nested within a larger set of waves that adhere to the same impulse or corrective pattern, which is described as a fractal approach to investing.
Before discussing the patterns, let us discuss Motives and Corrective Waves:
What are Motives and Corrective Waves?
The Elliott Wave can be categorized into Motives and Corrective Waves:
1. Motive Waves:
Motive waves move in the direction of the main trend and consist of 5 waves that are labelled as Wave 1, Wave 2, Wave 3, Wave 4 and Wave 5.
Wave 1, 2 and 3 move in the direction of the main direction whereas Wave 2 and 4 move in the opposite direction.
There are usually two types of Motive Waves- Impulse and Diagonal Waves.
2. Corrective Waves:
Waves that counter the main trend are known as the corrective waves.
Corrective waves are more complex and time-consuming than motive waves. Correction patterns are made up of three waves and are labelled as A, B and C.
The three main types of corrective waves are Zig-Zag, Diagonal and Triangle Waves.
Now let us come to Elliott Wave Patterns:
In the chart I have mentioned 5 main types of Elliott Wave Patterns:
1. Impulse:
2. Diagonal:
3. Zig-Zag:
4. Flat:
5. Triangle:
1. Impulse:
Impulse is the most common motive wave and also easiest to spot in a market.
Like all motive waves, the impulse wave has five sub-waves: three motive waves and two corrective waves which are labelled as a 5-3-5-3-5 structure.
However, the formation of the wave is based on a set of rules.
If any of these rules are violated, then the impulse wave is not formed and we have to re-label the suspected impulse wave.
The three rules for impulse wave formation are:
Wave 2 cannot retrace more than 100% of Wave 1.
Wave 3 can never be the shortest of waves 1, 3, and 5.
Wave 4 can never overlap Wave 1.
The main goal of a motive wave is to move the market and impulse waves are the best at accomplishing this.
2. Diagonal:
Another type of motive wave is the diagonal wave which, like all motive waves, consists of five sub-waves and moves in the direction of the trend.
The diagonal looks like a wedge that may be either expanding or contracting. Also, the sub-waves of the diagonal may not have a count of five, depending on what type of diagonal is being observed.
Like other motive waves, each sub-wave of the diagonal wave does not fully retrace the previous sub-wave. Also, sub-wave 3 of the diagonal is not the shortest wave.
Diagonals can be further divided into the ending and leading diagonals.
The ending diagonal usually occurs in Wave 5 of an impulse wave or the last wave of corrective waves whereas the leading diagonal is found in either the Wave 1 of an impulse wave or the Wave A position of a zigzag correction.
3. Zig-Zag:
The Zig-Zag is a corrective wave that is made up of 3 waves labelled as A, B and C that move strongly up or down.
The A and C waves are motive waves whereas the B wave is corrective (often with 3 sub-waves).
Zigzag patterns are sharp declines in a bull rally or advances in a bear rally that substantially correct the price level of the previous Impulse patterns.
Zigzags may also be formed in a combination which is known as the double or triple zigzag, where two or three zigzags are connected by another corrective wave between them.‘
4. Flat:
The flat is another three-wave correction in which the sub-waves are formed in a 3-3-5 structure which is labelled as an A-B-C structure.
In the flat structure, both Waves A and B are corrective and Wave C is motive having 5 sub-waves.
This pattern is known as the flat as it moves sideways. Generally, within an impulse wave, the fourth wave has a flat whereas the second wave rarely does.
On the technical charts, most flats usually don’t look clear as there are variations on this structure.
A flat may have wave B terminate beyond the beginning of the A wave and the C wave may terminate beyond the start of the B wave. This type of flat is known as the expanded flat.
The expanded flat is more common in markets as compared to the normal flats as discussed above.
5. Triangle:
The triangle is a pattern consisting of five sub-waves in the form of a 3-3-3-3-3 structure, that is labelled as A-B-C-D-E.
This corrective pattern shows a balance of forces and it travels sideways.
The triangle can either be expanding, in which each of the following sub-waves gets bigger or contracting, that is in the form of a wedge.
The triangles can also be categorized as symmetrical, descending or ascending, based on whether they are pointing sideways, up with a flat top or down with a flat bottom.
The sub-waves can be formed in complex combinations. It may theoretically look easy for spotting a triangle, it may take a little practice for identifying them in the market.
Bottomline:
As we have discussed above Elliott wave theory is open to interpretations in different ways by different traders, so are their patterns. Thus, traders should ensure that when they identify the patterns.
This chart is just for information
Never stop learning
I would also love to know your charts and views in the comment section.
Thank you

Why Traders Freeze Even With a Profitable StrategyOne of the most misunderstood challenges in trading is freezing under uncertainty. Many traders assume the problem comes from missing skills, weak discipline, or an incomplete strategy. In practice, freezing rarely originates from technical shortcomings. It emerges from how the human nervous system reacts when outcomes are uncertain.
Most traders who freeze are prepared. They have a defined system, tested rules, and a clear execution plan. The difficulty arises at the moment where a decision must be made without knowing the result. Preparedness and uncertainty tolerance are separate skills. One can exist without the other. Many traders know exactly what to do, yet struggle to act because the outcome cannot be guaranteed.
Freezing follows a predictable pattern. A trader builds a system, tests it, and recognizes valid setups in real time. When execution becomes necessary, hesitation appears. The hand pauses, the mind begins negotiating, and small delays feel justified. Waiting for more confirmation appears rational, but often reflects discomfort with uncertainty rather than patience. The trade moves without execution, followed by frustration rooted in inaction rather than loss.
Over time, freezing erodes execution consistency. Valid setups are skipped, entries become late, and price is chased instead of anticipated. Statistical performance becomes unreliable because execution no longer matches the system. Confidence weakens, not because the method fails, but because the trader fails to apply it consistently. This often leads to misplaced blame on market conditions, strategy selection, or external factors, while the underlying issue remains unresolved.
Under uncertainty, logic loses influence. Even when traders understand probabilities, risk distribution, and long-term expectancy, the nervous system responds as if uncertainty represents personal threat. Stress responses override analytical thinking. Decision-making shifts from structured execution to self-protection. This biological response persists unless explicitly trained for.
Habitual freezing changes behavior. Missed trades generate frustration, which leads to forced entries and impulsive decisions. The trader oscillates between inactivity and overreaction. Rules remain written but lose authority during live execution. Discipline appears intact externally, while internal decision-making is driven by fear and relief rather than process.
Progress begins when confidence is no longer treated as a prerequisite for action. Confidence develops after consistent execution, not before it. Trading becomes more manageable when framed as participation rather than control. Outcomes remain uncertain, but execution remains consistent. Each decision becomes a simple question of alignment with rules, independent of emotional state.
Practical improvement comes from shifting focus toward probabilities, cultivating curiosity instead of judgment, and building tolerance through repetition. Emotional stability develops through exposure, not motivation. Each executed trade reinforces functional behavior under uncertainty.
Markets continuously test a trader’s relationship with uncertainty. Progress depends on the ability to execute despite incomplete information. Some traders wait for certainty that never arrives. Others act according to plan and accept uncertainty as part of the process. Trading rewards consistency under uncertainty. Functioning within it is the skill that separates stalled progress from long-term development.

How to Start Gold XAUUSD Trading in 2026. Beginners Guide
In article video, I will share everything that you need to start trading Gold in 2026.
We will go through the essential topics to study, the trading strategy to choose, the charting software and trading terminal to use, and much more.
As a bonus, I will share with you free learning materials.
Let's start with the topics that you need to study for successful Gold trading.
I suggest starting with learning technical analysis.
The first thing that you will need to study will be support, resistance analysis and key levels.
Your ability to identify significant structures will be the key for effective analysis of Gold chart.
This knowledge will help you make accurate predictions and forecasts of Gold future price movements.
These article will help:
Key Levels & Zones Analysis -
Psychological levels:
The second topic that you should focus on will be price action analysis.
Start with the basics of price action trading:
trend analysis and structure mapping.
It will help you to accurately identify the market trend and reversals.
This articleswill help:
Structure Mapping and Trend Analysis -
After studying the essential basics of price action analysis in Gold trading,
start learning price action patterns.
Classic trend following, consolidation and reversal patterns will help you have a deeper understanding of the behavior of the market participants.
In this article, I explained 7 best chart patterns for trading:
The next topic to study will be candlestick analysis.
There are several must-know candlestick patterns that every gold trader should know.
In this aricle, you will learn these patterns -
These candlestick patterns will provide reliable signals way before a price action pattern forms.
Being able to spot these patterns will provide you with a powerful edge in trading Gold.
Though I am not a fundamental trader, I admit the significance of fundamental news in Gold trading.
You need to understand what fundamental factors influence Gold prices and how to act during their occurrence.
In this article, you will learn 5 important news events for Gold trading:
And in this article, you will find a complete guide explaining how to deal with this high impact news:
The last but not least topic that many newbie traders often neglect is risk management.
You will need to learn how to measure lot size for your Gold trades to control your risks and avoid margin call.
In this article, I recorded a complete tutorial for measuring a position size for gold trading -
To learn all these topics and to practice Gold analysis, you will need a charting software.
I have been using TradingView for more than 10 years already. It is completely free, convenient and user-friendly. So definitely try it.
After you studied all the topics that I recommended, you will need to choose your trading style: day trading, scalping or swing trading.
Choosing a trading style depends mostly on how much free time you have.
Scalping requires maximum focus and will make you staying in front of the screen for hours without breaks.
While, swing trading is very slow and is appropriate for traders who have just 1-2 hours a day for trading.
Day trading is somewhere in the middle, requiring checking the charts at least once in an hour during a trading session.
If you have busy work, start with swing trading.
If you are a housewife with much free time, day trading or scalping will be the best choice.
Your trading style will define time frames that you will trade.
In this article, I explained how to choose a time frame for trading Gold:
Based on a trading style that you choose, you should select a trading strategy.
A trading strategy is a strict set of rules and conditions that you will use for entries.
This guide will help you to build your profitable xauusd strategy.
Using this plan, you will learn everything that you need for profitable Gold trading in 2026.
Let me know in a comment section if you have any questions and good luck to you in your endeavors.
❤️Please, support my work with like, thank you!❤️
I am part of Trade Nation's Influencer program and receive a monthly fee for using their TradingView charts in my analysis.

Competitive Currency War: An In-Depth Analysis1. Concept and Mechanism
At its core, a currency war is a contest among nations to make their exports cheaper and imports more expensive. By devaluing its currency, a country effectively reduces the price of its goods and services in foreign markets, thereby boosting export competitiveness. Simultaneously, imports become more expensive, which can help protect domestic industries from foreign competition.
Central banks and governments influence currency values through monetary policy tools:
Interest Rate Adjustments: Lowering interest rates can reduce foreign investment inflows, decreasing demand for the currency and pushing its value down.
Quantitative Easing (QE): Large-scale purchases of government securities inject liquidity into the domestic economy, increasing money supply and devaluing the currency.
Direct Intervention in Forex Markets: Central banks may buy or sell currencies to influence exchange rates directly.
Capital Controls: Some countries may limit the flow of foreign investment to manage currency value.
While these actions may be justified for domestic economic objectives, they often trigger international reactions, particularly if other nations perceive the devaluation as a deliberate attempt to gain unfair trade advantage.
2. Causes of Competitive Currency Wars
Several factors drive countries to engage in competitive currency devaluation:
Trade Imbalances: Countries with large trade deficits may attempt to devalue their currency to make exports more competitive and reduce imports, narrowing the deficit.
Economic Slowdowns: During periods of sluggish growth or recession, devaluation can stimulate domestic demand by encouraging exports and attracting foreign investment.
Monetary Policy Constraints: When traditional tools like interest rate cuts reach their limits (e.g., near-zero or negative interest rates), currency devaluation becomes a more attractive option.
Globalization and Interconnectedness: In a highly interconnected global economy, the currency moves of one major economy can affect trade balances, investment flows, and financial markets worldwide, prompting reactive measures from other countries.
Political and Strategic Considerations: Beyond economics, currency wars may serve geopolitical aims, such as weakening an adversary’s economic position or gaining leverage in trade negotiations.
3. Historical Examples
Competitive currency wars are not a new phenomenon. Some notable examples include:
1930s Great Depression: During the global economic downturn, many nations abandoned the gold standard and engaged in competitive devaluations to stimulate exports, deepening global trade tensions.
1985 Plaza Accord: The U.S., Japan, West Germany, France, and the UK coordinated to depreciate the U.S. dollar against the Japanese yen and German Deutsche Mark to address trade imbalances. While this was a cooperative effort, it demonstrated how exchange rates are manipulated to achieve trade objectives.
Post-2008 Financial Crisis: In response to the global recession, central banks in the U.S., Japan, and Europe implemented aggressive monetary easing policies. Japan, in particular, under “Abenomics,” pursued a weak yen strategy to boost exports, leading to accusations of currency manipulation.
Recent Emerging Market Pressures: Countries with export-driven economies, like China, have occasionally been accused of intentionally maintaining undervalued currencies to enhance global competitiveness.
4. Implications of Currency Wars
Currency wars can have wide-ranging effects, both positive and negative:
Positive Effects (Short-Term Gains):
Boosting Exports: A weaker currency makes a country's goods cheaper abroad, supporting domestic manufacturing and employment.
Reducing Trade Deficits: Devaluation can help correct trade imbalances by making imports more expensive and exports more attractive.
Stimulating Economic Growth: Increased demand for exports can spur GDP growth during slowdowns.
Negative Effects (Long-Term Risks):
Inflationary Pressure: A weaker currency raises the cost of imports, potentially triggering inflation and reducing consumers’ purchasing power.
Retaliation and Trade Wars: Competing countries may respond with their own devaluations or trade restrictions, escalating tensions and harming global trade.
Financial Market Volatility: Rapid currency fluctuations create uncertainty for investors and can destabilize capital flows.
Erosion of Confidence: Persistent devaluation can undermine confidence in a country’s currency, making it difficult to attract foreign investment.
Global Economic Imbalances: If multiple nations engage in competitive devaluation simultaneously, the net gain is limited, and the overall effect can be disruptive.
5. Currency Wars and Global Policy Coordination
The international community often reacts to competitive currency devaluations through diplomatic channels, trade negotiations, and policy coordination. Institutions like the International Monetary Fund (IMF) monitor exchange rates and can intervene to stabilize global markets. However, in practice, effective coordination is challenging because countries prioritize domestic economic objectives over global stability, particularly during crises.
For example, the IMF has frequently warned against “beggar-thy-neighbor” policies—devaluations intended primarily to harm other economies. Yet, in the absence of enforceable rules, currency wars remain a potent tool for nations seeking short-term advantages.
6. Modern Challenges and the Role of Major Economies
In today’s interconnected economy, currency wars are more complex due to:
High-Frequency Trading: Financial markets react almost instantaneously to policy signals, amplifying currency volatility.
Digital Currencies: Central Bank Digital Currencies (CBDCs) may alter traditional dynamics of exchange rates and cross-border trade.
Global Supply Chains: Devaluation effects on trade competitiveness are increasingly mediated by complex supply chains, which can dilute the intended economic benefit.
Geopolitical Tensions: Strategic conflicts among major economies (e.g., U.S.-China trade tensions) often intertwine with currency policy, making devaluation both an economic and political instrument.
7. Conclusion
A competitive currency war is essentially a strategic contest over economic advantage through exchange rate manipulation. While it can provide short-term benefits such as boosting exports and stimulating growth, it carries significant risks for global stability, including inflation, trade conflicts, and market volatility. The phenomenon underscores the tension between domestic economic policy goals and the collective interest of the global economy.
As globalization deepens and economies become more intertwined, competitive currency devaluation will remain a powerful, yet potentially dangerous, tool. Policymakers must balance the desire for national economic advantage with the need for long-term financial stability. International coordination, transparency, and careful management of monetary policy are crucial to mitigating the destructive potential of currency wars.
In essence, a currency war is not merely a financial phenomenon—it is a reflection of the broader economic and geopolitical strategies nations employ in an increasingly competitive global arena.

Latest Global Currency Shift & De‑Dollarization News Introduction: The Global Currency Landscape
Since World War II, the U.S. dollar (USD) has functioned as the primary global reserve and settlement currency. This means that central banks hold dollars as a major part of their foreign exchange reserves, international trade is often priced in dollars (especially oil), and global investors prefer dollar‑denominated assets for safety and liquidity.
However, over the past decade—and especially in recent years—this dominance has started to shift. Multiple economic, geopolitical, and technological forces are reshaping how currencies are used globally, weakening the dollar’s monopoly and contributing to what analysts call a global currency shift or de‑dollarization.
1. Why the Dollar Dominated — And Why That’s Changing
Why the Dollar Became Dominant
The dollar became dominant due to several historical factors:
Bretton Woods System (1944): The dollar was pegged to gold, and other currencies were pegged to the dollar, making it the linchpin of international finance.
Economic Size & Stability: The U.S. economy is the largest in the world, with deep, liquid capital markets and strong legal institutions.
Petrodollar System: Oil was widely priced and traded in dollars, creating consistent global demand.
These factors together encouraged countries and banks worldwide to hold and use dollars in reserves and transactions.
Why Its Dominance Is Eroding
Several major forces now challenge this dominance:
1. Reserve Diversification by Central Banks
Central banks are reducing the proportion of their reserves held in dollars and increasing holdings of gold and other currencies. A recent survey found many reserve managers plan to raise gold and euro holdings due to concerns about US political and economic stability.
Historically, the dollar’s share of global reserves was over 70% in 2000; it has fallen to around 56–58% by 2025.
2. Geopolitical Fragmentation
Rising tensions between major powers—especially the United States, China, and the EU—are contributing to a fragmentation of the global financial system. Countries facing sanctions or political pressure aim to reduce reliance on U.S.‑controlled financial infrastructure (e.g., SWIFT).
3. Alternative Currencies Gaining Traction
The euro (EUR), Japanese yen (JPY), British pound (GBP), and notably the Chinese renminbi (CNY) have all increased their presence in international finance and trade. The renminbi’s share of global transactions and reserves, while still much smaller than the dollar’s, has grown significantly over the past decade.
4. New Payment Systems
Countries and coalitions are building alternative settlement platforms that bypass traditional dollar‑centric systems:
CIPS (China’s Cross‑Border Interbank Payment System) supports non‑dollar clearing.
BRICS Pay aims to facilitate payments in local currencies among Brazil, Russia, India, China, and South Africa.
5. Digital Currencies & Technology
Central Bank Digital Currencies (CBDCs) and blockchain technology offer new ways to conduct cross‑border payments that could challenge traditional currency usage patterns.
2. Key Trends in the Global Currency Shift
A. De‑Dollarization
This term refers to the deliberate reduction of the U.S. dollar’s role in international finance. It includes:
Reserve diversification (holding fewer dollars).
Bilateral trade in local currencies (not using dollars for settlements).
Alternative payment infrastructure bypassing dollar‑based systems.
Although the dollar remains the dominant currency, its share in reserves and transactions is trending downward.
B. Rise of a Multi‑Polar Currency World
Instead of a single dominant currency, the world may evolve into a multi‑polar currency system, where several major currencies coexist and compete, including:
Euro: Already holding around 20% of global reserves.
Yen & Pound: Smaller but significant reserve shares.
Renminbi: Rapidly growing use in trade and financial transactions.
Some analysts predict this diversification will continue over years or decades rather than overnight.
C. Growth in Gold as a Reserve Asset
Gold has seen strong demand from central banks as a hedge against currency risk. In some measures, global gold holdings have exceeded U.S. Treasuries held by foreign central banks—a symbolic shift in investor preference.
D. Forex Market Volatility
Exchange rates fluctuate in response to monetary policy, geopolitical events, and market sentiment. For instance, recent volatility includes:
Dollar weakness due to shifts in U.S. policy expectations.
Yen strengthening amid speculation of intervention.
Gold price surges as investors seek safe havens.
These shifts reflect broader uncertainty in global finance—not necessarily the dollar’s immediate demise but a period of recalibration.
3. Drivers Behind the Shift
Geopolitical Drivers
Political tensions, sanctions, and trade disputes motivate countries to reduce reliance on the dollar. For instance, countries targeted by U.S. sanctions often seek alternative channels and currencies to avoid financial isolation.
Economic & Policy Drivers
Concerns about fiscal health, rising U.S. debt levels, and the use of the dollar for economic sanctions affect global confidence. Monetary policy divergence—such as differing interest rate paths between the Fed and other central banks—also influences capital flows and currency preferences.
Technological Drivers
Digital currencies (CBDCs) and blockchain payment systems create opportunities to innovate cross‑border transactions—potentially reducing the intermediary role of the dollar.
4. Implications of the Global Currency Shift
For the United States
Reduced “exorbitant privilege”: The U.S. benefits from lower borrowing costs and strong demand for Treasuries due to dollar dominance; a shift could raise costs.
Policy pressure: Continued dominance depends on fiscal discipline, stable governance, and sound monetary policy.
For Other Economies
Emerging markets may benefit from more flexibility in trade and reserve management.
Regional currency blocs may gain influence if their currencies and payment systems become more widely adopted.
For Global Trade & Finance
A more diversified currency landscape could:
Reduce systemic risk by not depending on a single currency.
Increase transaction costs where currency conversions and hedging are needed.
Encourage regional financial integration driven by aligned trade partners.
5. What This Doesn’t Mean
Despite these shifts, the dollar is not obsolete:
It still accounts for the largest share of global reserves.
It remains the most used currency in trade invoicing.
Change is gradual and structural, not sudden and complete.
Conclusion: A Gradual Evolution
The global currency shift is one of the most consequential macro‑economic developments in decades. It reflects changes in:
geopolitical alliances,
economic policy,
financial infrastructure, and
technological innovation.
While the U.S. dollar remains central today, a multipolar currency future—with greater roles for the euro, yuan, yen, digital currencies, and gold—is increasingly plausible. This evolution won’t happen overnight but is already shaping how governments, companies, and investors think about money in the global economy.

What Is a Trade War?Direct Economic Impacts
1. Higher Prices for Consumers
One of the most immediate and visible impacts of a trade war is higher consumer prices. Tariffs are taxes on imported goods. When imposed, the added cost is often passed on to consumers by businesses in the form of higher retail prices for everyday products such as electronics, clothing, food, and household goods.
For example, during recent U.S.–China trade conflicts and new tariff spikes in 2025–26, American consumers faced price increases on items that relied on imported parts or components. Many households effectively paid more for the same goods, reducing their purchasing power and squeezing family budgets.
Higher price levels can also contribute to inflation, especially in countries that import a large share of their consumer goods. Inflationary pressures may prompt central banks to tighten monetary policy, potentially slowing economic activity.
2. Disrupted Global Supply Chains
Modern manufacturing and commerce rely on global supply chains — networks of suppliers spanning multiple countries. Trade wars introduce tariffs and uncertainty that disrupt these networks, forcing manufacturers to adjust sourcing, logistics, and inventory practices.
For instance, tariffs on steel and aluminum can raise costs not only for those materials but also for products that depend on them, such as vehicles and appliances. The automotive, electronics, and technology sectors have been notably affected in recent years by such disruptions, leading to production delays, cost increases, and reconfiguration of global manufacturing hubs.
Some companies respond by reshoring production or shifting supply chains to other regions to avoid tariffs, but these transitions require substantial investment and take time, sometimes causing short‑term volatility in production levels.
3. Slower Economic Growth
Trade wars typically reduce the volume of international trade, weakening economic growth. Governments raise tariffs to protect local industries, but foreign markets often retaliate. Export volumes drop, and global trade growth slows.
International organizations such as the IMF and World Bank have highlighted that trade tensions between major economies can dampen global economic expansion and create uncertainty that discourages investment. For example, studies have linked tariff escalation to slower GDP growth in both developed and developing countries, with some nations experiencing notable economic deceleration.
Reduced economic growth affects employment, investment, and public finances. As companies face higher costs and demand weakens, they may postpone expansions or hiring, further dampening economic momentum.
Effects on Businesses and Markets
1. Higher Operating Costs for Firms
Firms that rely on imported inputs — raw materials, components, or finished intermediate goods — see their production costs rise in the presence of tariffs. These increased costs squeeze profit margins, reduce competitiveness, and often force companies to raise prices for customers.
In industries such as technology and manufacturing, where global sourcing is common, tariffs make operations less efficient. Firms may need to restructure their supply chains, source from higher‑cost suppliers, or move production closer to target markets to avoid tariff penalties.
2. Investment Uncertainty
Trade wars create a climate of policy unpredictability. Businesses don’t know when tariffs will be introduced, increased, or removed, making long‑term planning difficult. Heightened uncertainty tends to reduce business investments — from building new facilities to hiring workers — and encourages a cautious stance among corporate decision‑makers.
Reduced investment can slow innovation and economic progress over time. Companies that might otherwise invest in research, technology, or expansion choose to delay these plans until trade policy stabilizes.
3. Market Volatility
Financial markets often react negatively to heightened trade tensions. Investors view escalating trade barriers as a risk to corporate earnings and economic growth. Stock prices can fall in affected sectors and even across broad market indexes as uncertainty rises. For example, renewed tariff threats in early 2026 contributed to notable declines in major technology stocks, reflecting investor nervousness about economic repercussions.
Effects on Workers and Employment
Trade wars affect employment in complex ways. Workers in export‑oriented industries may face layoffs if foreign demand drops due to retaliatory tariffs. Industries reliant on imported inputs may also cut jobs if production slows or moves abroad. Some academic research suggests that tariff escalation could lead to tens of millions of job losses globally, with lower‑skilled workers often worst hit.
Conversely, some sectors might experience temporary job protection if tariffs shield them from foreign competition. But these gains often come at broader economic costs and are usually limited in scope.
Effects on International Relations
1. Retaliation and Escalation
Trade wars often trigger reciprocal tariffs, leading to escalation cycles. One country’s tariff can be met with another’s counter‑tariffs, spreading economic damage wider. This dynamic makes trade disputes resemble strategic conflicts rather than simple policy measures.
Escalation can strain diplomatic relations, complicate cooperation on other international issues, and reduce trust between governments. Trade tensions between major powers like the U.S., China, and the EU have, at times, influenced broader geopolitical alignments and negotiations.
2. Undermining Global Institutions
Institutions like the World Trade Organization (WTO) aim to promote stable and predictable trade rules. Prolonged trade wars and unilateral tariff hikes can weaken these systems, reducing their effectiveness and potentially leading to a less cooperative global trading environment. Analysts have warned that outdated global trade governance could worsen economic outcomes if not reformed to address modern trade challenges.
Long‑Term Structural Shifts
1. Supply Chain Realignment
Trade wars accelerate shifts in how global companies structure their operations. Firms may choose to diversify away from geopolitical rivals, shift production closer to target markets, or adopt “China+1” strategies to reduce dependency on a single partner. These changes reshape global trade networks and may persist even after tensions ease.
2. Fragmentation of the Global Economy
Sustained trade tensions can lead to economic fragmentation, where nations trade more within regional blocs or rely on politically aligned partners. This fragmentation may diminish the depth of global integration that characterized the late 20th and early 21st centuries and could reduce the collective gains from international specialization and comparative advantage.
Summary: Who Wins — and Who Loses?
At a high level:
Winners (short‑term, limited cases)
Protected domestic industries in specific sectors (e.g., producers shielded from foreign competition).
Governments that collect tariff revenues on imports.
Losers (broad and lasting)
Consumers facing higher costs and reduced choices.
Businesses dealing with increased costs and supply chain disruptions.
Workers in export‑dependent or import‑reliant industries.
Economies suffering slowed growth, inflation, and investment uncertainty.
International cooperation and global trade governance systems.
Most economists argue that while trade policy can be used for strategic ends, prolonged trade wars tend to shrink the global economic pie rather than expand it. In other words, protectionist gains in one sector are usually outweighed by broader inefficiencies and lost opportunities across the economy.

AI, Robotics & Future Technology Investing1. The Landscape of AI and Robotics
Artificial Intelligence (AI) refers to machines’ ability to perform tasks that typically require human intelligence, including learning, problem-solving, reasoning, perception, and language understanding. AI is not a single technology but a set of technologies, including machine learning (ML), natural language processing (NLP), computer vision, and generative AI. AI is increasingly embedded in sectors such as healthcare, finance, manufacturing, transportation, and consumer services, making it a pervasive force in the modern economy.
Robotics involves the design, construction, and operation of machines capable of performing tasks autonomously or semi-autonomously. Modern robotics integrates AI for perception, decision-making, and adaptability, enabling applications ranging from industrial automation and warehouse logistics to surgical robotics and autonomous vehicles. Robotics is no longer limited to factories; it is entering service industries, agriculture, defense, and even household applications.
Future technologies encompass a broader set of innovations, including quantum computing, advanced semiconductors, nanotechnology, biotechnology, augmented and virtual reality (AR/VR), blockchain, and next-generation telecommunications such as 5G and 6G. These technologies often act as enablers for AI and robotics, creating a synergistic effect that accelerates adoption and market disruption.
2. Market Growth and Investment Potential
The AI and robotics market is experiencing explosive growth. According to industry estimates, the global AI market could exceed $500 billion by the late 2020s, while the robotics market is expected to reach $300 billion within the same period. The growth is fueled by increasing automation demands, technological breakthroughs in AI algorithms, cheaper and faster computing power, and the rising need for efficiency across industries.
For investors, these numbers indicate potential high returns, but the landscape is highly competitive and fragmented. Companies range from large, established tech giants—like NVIDIA, Alphabet, Microsoft, and Boston Dynamics—that provide hardware, software, and AI cloud platforms, to small, specialized startups focused on niche applications such as autonomous delivery, medical diagnostics, or industrial robotics.
3. Investment Approaches
Investors can engage with AI, robotics, and future technologies through multiple approaches:
a. Direct Equity Investment: Buying shares of companies actively involved in AI or robotics allows investors to participate in their growth. For example, semiconductor companies like NVIDIA supply GPUs critical for AI processing, while companies like ABB or Fanuc manufacture industrial robots used globally. Equity investment requires careful selection, as valuations can be volatile, especially for high-growth startups.
b. Exchange-Traded Funds (ETFs) and Mutual Funds: Specialized ETFs, such as those focusing on AI, robotics, or technology innovation, provide diversified exposure without the need to pick individual stocks. These funds often include a mix of large-cap tech companies and emerging innovators, spreading risk while capturing sector-wide growth.
c. Venture Capital and Private Equity: For sophisticated investors, direct investment in early-stage startups in AI, robotics, or frontier technologies offers high growth potential but comes with significant risk. Venture capital funds often focus on transformative technologies such as autonomous vehicles, AI-driven healthcare solutions, or quantum computing startups.
d. Thematic Investment: This involves investing in companies or sectors tied to broader technological trends. For instance, investing in cloud computing providers, semiconductor manufacturers, or 5G infrastructure developers indirectly captures growth in AI and robotics.
4. Key Investment Drivers
Several factors are driving the investment case for AI, robotics, and future technologies:
Automation Demand: Businesses seek efficiency and cost reduction, creating a rising need for robotic automation and AI-driven analytics. Manufacturing, logistics, and warehousing are prime examples where AI-powered robotics enhance productivity.
Technological Innovation: Advancements in machine learning models, robotics hardware, edge computing, and sensor technology continuously expand the capabilities of AI and robotics applications.
Government and Corporate Investment: Many governments recognize AI and robotics as strategic priorities, providing funding and incentives for R&D. Similarly, corporations are allocating massive budgets to integrate AI into operations, supply chains, and customer engagement.
Data Explosion: AI thrives on data. The rapid increase in digital data from IoT devices, social media, and enterprise operations fuels machine learning, creating opportunities for software, cloud infrastructure, and analytics platforms.
Consumer Adoption: Emerging AI-driven applications like autonomous vehicles, smart home devices, AR/VR experiences, and AI-powered healthcare solutions are gaining mainstream acceptance, boosting market potential.
5. Risks and Challenges
Despite the promising growth trajectory, investing in AI, robotics, and future technologies carries inherent risks:
Technological Uncertainty: Not all innovations succeed, and breakthroughs may disrupt existing solutions. Investing in a company before a technology proves scalable carries high risk.
Valuation Volatility: High-growth tech stocks often experience sharp price swings, influenced by market sentiment, regulatory developments, or technological hype cycles.
Regulatory and Ethical Concerns: AI and robotics raise privacy, ethical, and security questions. Regulations may evolve rapidly, affecting market potential for certain applications.
Competition: The sector is highly competitive, with both global tech giants and nimble startups vying for market dominance. Market leadership can shift quickly.
Dependency on Infrastructure: AI and robotics often rely on advanced semiconductors, cloud computing, and connectivity infrastructure. Supply chain disruptions or geopolitical tensions can impact growth.
6. Future Outlook
The long-term outlook for AI, robotics, and future technology investing remains strong. Several megatrends are expected to drive the next decade of growth:
Autonomous Systems: Self-driving cars, drones, and automated logistics platforms will continue to expand, transforming transportation and delivery industries.
Healthcare Revolution: AI-powered diagnostics, robotic surgery, personalized medicine, and drug discovery will redefine healthcare delivery and efficiency.
Industrial and Smart Manufacturing: “Smart factories” utilizing robotics, AI analytics, and IoT devices will optimize production processes and supply chain management.
Human-Machine Collaboration: AI and robotics will increasingly augment human capabilities, from warehouse assistance and office automation to creative and professional tasks.
Sustainable Technologies: Robotics and AI will play a key role in renewable energy, precision agriculture, and environmental monitoring, aligning technological innovation with sustainability goals.
AI-Driven Creativity and Content: Generative AI will continue to disrupt content creation, marketing, entertainment, and design, opening new business models and monetization opportunities.
7. Strategic Considerations for Investors
To invest successfully in AI, robotics, and future technologies:
Diversify: Spread investments across multiple sub-sectors to reduce risk and capture growth from different innovation areas.
Focus on Fundamentals: Evaluate companies based on technological advantage, intellectual property, management capability, and scalability potential.
Stay Informed: Technology evolves rapidly. Continuous research on emerging trends, regulatory changes, and competitive landscapes is critical.
Consider Long-Term Horizon: Many technological innovations take years to achieve commercial success. Patience and a long-term perspective are essential.
Risk Management: Use portfolio strategies to mitigate volatility, including allocation to ETFs, diversified tech funds, or hedging strategies.
Conclusion
Investing in AI, robotics, and future technologies is a journey into the frontiers of innovation, offering opportunities to participate in transformative change across industries and societies. While the growth potential is immense, the risks are equally significant, requiring careful selection, diversification, and continuous monitoring. Investors who understand the interplay between emerging technologies, market dynamics, and societal adoption will be best positioned to capture the rewards of this transformative era.
In essence, AI, robotics, and future technology investing is not just about chasing profits—it is about investing in the future itself, a future increasingly shaped by intelligent machines, autonomous systems, and the relentless pace of technological innovation.

Dollar Index Explodes: Understanding the PhenomenonCauses of a Dollar Index Explosion
Interest Rate Differentials
The U.S. Federal Reserve plays a critical role in the dollar’s strength. When the Fed aggressively hikes interest rates, U.S. assets become more attractive to global investors due to higher returns. This drives demand for dollars, causing the Dollar Index to surge. Conversely, if other central banks maintain lower rates or pursue dovish policies, the gap widens, amplifying the dollar's upward momentum.
Safe-Haven Demand
The U.S. dollar is traditionally viewed as a safe-haven currency. During periods of global financial instability—such as geopolitical tensions, banking crises, or economic slowdowns—investors flock to dollars for security. This flight-to-safety behavior increases demand sharply, often leading to explosive moves in the Dollar Index.
Trade and Current Account Imbalances
U.S. trade deficits and global capital flows also influence the dollar’s trajectory. When foreign countries accumulate dollars through trade or investment, this can initially support the currency. However, sudden shifts—such as reduced appetite for U.S. assets—can trigger rapid adjustments, causing spikes in the index.
Global Risk Sentiment
Risk-on or risk-off market environments significantly affect currency valuations. In risk-off conditions, investors sell riskier assets and buy dollars, boosting the Dollar Index. Conversely, in risk-on conditions, the demand for the dollar may wane, softening its value. Explosive dollar moves often coincide with sudden swings in global risk perception.
Commodity Price Movements
Since many commodities, such as oil and gold, are priced in dollars, fluctuations in commodity markets can indirectly influence the Dollar Index. A decline in commodity prices often strengthens the dollar, while a surge in prices can weaken it. Explosive dollar gains are sometimes fueled by falling commodity prices, reflecting stronger purchasing power.
Market Implications of a Dollar Index Explosion
Impact on Emerging Markets
Emerging market economies are particularly vulnerable to a surging dollar because many of their debts are dollar-denominated. When the Dollar Index explodes, repayment costs for foreign debt rise sharply, creating financial stress. Capital outflows often accelerate, currencies depreciate, and inflation can surge, creating a challenging environment for policymakers.
Equity Markets
Strong dollar movements influence equity markets in multiple ways. U.S. multinational corporations may face reduced competitiveness overseas as their products become more expensive in foreign currencies, potentially hurting profits. Conversely, companies that rely on imports or have dollar-denominated revenues might benefit. Stock indices often react negatively to sudden dollar surges, especially in global sectors.
Bond Markets
Explosive dollar appreciation can lead to higher yields in U.S. Treasury markets as investors demand more return to compensate for currency risk. Conversely, in foreign bond markets, the local-currency returns may decline sharply, triggering volatility in cross-border investments. The ripple effects are pronounced in emerging markets with substantial foreign debt.
Commodity Prices
Commodity markets are inversely related to the dollar. A sharp increase in the Dollar Index generally depresses prices of commodities such as oil, gold, and base metals because they become more expensive for holders of other currencies. This dynamic has a feedback effect on inflation expectations and central bank policies worldwide.
Currency Volatility
Non-dollar currencies in the DXY basket, particularly the Euro and Japanese Yen, often experience significant depreciation during dollar explosions. Other global currencies, especially in emerging markets, may weaken even more dramatically due to capital flight and dollar demand pressures. Such volatility can exacerbate financial instability.
Macroeconomic Implications
Global Inflation and Monetary Policy
A stronger dollar can have mixed impacts on inflation. In the U.S., imports become cheaper, exerting downward pressure on inflation. However, in countries reliant on dollar imports or with dollar-denominated debt, inflation can spike due to higher costs of goods and debt service. Central banks worldwide may be forced to adjust policies in response, sometimes tightening rates to defend their currencies.
Trade Balance Effects
A stronger dollar makes U.S. exports more expensive and imports cheaper. While this can worsen the U.S. trade balance, it can alleviate trade deficits in other countries. However, sudden dollar explosions can disrupt global trade flows, increase volatility in commodity markets, and alter investment strategies.
Capital Flows and Investment
Explosive moves in the dollar attract capital into U.S. assets, reinforcing strength in a self-reinforcing cycle. Conversely, emerging markets may experience capital flight, higher borrowing costs, and liquidity constraints. Investors globally adjust strategies to hedge against currency risk, affecting equities, bonds, and derivatives markets.
Trading and Investment Perspectives
Forex Market Strategies
Traders often anticipate Dollar Index explosions by monitoring economic indicators, central bank signals, and geopolitical developments. Momentum trading, carry trades, and options strategies are commonly employed. Explosive moves present both opportunities and risks due to high volatility.
Hedging Strategies
Corporates and investors use hedging instruments such as forwards, futures, and options to protect against adverse dollar movements. For instance, companies with dollar-denominated liabilities may hedge via forward contracts to mitigate the impact of sudden dollar appreciation.
Global Diversification
For long-term investors, a surging dollar underscores the importance of portfolio diversification across currencies, asset classes, and geographies. Holding assets in multiple currencies can reduce exposure to dollar volatility and cushion against financial shocks.
Historical Examples
Historically, the Dollar Index has experienced explosive moves in response to monetary policy, crises, and geopolitical events:
2008 Global Financial Crisis: Investors flocked to the dollar as a safe haven, causing rapid appreciation.
2014-2015 Fed Tapering: Anticipation of U.S. rate hikes led to a sustained surge in the dollar.
2020 COVID-19 Market Turmoil: Early in the pandemic, the dollar spiked as global uncertainty increased.
These instances demonstrate the interconnected nature of currency markets, monetary policy, and investor sentiment.
Conclusion
An exploding Dollar Index is not merely a financial statistic—it is a global economic signal. It reflects shifts in interest rates, investor sentiment, trade flows, and geopolitical risks. Its effects permeate every corner of the financial world: from emerging market stability and corporate profits to commodity prices and investment strategies. Understanding the drivers, consequences, and strategies associated with dollar surges is crucial for policymakers, traders, and global investors alike. While the phenomenon creates challenges, it also presents opportunities for those prepared to navigate the volatility intelligently.
In an increasingly interconnected world, monitoring the Dollar Index and its explosive moves is not optional—it is essential for anyone with exposure to global finance, trade, or investment.