Index Futures & Options1. Introduction to Index Derivatives
Financial markets thrive on two main goals: wealth creation and risk management. Investors, traders, and institutions constantly look for tools that can help them protect against uncertainties or magnify profits. One such set of tools are derivatives, financial contracts whose value is derived from an underlying asset such as stocks, commodities, currencies, or indices.
Within the derivatives universe, Index Futures and Options are among the most widely traded instruments globally. They are not based on a single stock but on a basket of stocks represented by a market index like the S&P 500 (US), Nifty 50 (India), FTSE 100 (UK), or Nikkei 225 (Japan).
Why indices? Because they reflect the overall performance of a market segment or economy, making them powerful tools for broad-based speculation, hedging, and arbitrage.
2. What are Index Futures?
An Index Future is a standardized derivative contract traded on an exchange where two parties agree to buy or sell the value of an index at a future date for a pre-agreed price.
Unlike stock futures, index futures do not involve delivery of actual shares since an index itself cannot be delivered. Instead, they are cash-settled contracts.
For example:
Suppose the Nifty 50 index is at 20,000 points today.
You buy one Nifty Futures contract expiring next month at 20,100 points.
If, on expiry, Nifty closes at 20,500, you make a profit of 400 points × lot size.
If it closes at 19,800, you incur a loss of 300 points × lot size.
Key Features of Index Futures:
Underlying: A stock market index.
Lot Size: Fixed by the exchange (e.g., 50 units for Nifty in India).
Cash Settlement: No delivery of shares, only the difference in value.
Margin Requirement: Traders must deposit initial and maintenance margins.
Leverage: Small capital controls large exposure.
3. Mechanics of Index Futures Trading
Steps Involved:
Select Index Future (e.g., Nifty, S&P 500).
Choose Expiry (monthly, weekly in some markets).
Place Buy/Sell Order on exchange.
Margin Blocked: Initial margin required (5–12% typically).
Mark-to-Market (MTM) Settlement: Daily profits/losses adjusted in trader’s account.
Expiry Settlement: Final cash settlement at index closing price.
Example:
Trader A buys Nifty Futures at 20,000.
Next day Nifty closes at 20,200.
Profit = 200 × 50 (lot size) = ₹10,000 credited to Trader A.
This daily settlement ensures default risk is minimal.
4. What are Index Options?
An Index Option is a derivative contract that gives the buyer the right (but not obligation) to buy or sell an index at a pre-decided strike price before or on a specified expiry date.
Like futures, index options are cash-settled since indices cannot be delivered physically.
Types of Index Options:
Call Option (CE) – Right to buy index at strike price.
Put Option (PE) – Right to sell index at strike price.
The seller (writer) of the option, however, has the obligation to fulfill the contract if the buyer exercises it.
5. Types of Index Options (Call & Put)
Let’s simplify with an example using Nifty 50:
Call Option Example:
Nifty = 20,000.
You buy a Call Option (CE) with Strike = 20,100 at Premium = 150.
On expiry, if Nifty = 20,400 → Intrinsic value = 300; Profit = 150 (after premium).
If Nifty < 20,100 → Option expires worthless; Loss = Premium (150).
Put Option Example:
Nifty = 20,000.
You buy a Put Option (PE) with Strike = 19,800 at Premium = 120.
On expiry, if Nifty = 19,400 → Intrinsic value = 400; Profit = 280 (after premium).
If Nifty > 19,800 → Option expires worthless; Loss = Premium (120).
6. Pricing & Valuation Concepts
Index futures and options pricing depends on multiple factors:
Futures Pricing (Cost of Carry Model):
Futures Price = Spot Price × (1 + r – d)^t
Where,
r = Risk-free interest rate
d = Expected dividend yield
t = Time to expiry
Option Pricing (Black-Scholes Model):
Key Inputs:
Spot Index Level
Strike Price
Time to Expiry
Volatility
Risk-free Rate
Dividends
Options’ premiums consist of:
Intrinsic Value = Difference between spot and strike.
Time Value = Premium paid for future uncertainty.
7. Key Strategies using Index Futures & Options
Futures Strategies:
Directional Trading:
Buy futures if bullish on market.
Sell futures if bearish.
Hedging:
Long-term investors sell index futures to hedge portfolio risk.
Arbitrage:
Exploit mispricing between futures and spot market.
Options Strategies:
Protective Put: Buy puts to protect long portfolio.
Covered Call: Sell call against index holdings to earn premium.
Straddle: Buy call + put at same strike → profit from high volatility.
Strangle: Buy OTM call + OTM put → cheaper than straddle.
Iron Condor: Combination of spreads → profit in low volatility.
8. Role in Hedging & Speculation
Hedging:
Institutional investors with large portfolios use index derivatives to offset market-wide risks. Example: A mutual fund holding 500 crores worth of stocks may sell Nifty futures to hedge against a market fall.
Speculation:
Traders with directional views use leverage in index futures/options to profit from short-term moves.
Portfolio Insurance:
Buying index puts acts as insurance during market downturns.
9. Advantages & Disadvantages
Advantages:
Efficient hedging tool.
High liquidity in major indices.
Cash settlement – no delivery hassle.
Lower cost compared to trading multiple individual stock options.
Good for expressing macro views.
Disadvantages:
Leverage magnifies losses.
Options can expire worthless.
Requires good understanding of pricing & volatility.
Market risks cannot be eliminated fully.
10. Risks & Challenges
Leverage Risk: Small move in index can wipe out margins.
Volatility Risk: Option buyers may lose premium if volatility drops.
Liquidity Risk: Smaller indices may have low volume.
Systemic Risk: Large index moves can create margin pressures across market.
11. Global Market Practices
US Markets: S&P 500 Futures & Options most traded globally (CME, CBOE).
India: Nifty 50, Bank Nifty dominate F&O segment (NSE).
Europe: FTSE, DAX index derivatives popular.
Asia: Nikkei 225, Hang Seng actively traded.
These instruments are also used by hedge funds, mutual funds, pension funds, and sovereign wealth funds to manage exposure.
12. Case Studies & Examples
2008 Financial Crisis:
Portfolio managers used index puts to hedge against market collapse.
Those without hedges faced catastrophic losses.
Indian Market Example:
During Budget announcements, traders use straddles/strangles on Nifty due to expected high volatility.
Global Funds:
US-based funds often use S&P 500 futures to hedge international equity exposure.
13. Conclusion
Index Futures & Options are powerful instruments that serve dual roles:
Risk Management (Hedging)
Profit Generation (Speculation & Arbitrage)
For institutions, they act as portfolio insurance. For traders, they provide opportunities to capitalize on short-term moves. However, they demand discipline, risk management, and understanding of market mechanics.
In a world where uncertainty is constant, index derivatives are no longer optional – they are essential for anyone engaged in serious investing or trading.
Wave Analysis
Global Market InsightsGlobal Market Insights
Introduction
The world economy has never been as connected as it is today. A single headline in New York can influence stock prices in Mumbai, a factory shutdown in China can disrupt supply chains in Europe, and a currency decision in Tokyo can ripple across the global financial system. This interconnectedness is what we call the global market—a dynamic web of trade, finance, investment, and technology that links countries, businesses, and consumers.
Understanding global market insights means going beyond numbers and charts. It is about recognizing patterns, decoding the interplay between economies, and anticipating the opportunities and risks that shape the world’s financial and trade environment. For businesses, it means better decision-making; for investors, it provides a roadmap; and for policymakers, it is the foundation of economic strategy.
Historical Evolution of Global Markets
Early Trade Routes
Global markets are not new—they have been evolving for centuries. Ancient trade routes like the Silk Road connected China, India, and Europe, enabling the exchange of goods, culture, and ideas. Spices, silk, and gold moved across continents, laying the foundation of international trade.
Colonial Trade
During the colonial era, European powers expanded overseas trade. Colonies became sources of raw materials, while Europe turned into the hub of global commerce. The triangular trade routes connected Africa, the Americas, and Europe, setting the stage for structured global markets.
Industrial Revolution
The 18th and 19th centuries brought industrialization, mass production, and mechanization. This created demand for global raw materials and expanded markets for finished goods. Railways, shipping, and telegraph systems made trade faster and more reliable.
Post-WWII Institutions
After the devastation of World War II, new financial institutions like the IMF, World Bank, and GATT (later WTO) were established. Their goal was to stabilize currencies, promote trade, and rebuild economies. The Bretton Woods system anchored the US dollar as the world’s reserve currency.
The Digital Era
The late 20th and early 21st centuries saw globalization accelerate. The internet, digital platforms, and financial technologies made cross-border trading seamless. E-commerce, digital payments, and global capital flows now define how markets operate.
Key Drivers of Global Markets
Economic Growth & GDP Trends
Growth in GDP reflects an economy’s strength. For example, India’s rapid GDP expansion makes it attractive for foreign investment, while slowdowns in Europe raise global concerns.
Central Banks & Interest Rates
Monetary policy is a powerful driver. A rate hike by the US Federal Reserve often strengthens the US dollar, affects emerging market currencies, and shifts capital flows worldwide.
Geopolitics
Conflicts, trade wars, and diplomatic relations heavily impact markets. For instance, the Russia-Ukraine war disrupted energy markets, while US-China tensions reshaped technology supply chains.
Technology & Innovation
Advancements like artificial intelligence, fintech, blockchain, and automation are creating new asset classes and transforming trade. Digital finance is reducing barriers for investors across borders.
Global Supply Chains
Modern economies depend on complex supply chains. A disruption in semiconductor production in Taiwan can stall automobile factories in Germany or the US, highlighting interdependence.
Global Market Segments
Equity Markets
Stock exchanges like NYSE, Nasdaq, London Stock Exchange, and NSE India are central to global finance. The US remains dominant, but Asia is rising fast, with China’s Shanghai and Shenzhen exchanges gaining global importance.
Bond Markets
The global bond market is even larger than equities. Sovereign bonds, like US Treasuries, are considered safe havens, while corporate bonds fund business expansion worldwide.
Currency (Forex) Markets
The foreign exchange market is the largest in the world, with daily transactions exceeding $7 trillion. The US dollar remains the dominant reserve currency, but the Euro, Yen, and increasingly the Chinese Yuan are challenging its supremacy.
Commodities
Oil, gold, copper, and agricultural goods form the backbone of commodity markets. Oil prices influence inflation, while gold is a traditional safe haven during uncertainty. Industrial metals like copper are seen as indicators of global economic health.
Alternative Assets
Cryptocurrencies, private equity, hedge funds, and real estate investments are becoming major parts of global portfolios. Bitcoin, in particular, has sparked debates about the future of decentralized money.
Regional Market Insights
United States
The US remains the world’s largest economy and financial hub. The S&P 500 and Nasdaq set global benchmarks. US Federal Reserve decisions on interest rates influence global capital flows.
Europe
The Eurozone represents a unified market but faces challenges like debt crises, energy dependency, and post-Brexit trade disruptions. Germany’s manufacturing and France’s luxury goods industries play central roles.
Asia
China, the world’s second-largest economy, has slowed down recently but still drives global trade. India is emerging as a fast-growing market, fueled by demographics, technology, and reforms. Japan continues its ultra-loose monetary policy, affecting global yen carry trades.
Emerging Markets
Countries like Brazil, South Africa, and Indonesia are resource-rich and attract investment. However, they are vulnerable to capital outflows during global crises. ASEAN nations are gaining strength through regional cooperation.
Major Trends Shaping Global Markets
Shift from West to East
Economic power is gradually shifting toward Asia, particularly China and India.
Digital Finance & Blockchain
Cryptocurrencies, central bank digital currencies (CBDCs), and decentralized finance (DeFi) are reshaping financial systems.
ESG & Green Investing
Investors now focus on sustainability. Companies that prioritize environmental, social, and governance (ESG) standards attract global capital.
Supply Chain Diversification
The pandemic exposed supply chain weaknesses. Companies are diversifying away from single-country dependence, moving toward "China+1" strategies.
De-dollarization
Several nations are exploring alternatives to the US dollar for trade settlements. The BRICS bloc is discussing new currency frameworks.
Challenges & Risks
Inflation & Stagflation: Rising global inflation threatens purchasing power and investment returns.
Geopolitical Conflicts: Wars and trade disputes disrupt supply chains and energy flows.
Climate Change: Extreme weather impacts agriculture, energy, and insurance markets.
Financial Contagion: A crisis in one country can trigger a domino effect, as seen in 2008.
Global Market Opportunities
Emerging Technologies: AI, electric vehicles, renewable energy, and biotech present trillion-dollar opportunities.
India & Southeast Asia: With growing populations and strong digital adoption, these regions attract global investors.
Africa: Resource wealth and demographic growth position Africa as the "next frontier."
Digital Trade & Fintech: Cross-border e-commerce, digital payments, and fintech innovations expand global financial access.
Future of Global Markets
The next decade is likely to witness:
A multipolar financial world where the US, China, India, and Europe share influence.
The rise of digital currencies—both private and government-issued.
Green transformation, with renewable energy and sustainability as key investment drivers.
Increased regional alliances, as countries secure supply chains and reduce dependency on single markets.
Conclusion
Global markets are the heartbeat of the interconnected world. They reflect the hopes, fears, and ambitions of billions of people, from Wall Street traders to farmers in rural Africa. Insights into these markets allow investors, businesses, and policymakers to anticipate changes, mitigate risks, and seize opportunities.
As the global economy becomes more multipolar, digitalized, and sustainability-driven, the importance of staying updated with global market insights will only grow. For anyone involved in trade, investment, or governance, understanding these dynamics is no longer optional—it is essential.

Risk in International Market1. Understanding Risk in International Markets
Risk in international markets refers to the uncertainty of outcomes when engaging in cross-border transactions, investments, or trade. These risks can impact profitability, growth, and sustainability.
For example:
A company exporting goods to another country may face currency exchange fluctuations that erode profit margins.
A multinational corporation (MNC) investing in a politically unstable country may face expropriation or asset seizure.
A sudden tariff imposition or trade sanction could disrupt supply chains.
International risks are interconnected. An economic crisis in one country can trigger contagion effects worldwide. Thus, risk management in global markets requires a broad, multi-dimensional approach.
2. Categories of Risks in International Markets
International risks can be broadly classified into the following categories:
2.1 Political Risk
Political risk arises when government policies, political instability, or conflicts impact international trade and investment.
Examples: Nationalization of assets, sudden changes in trade regulations, wars, or regime changes.
Case Study: In 2014, many Western firms in Russia faced difficulties after sanctions and retaliatory measures disrupted business operations.
Subtypes:
Expropriation risk (government seizing foreign assets).
Political violence (civil war, terrorism, coups).
Regulatory changes (new trade barriers, taxes, or restrictions).
2.2 Economic and Financial Risk
Economic risk involves the uncertainty of operating in economies with unstable macroeconomic conditions.
Examples: Inflation, recession, unemployment, or sovereign debt crises.
Currency risk (Exchange Rate Volatility): A major component where fluctuating exchange rates can reduce profits.
Case Study: The Asian Financial Crisis (1997) saw many businesses collapse due to currency devaluation.
Subtypes:
Inflation risk
Interest rate risk
Liquidity risk
Balance of payments crisis
2.3 Currency and Exchange Rate Risk
Exchange rate fluctuations are one of the most common risks in global trade.
When a company exports goods, a sudden fall in the buyer’s currency reduces earnings when converted to the seller’s currency.
Importers face higher costs when their domestic currency depreciates.
Case Study: Indian IT companies billing in US dollars benefit from a stronger dollar, but importers of oil in India face higher costs when the rupee depreciates.
2.4 Legal and Regulatory Risk
International markets operate under diverse legal systems. A company must comply with multiple laws, including labor, taxation, intellectual property rights (IPR), and environmental regulations.
Examples:
A pharmaceutical company selling in Europe must comply with strict EU health and safety standards.
Data protection laws like GDPR affect global tech firms.
Failure to comply can lead to penalties, lawsuits, or bans.
2.5 Cultural and Social Risk
Culture impacts consumer behavior, workplace practices, and negotiations. Misunderstanding cultural norms can damage a company’s brand image.
Examples:
Marketing blunders due to mistranslation of slogans.
Fast-food chains adapting menus to local tastes (e.g., McDonald’s in India does not serve beef).
Cultural risks also affect labor relations, communication styles, and management practices.
2.6 Supply Chain and Operational Risk
In global trade, companies rely on complex supply chains. Disruptions at any point can impact operations worldwide.
Examples:
Natural disasters halting production.
Port strikes delaying shipments.
Shortages of raw materials.
Case Study: The COVID-19 pandemic disrupted global supply chains, causing shortages in semiconductors, medicines, and shipping delays.
2.7 Geopolitical and Security Risk
Tensions between countries can lead to sanctions, embargoes, or outright bans. Security risks such as terrorism, piracy, and cyber-attacks further complicate global trade.
Examples:
The US-China trade war caused tariffs and uncertainty in global supply chains.
Cyber-attacks on financial institutions threaten international capital flows.
2.8 Environmental and Sustainability Risk
Global businesses must consider environmental regulations, climate risks, and sustainability demands.
Examples:
Stricter carbon emission rules affecting manufacturing firms.
Climate change threatening agriculture and insurance industries.
Case Study: European Union’s Carbon Border Adjustment Mechanism (CBAM) impacts exporters from developing nations by imposing carbon tariffs.
2.9 Technological Risk
Technology drives global trade but also creates risks:
Cybersecurity threats.
Dependence on foreign technology providers.
Rapid technological obsolescence.
Example: Semiconductor shortages exposed the vulnerability of global industries dependent on a handful of suppliers.
2.10 Reputational Risk
A company’s reputation is global. A scandal in one country can affect its worldwide image.
Case Study: Volkswagen’s “Dieselgate” emissions scandal damaged its global reputation, leading to billions in losses.
3. Real-World Examples of International Market Risks
Brexit (2016–2020): Created uncertainty for businesses trading between the UK and EU, leading to tariffs, regulatory complications, and currency volatility.
COVID-19 Pandemic (2020–2022): A global supply chain crisis, demand shocks, and international border restrictions.
Russia-Ukraine War (2022 onwards): Caused oil price volatility, sanctions, and food supply disruptions.
US-China Trade War: Tariff escalations disrupted supply chains, affecting electronics, steel, and agriculture.
4. Impact of Risks on International Business
Profitability: Exchange rate swings and tariffs can reduce profit margins.
Market Entry Barriers: Political instability or protectionist policies deter investments.
Supply Chain Vulnerabilities: Disruptions increase operational costs.
Investor Confidence: Economic instability reduces foreign direct investment (FDI).
Strategic Shifts: Companies diversify operations to reduce overdependence on one country.
5. Strategies to Manage International Market Risks
5.1 Hedging and Financial Instruments
Use of derivatives like futures, options, and swaps to manage currency and interest rate risks.
Example: Exporters hedge against exchange rate volatility by locking in forward contracts.
5.2 Diversification
Geographic diversification reduces dependence on one market.
Supply chain diversification reduces risk from disruptions in one region.
5.3 Insurance
Political risk insurance protects companies against expropriation, terrorism, or war.
Trade credit insurance covers non-payment by foreign buyers.
5.4 Strong Legal Compliance
Understanding and complying with local laws reduces regulatory risk.
Companies often hire local legal experts.
5.5 Cultural Adaptation
Training employees in cross-cultural management.
Localizing products and marketing strategies.
5.6 Scenario Planning and Risk Assessment
Conducting “what-if” analyses to prepare for potential disruptions.
Example: Airlines hedge fuel costs against oil price fluctuations.
5.7 Building Resilient Supply Chains
Developing multiple suppliers.
Using digital technologies (AI, blockchain) for supply chain transparency.
5.8 Sustainability and ESG Practices
Adopting environmentally responsible strategies reduces reputational and regulatory risks.
Attracts socially conscious investors.
6. The Future of Risk in International Markets
Global risks are evolving rapidly:
Climate change will intensify natural disasters and regulatory pressures.
Technological risks will grow with AI, automation, and cybersecurity challenges.
Geopolitical rivalries (US-China, Russia-West) will increase uncertainty.
Global financial risks like debt crises and inflationary pressures may spread faster due to interconnected economies.
Companies of the future must adopt resilient, adaptive, and technology-driven risk management frameworks.
Conclusion
International markets present unparalleled opportunities, but they are inherently riskier than domestic markets. Risks in the international market stem from politics, economics, culture, law, technology, environment, and global interconnectedness.
Businesses that succeed in global markets are not those that avoid risks entirely but those that anticipate, assess, and strategically manage risks. From hedging financial exposures to diversifying supply chains, from complying with local laws to embracing sustainability, risk management is the backbone of international business success.
As the global economy grows more complex, the key will be resilience: the ability to withstand shocks, adapt to new realities, and continue to thrive despite uncertainty.

Sanctioned EconomiesIntroduction
Sanctions have become one of the most powerful tools in modern international relations. Instead of deploying armies or engaging in direct conflict, powerful nations and global institutions often turn to economic sanctions as a means of exerting pressure on adversaries. Sanctions can range from targeted restrictions on individuals and corporations to wide-ranging embargoes that limit a country’s ability to trade goods, access finance, or integrate with global systems.
The consequences of sanctions extend far beyond the borders of the targeted nation. They reshape trade flows, alter supply chains, influence investment decisions, and sometimes trigger broader geopolitical realignments. In today’s interconnected global economy, sanctioning one nation often creates ripple effects across multiple regions, industries, and markets.
This essay explores how sanctioned economies function, the types of sanctions imposed, their impacts on domestic and global markets, and the ways in which countries and corporations adapt to these restrictions. We will also examine real-world case studies of nations such as Iran, Russia, Venezuela, and North Korea to better understand the dynamics at play. Finally, we will consider the long-term implications of sanctions for global trade, energy security, and the shifting balance of economic power.
Understanding Sanctions
What Are Economic Sanctions?
Economic sanctions are restrictions imposed by one or more countries to limit the economic activities of another country, group, or individual. They are often justified as tools to punish aggressive behavior, prevent human rights abuses, or deter actions that threaten international security.
Sanctions can take many forms:
Trade Restrictions – bans on the import or export of specific goods (e.g., oil, weapons, technology).
Financial Sanctions – freezing assets, blocking access to global financial systems, restricting loans or investment.
Targeted Sanctions – restrictions aimed at specific individuals, corporations, or political leaders.
Comprehensive Sanctions – wide-ranging measures that isolate an entire economy from global trade (e.g., North Korea).
Why Do Countries Impose Sanctions?
Political Leverage: To pressure governments into changing policies (e.g., Iran’s nuclear program).
Deterrence: To prevent actions such as territorial expansion or human rights violations.
Punishment: To penalize states for actions deemed unacceptable by the international community.
Signaling: To show unity among nations or institutions against a perceived threat.
The Domestic Impact of Sanctions
Sanctions are meant to squeeze the target country’s economy. Their effects can be harsh, often hitting ordinary citizens harder than political elites.
Economic Slowdown
Sanctions reduce access to international markets and capital, causing GDP contractions. For example, Iran’s economy shrank by over 6% in 2019 when U.S. sanctions tightened its oil exports.
Inflation and Currency Collapse
Restricted trade reduces supply, driving up prices. Combined with currency devaluation, inflation becomes rampant. Venezuela, for instance, has faced hyperinflation due in part to sanctions that limited its oil exports and foreign reserves.
Unemployment and Poverty
When industries lose access to export markets or imported raw materials, production declines. This leads to job losses, declining wages, and growing poverty levels.
Technological Backwardness
Bans on advanced technology exports prevent sanctioned countries from modernizing their industries. Russia, for example, faces difficulties in upgrading energy exploration due to restrictions on Western drilling technologies.
Social Strains
Sanctions can create shortages of medicines, food, and essential goods. While exemptions for humanitarian trade exist, logistical challenges often prevent adequate supply.
How Sanctions Reshape Global Markets
Sanctions don’t just affect the targeted country—they disrupt global trade patterns. The more interconnected the sanctioned economy is with the world, the larger the impact.
1. Energy Markets
Energy is one of the most affected sectors. Countries like Iran, Russia, and Venezuela—major oil and gas exporters—have faced sanctions that limit their ability to sell hydrocarbons.
Iran: Sanctions drastically reduced Iranian oil exports from 2.5 million barrels per day in 2011 to below 500,000 at times. This forced countries like India and China to diversify supply sources.
Russia (2022 onwards): Restrictions on Russian oil exports shifted global flows. Europe turned to the Middle East, U.S., and Africa for crude, while Russia pivoted towards Asia, especially India and China, at discounted prices.
2. Supply Chain Disruptions
Sanctions on raw materials like metals, fertilizers, and agricultural goods affect industries worldwide. For example, restrictions on Russian nickel exports disrupted global electric vehicle supply chains.
3. Financial System Fragmentation
Banning banks from SWIFT, freezing assets, and blocking reserves push sanctioned nations to create alternative financial systems. Russia and China are now developing independent payment systems to reduce reliance on the U.S.-dominated dollar system.
4. Rise of Shadow Economies
Sanctions give rise to parallel networks: smuggling, barter trade, and gray markets. For instance, Iran exports oil via secretive shipping routes and barter deals with allies.
5. Geopolitical Realignments
Sanctions push targeted nations to build alliances with sympathetic powers. Russia has deepened ties with China, Iran, and other non-Western economies since 2022.
Winners and Losers in Global Markets
Winners
Alternative Suppliers: Countries not under sanctions often benefit by replacing banned exporters. U.S. LNG exporters gained when Europe shifted away from Russian gas.
Emerging Market Importers: Nations like India profited by buying discounted Russian oil.
Technology Providers Outside the West: Chinese firms gained market share in sanctioned countries.
Losers
Sanctioned Nations: Severe economic damage, isolation, and reduced growth.
Global Consumers: Higher prices for oil, food, and commodities.
Multinational Corporations: Western firms lost profitable markets due to compliance with sanctions.
Conclusion
Sanctions have become a defining feature of modern geopolitics and global economics. While they are intended to discipline nations and change state behavior, their effects are far-reaching and often unpredictable. They reshape supply chains, realign global alliances, alter energy markets, and push the world towards multipolar trade structures.
For sanctioned nations, survival often depends on adaptation, resilience, and finding alternative partners. For the global economy, sanctions create both winners and losers—emerging opportunities for some and severe disruptions for others.
Ultimately, the rise of sanctioned economies illustrates how deeply interconnected the world has become. Restricting one nation sends ripples across the globe, challenging businesses, governments, and consumers alike. As sanctions continue to evolve as tools of statecraft, the world may witness not only new divides but also creative new forms of cooperation and resistance in the international economic order.

The Domino EffectHow a Crisis in One Country Shakes Global Markets
Part 1: The Nature of Interconnected Global Markets
1.1 Globalization and Economic Interdependence
In earlier centuries, economies were relatively insulated. A banking collapse in one country might not ripple across the world. Today, however, globalization has created a tightly linked system. Goods made in China are consumed in Europe; oil produced in the Middle East powers factories in India; financial instruments traded in New York impact investors in Africa.
Trade linkages: A slowdown in one economy reduces demand for imports, hurting its trading partners.
Financial integration: Global banks and investors allocate capital worldwide. A collapse in one asset class often leads to capital flight elsewhere.
Supply chains: Modern production is fragmented globally. A crisis in one key hub can paralyze industries across continents.
1.2 Channels of Transmission
Economic shocks can travel across borders in several ways:
Financial contagion: Stock market crashes, banking failures, and currency collapses spread panic.
Trade disruptions: Falling demand in one country hurts exporters elsewhere.
Currency spillovers: Devaluation in one country pressures others to follow, creating competitive depreciation.
Investor psychology: Fear spreads faster than facts. When confidence erodes, investors often withdraw from risky markets en masse.
Part 2: Historical Case Studies of the Domino Effect
2.1 The Great Depression (1929–1930s)
The Wall Street Crash of 1929 began in the United States but soon plunged the entire world into depression. As U.S. banks collapsed and demand fell, countries that relied on exports to America suffered. International trade contracted by two-thirds, leading to widespread unemployment and social unrest worldwide.
2.2 The Asian Financial Crisis (1997–1998)
What began as a currency crisis in Thailand quickly spread across East Asia. Investors lost confidence, pulling money from Indonesia, South Korea, and Malaysia. Stock markets collapsed, currencies depreciated, and IMF bailouts followed. The crisis revealed how tightly emerging economies were linked through speculative capital flows.
2.3 The Global Financial Crisis (2008)
The U.S. subprime mortgage meltdown triggered the worst financial crisis since the Great Depression. Lehman Brothers’ collapse led to a global credit freeze. Banks in Europe, Asia, and elsewhere faced severe liquidity shortages. International trade shrank by nearly 12% in 2009, and stock markets around the world lost trillions in value. This crisis highlighted how financial products like mortgage-backed securities tied together banks worldwide.
2.4 The Eurozone Debt Crisis (2010–2012)
Greece’s debt problems quickly spread fears of contagion across Europe. Investors worried that Portugal, Spain, and Italy could face similar defaults. Bond yields soared, threatening the stability of the euro. The European Central Bank and IMF intervened, but not before global investors felt the tremors.
2.5 COVID-19 Pandemic (2020)
The pandemic began as a health crisis in Wuhan, China, but within weeks it disrupted the global economy. Supply chains broke down, trade collapsed, tourism stopped, and financial markets plunged. Lockdowns across the world triggered the sharpest economic contraction in decades, proving that non-economic crises can also trigger financial domino effects.
Part 3: Mechanisms of Global Transmission
3.1 Financial Markets as Shock Carriers
Capital is mobile. When investors fear losses in one country, they often pull funds from other markets too—especially emerging economies seen as risky. This creates a contagion effect, where unrelated economies suffer simply because they are perceived as similar.
3.2 Trade Dependency
Countries dependent on exports are especially vulnerable. For example, Germany’s reliance on exports to Southern Europe meant that the Eurozone debt crisis hit German factories hard. Similarly, China’s export slowdown during COVID-19 hurt suppliers in Southeast Asia.
3.3 Currency and Exchange Rate Volatility
When a major economy devalues its currency, trading partners may respond with devaluations of their own. This “currency war” creates global instability. During the Asian crisis, once Thailand devalued the baht, other Asian nations followed suit, intensifying the crisis.
3.4 Psychological & Behavioral Factors
Markets are not purely rational. Fear and panic amplify contagion. A crisis often leads to herding behavior, where investors sell assets simply because others are selling. This causes overshooting—currencies collapse more than fundamentals justify, worsening the crisis.
Part 4: The Role of Institutions in Crisis Management
4.1 International Monetary Fund (IMF)
The IMF often steps in to stabilize economies through emergency loans, as seen in Asia (1997) and Greece (2010). However, IMF policies sometimes attract criticism for imposing austerity, which can deepen recessions.
4.2 Central Banks and Coordination
During 2008, central banks across the world—like the Federal Reserve, European Central Bank, and Bank of Japan—coordinated interest rate cuts and liquidity injections. This collective action helped restore confidence.
4.3 G20 and Global Governance
The G20 emerged as a key crisis-management forum after 2008. By bringing together major economies, it coordinated stimulus measures and financial reforms. However, the effectiveness of such cooperation often depends on political will.
Part 5: Why Crises Spread Faster Today
Technology and speed: Information flows instantly through news and social media, fueling panic selling.
Complex financial instruments: Derivatives, swaps, and securitized assets tie banks and funds across borders.
Globalized supply chains: A factory shutdown in one country can halt production worldwide.
Dependence on capital flows: Emerging economies rely heavily on foreign investment, making them vulnerable to sudden outflows.
Part 6: Lessons and Strategies for Resilience
6.1 For Governments
Diversify economies to avoid overdependence on one sector or market.
Maintain healthy fiscal reserves to cushion shocks.
Strengthen banking regulations to reduce financial vulnerabilities.
6.2 For Investors
Recognize that diversification across countries may not always protect against global contagion.
Monitor global risk indicators, not just local markets.
Use hedging strategies to reduce currency and credit risks.
6.3 For International Institutions
Improve early-warning systems to detect vulnerabilities.
Promote coordinated responses to crises.
Reform global financial rules to prevent excessive risk-taking.
Part 7: The Future of Global Crisis Contagion
The next global crisis could emerge from many sources:
Climate change disruptions (floods, droughts, migration pressures).
Geopolitical conflicts (trade wars, regional wars, sanctions).
Technological disruptions (cyberattacks on financial systems).
Debt bubbles in emerging economies.
Given the growing complexity of global interdependence, crises will likely spread even faster in the future. The challenge is not to prevent shocks entirely—since they are inevitable—but to design systems that are resilient enough to absorb them without collapsing.
Conclusion
The domino effect in global markets is both a risk and a reminder of shared destiny. A crisis in one country can no longer be dismissed as “their problem.” Whether it is a banking failure in New York, a currency collapse in Bangkok, or a health crisis in Wuhan, the shockwaves ripple outward, reshaping the economic landscape for everyone.
Globalization has made economies interdependent, but also inter-vulnerable. The lessons from past crises show that cooperation, resilience, and adaptability are crucial. The domino effect may never disappear, but its destructive impact can be mitigated if nations, institutions, and investors act with foresight.
The world economy, like a row of dominoes, is only as strong as its weakest piece. Protecting that weakest link is the surest way to prevent the fall of all.

Gold as a Safe HavenWhy Global Investors Turn to Gold During Market Uncertainty
1. The Concept of a Safe Haven
A safe haven is an investment that retains or increases its value during periods of financial market stress or economic instability. Such assets offer investors protection against volatility, uncertainty, and systemic risks. Typical safe havens include:
Gold – A tangible store of value.
U.S. Treasury Bonds – Backed by the U.S. government.
Swiss Franc – A stable currency often seen as a hedge against global turmoil.
Japanese Yen – Another defensive currency.
Among these, gold stands out because it has both intrinsic value and historical precedent. Unlike currencies, which are tied to governments and central banks, gold is independent of political promises. Unlike corporate bonds or stocks, it doesn’t rely on business performance. This makes gold universally attractive as a hedge in uncertain times.
2. Historical Significance of Gold
To understand gold’s safe haven status, it is essential to trace its history:
a) Gold as Money
For thousands of years, gold served as money. From the Lydians minting the first gold coins in the 7th century BCE to the widespread use of gold coins across empires, gold became synonymous with value.
b) The Gold Standard
In the 19th and early 20th centuries, most economies adhered to the gold standard, where currencies were directly backed by gold. This system provided monetary stability, limiting inflation because money supply was tied to gold reserves.
c) End of the Gold Standard
In 1971, the U.S. under President Nixon abandoned the gold standard, ending the Bretton Woods system. Currencies became “fiat” (backed by government decree rather than physical assets). Despite this, gold’s importance didn’t vanish—it simply shifted from being official money to being a key hedge and investment asset.
d) Gold During Crises
Throughout history, gold prices have surged during crises:
During the Great Depression of the 1930s, gold was hoarded as banks collapsed.
In the 1970s, oil shocks and inflation pushed gold prices to record highs.
During the 2008 Global Financial Crisis, gold soared while equities collapsed.
In the COVID-19 pandemic (2020), gold hit record highs as markets plunged.
3. Why Investors Turn to Gold During Market Uncertainty
There are several reasons why gold is considered a safe haven:
a) Scarcity and Limited Supply
Gold cannot be created at will. Unlike paper money, central banks cannot print gold. Mining new gold is expensive and time-consuming, meaning supply growth is limited. This scarcity supports its long-term value.
b) Universal Acceptance
Gold is universally recognized across cultures and borders. Whether in Asia, Europe, Africa, or the Americas, gold carries intrinsic appeal. In times of crisis, this universal acceptance makes gold highly liquid and tradable.
c) Inflation Hedge
Gold is often seen as a hedge against inflation. When central banks print excessive money or when the purchasing power of currencies declines, gold tends to rise in value. For instance, in the 1970s, U.S. inflation soared, and so did gold prices.
d) Protection Against Currency Depreciation
When a country’s currency weakens, investors often shift to gold. For example, during the Eurozone debt crisis, European investors moved capital into gold to avoid potential currency collapses.
e) Store of Value in Geopolitical Turmoil
Wars, political instability, or trade tensions often trigger a flight to gold. During the Russia-Ukraine war (2022), investors flocked to gold, fearing disruptions in global trade and energy supplies.
f) Low Correlation with Other Assets
Gold has a low or even negative correlation with assets like equities and bonds. This means when markets fall, gold often rises, making it an excellent diversification tool in a portfolio.
4. Case Studies of Gold as a Safe Haven
a) The 2008 Financial Crisis
The collapse of Lehman Brothers and subsequent market meltdown saw investors rushing to gold. Between 2007 and 2011, gold prices nearly doubled, reaching $1,900 per ounce in 2011.
b) The COVID-19 Pandemic (2020)
As global markets crashed in March 2020, gold initially dipped due to liquidity demands but soon rallied to record highs above $2,000 per ounce by August 2020.
c) Inflationary Pressures (2021–2023)
With central banks printing trillions in stimulus, inflation spiked worldwide. Gold again acted as a hedge, maintaining strong demand despite rising interest rates.
5. How Investors Use Gold
Investors have multiple ways to gain exposure to gold:
Physical Gold – Bars, coins, jewelry (traditional and safe but involves storage costs).
Gold ETFs – Exchange-traded funds like SPDR Gold Trust (GLD) allow easy trading.
Gold Futures & Options – For traders seeking leveraged exposure.
Gold Mining Stocks – Companies engaged in gold production often benefit from rising prices.
Central Bank Reserves – Nations hold gold reserves as insurance against currency crises.
6. The Psychology of Gold Investment
Gold is not just a financial asset—it is deeply tied to human psychology. In uncertain times, people want something tangible and timeless. Unlike digital assets or government bonds, gold provides a sense of security rooted in thousands of years of human experience. This psychological factor explains why, even in modern times, gold demand rises sharply during market panic.
Conclusion
Gold’s enduring reputation as a safe haven asset stems from its scarcity, universal acceptance, ability to hedge against inflation and currency depreciation, and low correlation with other asset classes. History has repeatedly shown that during wars, recessions, financial crises, and inflationary spirals, gold protects wealth when other assets fail.
Although gold is not without limitations—it generates no yield and can be volatile—it remains one of the most trusted hedges against uncertainty. In an era of rising global instability, central bank money printing, and volatile equity markets, the ancient allure of gold is unlikely to fade.
For investors seeking stability in an uncertain world, gold continues to glitter as the ultimate safe haven.

International Trade Week – Analysis & Insights1. The Concept and Relevance of International Trade Week
International Trade Week is often hosted by governments, international organizations, and trade promotion bodies to bring together stakeholders across the global trade ecosystem. It includes panel discussions, workshops, exhibitions, and networking opportunities, where thought leaders share insights about trade flows, barriers, and innovations.
Its relevance lies in three primary dimensions:
Global Trade Interdependence – Today’s world is interconnected. From microchips made in Taiwan to textiles from Bangladesh and crude oil from the Middle East, every economy relies on imports and exports. ITW recognizes this interdependence and creates a collaborative environment.
Policymaking and Regulation – Trade is shaped by laws, tariffs, and treaties. Governments use ITW as a platform to communicate policy shifts and reassure investors and businesses.
Innovation and Opportunities – Trade is no longer limited to physical goods. Services, intellectual property, and digital platforms dominate the 21st century. ITW offers a window into new-age opportunities, including e-commerce, fintech, and sustainability-driven trade practices.
By bringing together diverse participants—from multinational corporations (MNCs) to small exporters—ITW acts as a bridge between aspiration and execution in international trade.
2. A Historical Perspective: Evolution of Global Trade
Understanding International Trade Week also means looking at the evolution of global trade itself.
Early Exchanges (Silk Road & Spice Routes): Ancient trade routes such as the Silk Road and maritime spice routes connected civilizations. These exchanges were as much about culture as they were about goods.
Colonial Trade (15th–19th Century): European colonial powers expanded global trade networks, often exploiting colonies for raw materials and markets. This era set the foundation for the global economic order.
Post-War Reconstruction (20th Century): After WWII, institutions like the General Agreement on Tariffs and Trade (GATT) and later the World Trade Organization (WTO) were created to ensure fair and open trade.
21st Century (Digital & Fragmented Trade): Today, trade is shaped by supply chain networks, technology, and geopolitics. The rise of China, regional trade agreements (RCEP, CPTPP, USMCA), and digital commerce show how trade continues to evolve.
International Trade Week acknowledges this historical journey, reminding participants that trade has always been dynamic, responding to power shifts, technological progress, and social needs.
3. Key Themes of International Trade Week
Every edition of International Trade Week usually focuses on specific themes that reflect the challenges and opportunities of the moment. While these themes vary by host country or organizer, some recurring topics include:
a) Resilient Supply Chains
The COVID-19 pandemic exposed the vulnerabilities of global supply chains. ITW sessions emphasize strategies like diversification, regionalization, and digital supply chain management.
b) Digital Trade & E-Commerce
With Amazon, Alibaba, and Shopify reshaping consumer behavior, ITW explores how digitalization is breaking down trade barriers and empowering small businesses to sell globally.
c) Sustainability & Green Trade
Sustainable trade practices, carbon border taxes, renewable energy, and ESG (environmental, social, governance) frameworks dominate discussions. Trade is increasingly tied to climate responsibility.
d) SMEs and Inclusive Trade
While multinational corporations dominate global exports, SMEs are crucial for job creation. ITW highlights financing, capacity building, and digital tools to help SMEs go global.
e) Geopolitics & Trade Wars
From the U.S.–China trade tensions to Brexit, geopolitics often disrupt trade flows. ITW provides a platform to address these issues diplomatically and pragmatically.
4. Economic Insights: The Impact of Trade on Economies
Trade is not an abstract concept; it directly affects jobs, prices, wages, and economic growth. During ITW, economists often present data-driven insights to show how trade shapes economies.
GDP Growth: Countries that embrace trade generally grow faster. For instance, export-oriented economies like South Korea and Vietnam have shown strong growth.
Employment: Trade-intensive industries provide millions of jobs. However, automation and offshoring can also displace workers, raising concerns of inequality.
Inflation Control: Imports can keep inflation in check by offering cheaper alternatives. But over-reliance on imports can expose economies to global shocks.
Innovation Transfer: Trade encourages technological adoption. Developing countries benefit from importing advanced machinery, while developed nations access new markets.
Economic models discussed at ITW reinforce the idea that balanced trade policies drive long-term prosperity.
5. Geopolitics and Trade Diplomacy
Trade cannot be separated from geopolitics. ITW sessions often feature diplomats and strategists who emphasize how global power dynamics shape commerce.
US–China Rivalry: The trade war between the U.S. and China reshaped global supply chains, pushing companies to adopt a “China+1” strategy.
Regional Trade Agreements (RTAs): Agreements like the EU Single Market, RCEP (Asia-Pacific), and CPTPP are creating trade blocs that bypass WTO stagnation.
Sanctions & Trade Barriers: Sanctions on countries like Russia and Iran illustrate how geopolitics directly impact trade.
Emerging Markets: Nations like India, Indonesia, and Brazil are being courted as alternative trade partners amid shifting alliances.
International Trade Week discussions often stress that diplomacy and trade are intertwined, and businesses must be agile in navigating these complexities.
6. Technology and Digital Trade
Perhaps the most transformative theme in recent ITW events has been technology.
Blockchain in Trade: Enhances transparency and traceability in supply chains, reducing fraud.
Artificial Intelligence (AI): Predicts demand patterns, optimizes logistics, and supports cross-border compliance.
Fintech & Trade Finance: Digital payments and blockchain-based financing reduce costs for SMEs.
Digital Platforms: Marketplaces allow even the smallest entrepreneur to reach global customers.
By showcasing case studies and startups, ITW emphasizes that digitalization is not a distant future—it is already redefining how trade works today.
7. Sustainability and the Future of Green Trade
One of the strongest insights from ITW is the link between trade and climate responsibility. With carbon emissions and environmental degradation becoming urgent issues, trade policies are being reshaped.
Carbon Border Adjustment Mechanisms (CBAM): The EU, for example, taxes imports based on carbon footprints.
Sustainable Supply Chains: Companies are expected to ensure responsible sourcing (e.g., conflict-free minerals, ethical textiles).
Green Technologies: Renewable energy products, electric vehicles, and eco-friendly goods are becoming trade growth drivers.
Global Cooperation: ITW emphasizes that sustainability in trade requires collective action, not isolated efforts.
8. Role of SMEs and Inclusive Growth
Small and medium enterprises (SMEs) often struggle to compete with global giants due to limited resources. Yet, they are the backbone of most economies.
ITW highlights policies such as:
Easier access to trade finance.
Training programs to improve export readiness.
Digital tools to reach international buyers.
Public–private partnerships to support SME participation in trade fairs.
Inclusive trade ensures that globalization does not just benefit large corporations but uplifts grassroots entrepreneurs as well.
9. Challenges in International Trade
While ITW celebrates opportunities, it also brings attention to challenges:
Protectionism: Countries imposing tariffs and quotas to shield domestic industries.
WTO Deadlock: The WTO’s inability to resolve disputes weakens global trade governance.
Digital Divide: Not all countries have equal access to digital infrastructure, creating imbalances.
Environmental Concerns: Trade expansion sometimes worsens ecological damage if not regulated.
Global Shocks: Pandemics, wars, and natural disasters disrupt supply chains.
These challenges remind stakeholders that progress in trade requires continuous adaptation.
10. Case Studies from International Trade Week
During ITW, real-world examples highlight successes and failures:
UK Trade Week 2023: Focused on post-Brexit trade diversification, encouraging SMEs to explore markets outside Europe.
Singapore’s Trade Dialogues: Emphasized digital trade corridors across ASEAN.
African Continental Free Trade Area (AfCFTA): Case studies showed how intra-African trade could unlock massive growth if infrastructure and regulations align.
Such case studies turn theory into actionable insights for businesses and policymakers.
11. Future Outlook of International Trade
Looking ahead, several trends are likely to dominate ITW discussions:
Multipolar Trade World: With the rise of Asia, Africa, and Latin America, trade will no longer be West-centric.
Digital & AI-Driven Commerce: Data will become as valuable as goods in trade.
Resilient Regional Supply Chains: “Friend-shoring” and nearshoring will increase.
Green Protectionism: Environmental rules will reshape competitive advantages.
Inclusive Globalization: Pressure will grow to ensure trade benefits are shared fairly.
12. Conclusion
International Trade Week is not just a ceremonial event—it is a mirror reflecting the state of global commerce and a compass pointing toward future directions. It encapsulates history, geopolitics, economics, and innovation in one platform. By analyzing themes like digitalization, sustainability, and inclusivity, ITW helps stakeholders prepare for a future where trade is more complex but also more opportunity-driven than ever before.
Ultimately, International Trade Week reminds us that trade is not about borders, but about connections. In an era where globalization faces both skepticism and necessity, ITW stands as a beacon for dialogue, cooperation, and shared prosperity.
Risk vs Reward: How Positional Traders Manage Market SwingsChapter 1: The Nature of Positional Trading
1.1 Defining Positional Trading
Positional trading is a strategy where traders hold positions for extended periods, often ranging from several weeks to several months, with the goal of capturing larger price movements. Unlike intraday or swing traders, positional traders are less concerned with short-term noise. Instead, they rely on broader fundamental themes, technical trends, and macroeconomic cycles.
1.2 Characteristics of Positional Trading
Time Horizon: Longer than swing trading but shorter than long-term investing.
Analysis: Combination of technical indicators (trendlines, moving averages, volume profile) and fundamental analysis (earnings, global events, monetary policy).
Risk Tolerance: Moderate to high, since positions are exposed to overnight and weekend risks.
Capital Allocation: Positions are often larger than swing trades, requiring strict risk management.
1.3 Why Traders Choose Positional Trading
Ability to capture big moves in trending markets.
Lower stress compared to day trading (fewer trades, less screen time).
Flexibility to balance trading with other commitments.
Opportunity to benefit from structural themes such as interest rate cycles, technological disruptions, or geopolitical developments.
Chapter 2: The Core Principle – Risk vs Reward
2.1 Understanding Risk
In trading, risk is not just the possibility of losing money—it also includes the uncertainty of outcomes. For positional traders, risk manifests as:
Price Volatility: Sudden swings due to earnings reports, macroeconomic data, or geopolitical events.
Gap Risk: Overnight or weekend news causing sharp market gaps.
Trend Reversal: A strong uptrend suddenly turning bearish.
Opportunity Cost: Capital locked in a stagnant trade while better opportunities emerge elsewhere.
2.2 Understanding Reward
Reward refers to the potential gain a trader expects from a trade. For positional traders, rewards typically come from:
Riding long-term trends (e.g., a bullish rally in technology stocks).
Capturing multi-month breakouts in commodities or currencies.
Benefiting from sectoral rotations where capital shifts between industries.
2.3 The Risk-Reward Ratio
A foundational tool for positional traders is the risk-reward ratio (RRR), which compares potential profit to potential loss. For example:
If a trader risks ₹10,000 for a possible gain of ₹30,000, the RRR is 1:3.
A higher RRR ensures that even if several trades go wrong, a few winning trades can offset losses.
Most positional traders aim for a minimum of 1:2 or 1:3 risk-reward ratios to sustain profitability.
Chapter 3: Market Swings – The Double-Edged Sword
3.1 What Are Market Swings?
Market swings refer to sharp upward or downward price movements over short to medium periods. They are caused by factors like:
Earnings surprises
Central bank announcements
Political instability
Global commodity price shocks
Investor sentiment shifts
3.2 Friend or Foe?
For positional traders, market swings can be:
Friend: Accelerating profits when positioned correctly.
Foe: Triggering stop-losses and eroding capital when caught off-guard.
3.3 The Positional Trader’s Dilemma
Market swings often force traders into a psychological tug-of-war:
Should they hold through volatility in hopes of a larger trend?
Or should they exit early to preserve gains?
The right answer depends on risk appetite, conviction in analysis, and adherence to strategy.
Chapter 4: Tools of Risk Management
4.1 Stop-Loss Orders
The most basic and effective tool for limiting downside risk.
Hard Stop-Loss: A predefined price level where the position is exited.
Trailing Stop-Loss: Moves upward (or downward in shorts) as the trade becomes profitable, locking in gains while allowing room for continuation.
4.2 Position Sizing
Deciding how much capital to allocate per trade is crucial. A common rule is risking no more than 1-2% of total capital on a single trade. This prevents a single loss from wiping out the account.
4.3 Diversification
Holding positions across different asset classes or sectors reduces exposure to idiosyncratic risks. For example, combining technology stocks with commodity trades.
4.4 Hedging
Advanced positional traders may use options, futures, or inverse ETFs to hedge risks. For instance, buying protective puts while holding long equity positions.
4.5 Patience and Discipline
No tool is more important than discipline. Sticking to pre-defined plans and resisting the urge to overreact to market noise often separates successful traders from the rest.
Chapter 5: Strategies to Maximize Reward
5.1 Trend Following
Using moving averages, MACD, or ADX to identify strong directional trends.
Entering trades in alignment with the broader trend rather than against it.
5.2 Breakout Trading
Entering trades when an asset breaks through a key resistance or support level with high volume.
Positional traders often ride multi-month breakouts.
5.3 Fundamental Catalysts
Aligning trades with earnings cycles, government policies, or macroeconomic themes.
Example: Investing in renewable energy stocks during a policy push for green energy.
5.4 Sector Rotation
Shifting positions as capital flows between sectors.
Example: Moving from banking to IT during periods of rate cuts.
5.5 Pyramid Positioning
Adding to winning trades gradually as trends confirm themselves.
Ensures exposure grows only when the market supports the thesis.
Chapter 6: Psychology of Positional Trading
6.1 The Fear of Missing Out (FOMO)
Traders often chase after rallies late, increasing risk. Successful positional traders resist this urge and wait for setups aligned with their strategies.
6.2 Greed vs. Discipline
Holding too long for extra gains can turn profits into losses. Discipline ensures profits are booked systematically.
6.3 Handling Drawdowns
Market swings inevitably lead to losing streaks. Accepting drawdowns as part of the journey helps maintain mental balance.
6.4 Patience as a Weapon
Unlike day traders, positional traders must often endure long periods of stagnation before trends materialize. Patience is not passive—it is an active tool in their arsenal.
Chapter 7: Lessons for Traders and Investors
Risk is inevitable but manageable – Market swings cannot be eliminated, but tools like stop-losses and diversification reduce their impact.
Reward requires patience – Larger profits are earned by holding through volatility, not by constantly jumping in and out.
Discipline beats prediction – Following rules matters more than correctly forecasting every swing.
Adaptability is key – Global events can shift markets suddenly; traders must be flexible.
Psychology is half the battle – A calm, patient mindset sustains traders through market storms.
Conclusion
Positional trading is not about avoiding market swings—it is about managing them. Every swing presents both a threat and an opportunity. The difference lies in how traders handle them. Those who respect risk, apply disciplined strategies, and patiently wait for reward tend to emerge stronger, while those swayed by fear, greed, or impulsiveness often fall behind.
The essence of risk vs reward in positional trading is best captured as a dance: risk sets the rhythm, reward provides the melody, and discipline keeps the trader moving in sync. In a world where markets will always swing—sometimes violently—the art lies not in predicting every move but in managing exposure, aligning with trends, and staying calm in the face of uncertainty.
For anyone seeking to thrive as a positional trader, the golden rule remains: protect your downside, and the upside will take care of itself.
Steel, Copper & Gold: How Metals Shape the World EconomyPart I: The Historical Significance of Metals
1. Steel – From Iron Age to Industrial Age
Steel is essentially an alloy of iron and carbon, but its strength, flexibility, and affordability made it the single most important material of industrialization. The Iron Age (1200 BCE onwards) marked the beginning of metal-based economies, but it was the Bessemer process in the 19th century that revolutionized mass steel production.
Railways, bridges, and mechanized factories in Europe and the U.S. became possible because of steel.
Steel transformed warfare too, with stronger weapons, tanks, and ships.
By the 20th century, steel became synonymous with industrial power — countries with steel plants were considered modern and competitive.
2. Copper – The First Metal of Civilization
Copper has been used for over 10,000 years. Early civilizations like Mesopotamia and Egypt valued copper for tools, ornaments, and trade. The Bronze Age (3300–1200 BCE) began when humans mixed copper with tin to create bronze, a much stronger alloy that reshaped weapons, farming tools, and art.
In modern times, copper’s true value emerged with electrification. When Edison’s light bulb lit up cities in the late 19th century, copper wiring carried electricity to homes and industries. Today, no city, smartphone, or solar panel can function without copper.
3. Gold – The Eternal Store of Value
Gold has fascinated humankind for millennia. Ancient Egyptians called it the “flesh of the gods.” Unlike steel or copper, gold’s significance is less industrial and more financial, cultural, and symbolic.
Ancient empires minted gold coins as currency.
The Gold Standard of the 19th and 20th centuries tied currencies to gold reserves, stabilizing global trade.
Today, central banks hold gold as reserves to secure financial stability.
In times of crisis, investors flock to gold as a safe haven, making it a “crisis commodity.”
Thus, while steel built industries and copper electrified societies, gold secured economies through trust and value.
Part II: Metals in the Modern Global Economy
1. Steel – The Industrial Backbone
Modern steelmaking revolves around blast furnaces and electric arc furnaces. The top steel producers today are China, India, Japan, the U.S., and Russia.
Steel consumption directly reflects economic growth:
When countries urbanize, steel demand spikes.
China’s meteoric rise after 2000 was fueled by massive steel consumption in real estate, infrastructure, and manufacturing.
India, as of the 2020s, is following a similar path, with steel demand tied to roads, housing, and railways.
Global Trade:
Steel is traded as finished products (like rolled sheets, pipes) and raw material (iron ore).
The iron ore–steel connection links mining in Australia and Brazil to steel mills in China and India.
2. Copper – The Wiring of Globalization
Copper is indispensable for electricity, transport, and electronics. With the rise of renewable energy and electric vehicles (EVs), copper demand has surged:
An electric car uses nearly 4x more copper than a conventional car.
Solar and wind farms need miles of copper cabling to connect to grids.
Data centers and 5G networks run on copper infrastructure.
Major Producers: Chile, Peru, China, and the Democratic Republic of Congo dominate global copper production. The trade network connects South America’s mines with smelters and industries in Asia, particularly China.
3. Gold – A Monetary Anchor
Gold’s role in the modern economy is very different from steel or copper:
Central banks (like the U.S. Federal Reserve, the European Central Bank, and the Reserve Bank of India) hold gold as part of their foreign exchange reserves.
Investment demand (ETFs, bullion, jewelry) drives gold prices.
In geopolitics, gold is a hedge against sanctions or currency collapse. For example, Russia increased gold reserves heavily after 2014 to reduce dependence on the U.S. dollar.
Gold’s global demand is divided into three parts:
Jewelry (especially in India, China, and the Middle East).
Investment (bars, coins, ETFs).
Central bank reserves.
Part III: Price Dynamics & Market Behavior
1. Steel Market Cycles
Steel prices depend on construction, auto manufacturing, and global growth. Prices crash during recessions (e.g., 2008, 2020 pandemic) and rise during recovery or infrastructure booms. Trade wars, tariffs, and overcapacity (especially from China) often distort global steel trade.
2. Copper – The “Doctor Copper” Indicator
Copper is famously called “Doctor Copper” because its prices reflect the health of the world economy.
When industries expand, copper demand rises, pushing prices up.
A slowdown in construction, manufacturing, or electronics drags copper prices down.
For instance, the copper price boom of 2003–2011 reflected China’s growth, while the slump of 2014–2016 signaled slowing global demand.
3. Gold – The Crisis Barometer
Gold prices often move opposite to risk assets:
During crises (financial crashes, wars, pandemics), gold rises as investors seek safety.
When economies stabilize, gold prices dip as money flows back into stocks and bonds.
For example, gold surged above $2,000/oz during the COVID-19 crisis and during geopolitical tensions in 2022–23.
Part IV: Geopolitical & Strategic Importance
1. Steel – A Weapon of Trade & Security
Nations often protect their steel industries through tariffs and subsidies, seeing it as a matter of national security. A country without steel plants risks dependence on imports for defense, infrastructure, and industrialization.
2. Copper – The New Oil of the Green Era
As the world transitions to clean energy, copper is being compared to “the new oil.” Whoever controls copper mines and supply chains will dominate renewable energy and EV industries. This has made regions like Latin America and Africa strategic hotspots for global powers.
3. Gold – The Silent Power of Reserves
Gold allows countries to reduce reliance on the U.S. dollar. The BRICS nations (Brazil, Russia, India, China, South Africa) have steadily increased gold holdings, signaling a shift in global financial power.
Part V: The Future of Metals
1. Steel – Towards Green Steel
The steel industry is one of the largest emitters of CO₂. With climate change pressures, countries are investing in green steel (produced using hydrogen instead of coal). Europe, Japan, and India are testing pilot projects that could transform steel into a low-carbon industry.
2. Copper – Supply Crunch Ahead
The International Energy Agency (IEA) warns of a possible copper shortage by 2030, as demand from EVs and renewable energy outpaces supply. This could lead to new mining projects, recycling innovations, and geopolitical competition.
3. Gold – Digital Age Relevance
While Bitcoin and digital assets challenge gold as a “store of value,” gold remains unmatched in stability and trust. In fact, central banks are buying more gold, suggesting it will remain critical in global finance for decades.
Conclusion
Steel, copper, and gold are more than just metals; they are pillars of the global economy.
Steel builds our cities, cars, and industries.
Copper powers our homes, gadgets, and future green technologies.
Gold protects our wealth and anchors global finance.
Each metal has a unique story — steel as the backbone of industrialization, copper as the lifeline of electrification, and gold as the eternal symbol of value. Together, they reflect the intersection of economics, technology, and geopolitics.
As the 21st century unfolds, these three metals will continue shaping the destiny of nations, guiding industrial revolutions, and influencing financial systems. The world economy, in many ways, is still forged, wired, and secured by steel, copper, and gold.

The Great Global Market ShiftHow Power is Moving from West to East
Introduction
For centuries, global economic power has largely been concentrated in the West—first in Europe during the age of colonial empires, and later in the United States, which emerged as the world’s dominant economic and political power after World War II. But in recent decades, the world has begun to witness a profound shift: the rise of the East, particularly Asia, as the new center of gravity in global markets. This transformation, often described as the “Great Global Market Shift,” is reshaping international trade, investment flows, innovation ecosystems, and geopolitical influence.
The rise of the East is not a sudden event, but a gradual process fueled by economic reforms, demographic advantages, technological adoption, and the strategic reorganization of global supply chains. Countries such as China, India, and members of the ASEAN bloc are increasingly driving global growth, challenging the historical dominance of the West. This shift is not just economic but also geopolitical, influencing everything from trade alliances to cultural exports, from global governance structures to the balance of military power.
In this essay, we will explore the dynamics of this market shift in detail. We will analyze its causes, trace its trajectory, examine key case studies, and understand its far-reaching implications for the global economy.
Historical Context: The West’s Dominance
To understand the present, we need to revisit the past. The rise of Western dominance began during the 16th century with European exploration and colonization. Nations like Spain, Portugal, Britain, and France established vast colonial empires that extracted resources from Asia, Africa, and the Americas. Europe’s industrial revolution in the 18th and 19th centuries accelerated this dominance, enabling Western nations to control global trade routes and technological development.
By the early 20th century, Europe had established itself as the hub of finance, manufacturing, and trade. After World War II, however, the United States replaced Europe as the epicenter of global economic power. With institutions like the World Bank, IMF, and the United Nations heavily influenced by U.S. and European leadership, the post-war order reinforced Western economic hegemony.
Yet, the seeds of change were already being planted. Japan’s rapid rise in the post-war era, followed by the emergence of the “Asian Tigers” (South Korea, Taiwan, Hong Kong, and Singapore), hinted at the possibility of a power rebalancing. The real inflection point came in the late 20th century when China embraced market reforms, and India liberalized its economy in 1991. These reforms unleashed massive growth that is now reshaping the global economy.
The Economic Rise of Asia
China: The Powerhouse of the East
China’s transformation is perhaps the most significant story of the global shift. From a closed agrarian economy in the 1970s, China has become the world’s second-largest economy and a manufacturing giant. Its Belt and Road Initiative (BRI) is redrawing global infrastructure networks, while its technological advances in 5G, AI, and green energy are positioning it as a global innovation hub.
China’s ascent challenges U.S. dominance in trade, technology, and even finance. The Chinese yuan is increasingly being used in international transactions, and institutions like the Asian Infrastructure Investment Bank (AIIB) present alternatives to Western-dominated structures.
India: The Emerging Giant
India’s growth story is equally compelling. With a massive young population, a thriving IT sector, and rapid digitalization, India is on track to become the world’s third-largest economy. Its role as a services hub complements China’s manufacturing strength, creating a dual-engine growth model for Asia. India’s participation in global supply chain diversification strategies further strengthens its importance in the new order.
ASEAN: The Rising Bloc
The Association of Southeast Asian Nations (ASEAN) represents another key pillar in the East’s rise. Countries like Vietnam, Indonesia, and Malaysia are becoming manufacturing and trade hubs, benefiting from “China+1” strategies as global firms seek to reduce dependency on China. The Regional Comprehensive Economic Partnership (RCEP), the world’s largest trade bloc, reinforces ASEAN’s centrality in the new global order.
Japan and South Korea: Technology Leaders
Japan and South Korea remain indispensable players in the global economy, particularly in advanced technology, semiconductors, and automobiles. They contribute heavily to the region’s innovation landscape and provide strategic balance in Asia’s geopolitical and economic dynamics.
Key Drivers of the Market Shift
1. Demographic Advantage
Western nations, especially Europe and Japan, face aging populations and declining birth rates. In contrast, many Asian economies—India, Indonesia, Vietnam, and the Philippines—enjoy a demographic dividend, with large young workforces fueling growth and consumption.
2. Economic Reforms and Liberalization
Market reforms in China, India, and other Asian economies opened their markets to foreign investment, unleashed entrepreneurship, and facilitated rapid industrialization.
3. Technological Leapfrogging
Asia has been able to leapfrog technological barriers. From mobile payments in China to digital public infrastructure in India (like UPI), the East is innovating at scale, often faster than the West.
4. Infrastructure Development
Massive investments in infrastructure, both domestic and cross-border, have created robust trade networks. China’s BRI and India’s connectivity projects are reshaping global trade routes.
5. Supply Chain Realignment
Geopolitical tensions and the COVID-19 pandemic exposed vulnerabilities in Western supply chains. This accelerated the diversification of production to Asia, further consolidating its role as the world’s factory.
Geopolitical Implications
The economic shift is not occurring in isolation. It is accompanied by a rebalancing of geopolitical power.
U.S.-China Rivalry: The competition between the U.S. and China spans trade, technology, military, and ideology. This rivalry defines much of today’s global political economy.
Regional Alliances: New alliances like RCEP and the Shanghai Cooperation Organization (SCO) are strengthening intra-Asian cooperation.
Global Governance: Asian countries are demanding a greater voice in institutions like the IMF and World Bank, challenging Western dominance.
Energy & Resources: Asia is the largest consumer of global energy, driving new resource partnerships in Africa, the Middle East, and Latin America.
The Role of Finance and Capital
Asia is no longer just a destination for Western capital—it is increasingly a source. Sovereign wealth funds from Singapore, China, and the Middle East are major global investors. Asian stock markets, particularly in Shanghai, Hong Kong, and Mumbai, are gaining prominence. The rise of digital financial platforms further accelerates capital flows within and beyond Asia.
Challenges and Constraints
The East’s rise, however, is not without hurdles:
Geopolitical Tensions: Border disputes, maritime conflicts, and great power rivalries create instability.
Internal Inequalities: Rapid growth has widened income disparities within countries.
Environmental Concerns: Industrialization has led to pollution and resource strain.
Governance Models: Differences in political systems (authoritarian vs democratic) pose challenges for global cooperation.
Implications for the West
For the West, the shift presents both challenges and opportunities. Western economies risk losing influence in trade, finance, and innovation if they fail to adapt. At the same time, partnerships with Asia can create mutual growth opportunities. The West must focus on innovation, renewable energy, and fairer trade practices to remain competitive.
The Future of Global Markets
Looking ahead, the world is moving toward a multipolar economic order. The West will remain powerful, but Asia’s influence will continue to expand. By 2050, it is projected that Asia could account for more than half of global GDP, with China and India as the leading economies.
The key will be how the world manages this transition—whether through cooperation or conflict. A collaborative approach could create a more balanced and inclusive global economy. A confrontational approach, on the other hand, could lead to fragmentation and instability.
Conclusion
The Great Global Market Shift from West to East is one of the most defining transformations of our time. It is altering not just economic power but also cultural influence, geopolitical dynamics, and global governance. While challenges remain, the rise of the East is undeniable, and it offers opportunities for new forms of cooperation and prosperity.
History has shown that power shifts are often turbulent, but they also open the door to innovation and progress. The task ahead for policymakers, businesses, and societies worldwide is to navigate this transition wisely—balancing competition with cooperation, and ensuring that the benefits of this shift are shared globally.

How Blockchain Could Create a Single Global Marketplace1. The Current Global Marketplace: Fragmented and Inefficient
Despite globalization, today’s international trade and commerce remain highly fragmented:
Multiple currencies → Every country has its own currency, requiring foreign exchange conversion, leading to costs, delays, and risks.
Intermediaries → Payment processors, banks, brokers, and logistics middlemen increase costs.
Trust issues → Buyers and sellers often don’t know each other, so they rely on third-party verification.
Inefficient supply chains → Tracking goods across borders is complex, slow, and prone to fraud.
Regulatory fragmentation → Every country enforces its own trade, tax, and compliance rules.
As a result, cross-border trade is expensive, slow, and sometimes inaccessible for small businesses or individuals. The dream of a truly globalized marketplace remains incomplete.
2. Blockchain’s Core Features and Why They Matter
Blockchain brings several unique features that directly solve the inefficiencies of global commerce:
Decentralization → No single authority controls the ledger, allowing peer-to-peer trade without middlemen.
Transparency → Transactions are visible and verifiable, reducing fraud.
Immutability → Once recorded, data cannot be tampered with, ensuring trust.
Smart contracts → Self-executing agreements automate business logic like payments or delivery confirmations.
Tokenization → Physical or digital assets can be represented as tokens, enabling easy trading.
Borderless payments → Cryptocurrencies and stablecoins allow instant cross-border value transfer.
Together, these features create the foundation for a single, borderless, digital-first marketplace.
3. Building Blocks of a Global Blockchain Marketplace
To understand how blockchain could unify the world economy, let’s break down the key pillars:
a) Universal Digital Currency
The first step is borderless payments. Cryptocurrencies like Bitcoin, Ethereum, and especially stablecoins pegged to fiat currencies already allow instant international transfers.
No need for currency exchange.
Settlement in seconds, not days.
Lower fees compared to SWIFT, Visa, or PayPal.
For example, a freelancer in India can receive payment from a U.S. client in USDT (a dollar-pegged stablecoin) instantly, bypassing banks and high remittance costs.
b) Tokenized Assets
Almost anything — from gold and real estate to art and stocks — can be represented as digital tokens on blockchain. Tokenization creates:
Fractional ownership → Anyone can buy a piece of expensive assets.
Liquidity → Assets can be traded globally without geographic restrictions.
Inclusivity → Small investors can access markets previously reserved for the wealthy.
This democratization of assets is crucial for a true global marketplace.
c) Smart Contracts for Automation
Smart contracts remove the need for trust between strangers. For example:
An exporter ships goods → smart contract releases payment automatically once delivery is confirmed.
A digital service provider delivers work → contract triggers instant payment.
This eliminates disputes, delays, and dependency on lawyers or courts.
d) Decentralized Marketplaces
Blockchain enables decentralized platforms where buyers and sellers connect directly. Examples include:
OpenBazaar (past experiment) → A peer-to-peer marketplace.
Uniswap & decentralized exchanges → Peer-to-peer asset trading.
NFT platforms → Direct artist-to-buyer transactions.
Such platforms reduce fees, censorship, and reliance on corporate intermediaries like Amazon or eBay.
4. Potential Benefits of a Single Global Blockchain Marketplace
1. Inclusivity and Financial Access
Currently, 1.4 billion people remain unbanked (World Bank data). Blockchain wallets give anyone with a smartphone access to global trade and finance.
2. Lower Costs
Cutting out intermediaries means cheaper remittances, payments, and trading. Cross-border remittance costs can drop from 7% to less than 1%.
3. Faster Transactions
International settlements that take days (via SWIFT) can be done in seconds.
4. Trust Without Middlemen
Blockchain’s transparency and immutability allow strangers across the globe to transact securely.
5. Global Liquidity and Market Access
Tokenization enables markets to operate 24/7, allowing capital and goods to move freely without geographic barriers.
6. Economic Empowerment
Small businesses, freelancers, and creators in emerging economies can access global customers directly, without dependence on banks or corporate platforms.
5. Real-World Use Cases
1. Cross-Border Payments
Companies like Ripple (XRP) and Stellar (XLM) are already enabling fast, cheap international transfers.
2. Supply Chain Management
IBM’s Food Trust blockchain allows tracking food from farm to supermarket, ensuring authenticity.
3. Decentralized Finance (DeFi)
Platforms like Aave or Compound let users lend/borrow globally without banks.
4. E-Commerce and Retail
Decentralized marketplaces allow direct buyer-seller trade. Imagine an Amazon alternative run on blockchain where sellers keep more profit.
5. NFTs and Creator Economy
Artists, musicians, and game developers can sell directly to global audiences using NFTs, bypassing labels or publishers.
6. Tokenized Real Estate
Platforms like Propy enable property sales on blockchain, making international real estate investments accessible.
6. The Role of Governments and Institutions
For a global blockchain marketplace to succeed, governments and institutions must play a role:
Global regulatory frameworks → To ensure safety while enabling innovation.
Central Bank Digital Currencies (CBDCs) → Countries like China, India, and the EU are developing CBDCs that could integrate with blockchain.
Public-private partnerships → Collaboration between regulators, banks, and blockchain firms to ensure trust.
Eventually, a hybrid system may emerge where CBDCs and decentralized platforms coexist, bridging traditional finance with blockchain.
7. Conclusion
Blockchain holds the potential to transform our fragmented, inefficient global economy into a single, unified marketplace where trade flows freely, securely, and inclusively. By combining borderless payments, tokenized assets, smart contracts, and decentralized platforms, blockchain eliminates the barriers of trust, geography, and cost.
Challenges remain — regulation, scalability, and adoption — but with growing institutional interest, technological improvements, and grassroots adoption, the path to a global blockchain-powered economy is clearer than ever.
The question is no longer “if”, but “when” blockchain will reshape the world economy. When that happens, trade will not just be global — it will be truly universal.
Wave 3 Dynamics: Understanding the Most Powerful WaveHello Friends, Welcome to RK_Chaarts,
For Learning and Practicing chart Analyzing, Today we are trying to Analyse the State Bank of India (SBIN) chart from an Elliott Wave perspective, we can see that the intermediate-degree Wave (3) completed at the June 2024 high. This was followed by a complex correction that ended at the March 2025 low, marking the completion of Wave (4).
We are currently unfolding Wave (5), which will complete the higher-degree Wave ((3)) of Primary degree in black. Within Wave (5), we have five minor-degree subdivisions, which we can see unfolding.
The first minor-degree Wave 1 completed at the 22nd April 2025 high, followed by a Wave 2 correction that ended at the May 9, 2025 low. We are currently in Wave 3, which is a dynamic wave with strong momentum.
Within Wave 3, we have five minute-degree subdivisions, which are unfolding. The first two subdivisions are complete, and we are currently in the third subdivision.
The characteristics of Wave ((iii)) of 3 are evident in the price action, with a strong breakout above the resistance trend line and good intensity of volumes. The Moving Convergence Divergence (MACD) is also positive, and the Relative Strength Index (RSI) is above 60, indicating strong momentum.
The daily Exponential moving averages (50 and 200) are also aligned in favor of the trend. All these parameters support our view, and we can see an inverted head-and-shoulders pattern or a double rounding bottom pattern unfolding.
Overall, the breakout looks promising, and we can expect further upside in SBIN as per Elliott wave theory.
Detailed wave counts on chart
Primary Characteristics:
1. Strong Momentum: Wave 3 is characterized by strong momentum, often leading to a rapid price movement.
2. Impulsive Price Action: Wave 3 is typically marked by impulsive price action, with prices moving quickly in one direction.
3. Increased Volatility: Wave 3 is often accompanied by increased volatility, with prices fluctuating rapidly.
4. Breakout above Resistance: Wave 3 often begins with a breakout above resistance, leading to a rapid price movement.
Secondary Characteristics:
1. Longest Wave: Wave 3 is often the longest wave in an impulse sequence.
2. Most Dynamic Wave: Wave 3 is typically the most dynamic wave, with the strongest momentum and largest price movement.
3. Highest Volume: Wave 3 often occurs with the highest volume, indicating strong market participation.
4. Fewest Corrections: Wave 3 typically has the fewest corrections, with prices moving rapidly in one direction.
Behavioral Characteristics:
1. Market Participants become Aggressive: During Wave 3, market participants become more aggressive, leading to increased buying or selling pressure.
2. Emotional Decision-Making: Wave 3 can lead to emotional decision-making, with market participants making impulsive decisions based on fear or greed.
3. Market Sentiment becomes Extreme: During Wave 3, market sentiment can become extreme, with market participants becoming overly bullish or bearish.
Keep in mind that these characteristics are not always present, and Wave 3 can exhibit different traits depending on the market context.
Here are some snapshots shared below to understand the concept & example
Largest wave among wave 1-3-5
Strong Momentum like 90 degree move, Vertical move, Rapid move & Dynamic move
Breakout with good volumes
Price trading above 50, 100 & 200 Day Exponential Moving Average
RSI Breakout on Daily
RSI Breakout on Weekly
MACD weekly
MACD Daily
Pattern Repeating
I am not Sebi registered analyst. My studies are for educational purpose only.
Please Consult your financial advisor before trading or investing.
I am not responsible for any kinds of your profits and your losses.
Most investors treat trading as a hobby because they have a full-time job doing something else.
However, If you treat trading like a business, it will pay you like a business.
If you treat like a hobby, hobbies don't pay, they cost you...!
Hope this post is helpful to community
Thanks
RK💕
Disclaimer and Risk Warning.
The analysis and discussion provided on in.tradingview.com is intended for educational purposes only and should not be relied upon for trading decisions. RK_Chaarts is not an investment adviser and the information provided here should not be taken as professional investment advice. Before buying or selling any investments, securities, or precious metals, it is recommended that you conduct your own due diligence. RK_Chaarts does not share in your profits and will not take responsibility for any losses you may incur. So Please Consult your financial advisor before trading or investing.
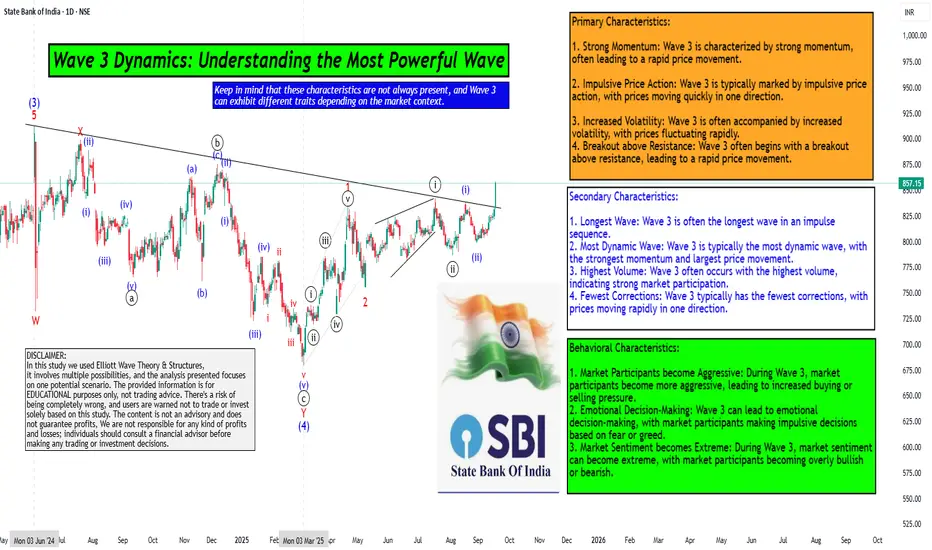
Global Supply Chain Disruptions1. Understanding Global Supply Chains
What is a Supply Chain?
A supply chain is the entire network of individuals, organizations, resources, activities, and technologies involved in creating and delivering a product. It includes:
Sourcing raw materials (mining metals, growing crops, drilling oil).
Manufacturing and production (turning raw materials into components or finished products).
Logistics and transportation (shipping goods via sea, air, rail, or road).
Distribution and retail (warehouses, online platforms, supermarkets, etc.).
End consumers (people or businesses buying the final product).
When this network is stretched across borders, it becomes a global supply chain.
Why Globalization Made Supply Chains Complex
From the 1980s onward, globalization and free trade agreements encouraged companies to outsource production to low-cost countries. For example:
Clothing brands shifted manufacturing to Bangladesh, Vietnam, and China.
Electronics companies sourced chips from Taiwan and South Korea.
Automakers relied on a global network of suppliers for engines, batteries, and steel.
This “just-in-time” model reduced costs by minimizing inventory and maximizing efficiency—but it also created fragility. A delay in one part of the world could stall the entire chain.
2. Causes of Global Supply Chain Disruptions
Global supply chains face disruptions from multiple sources. These can be broadly classified into natural, political, economic, technological, and human-related factors.
A. Natural Disasters & Pandemics
COVID-19 Pandemic (2020–2022): Factories in China shut down, shipping routes froze, and workers stayed home. This caused a shortage of everything—from masks and medicines to electronics and automobiles.
2011 Japan Earthquake & Tsunami: Disrupted production of automotive and electronic components, particularly semiconductors.
Hurricane Katrina (2005): Crippled oil production and refined products supply in the U.S.
Nature remains an unpredictable factor that no supply chain can fully eliminate.
B. Geopolitical Tensions & Wars
Russia-Ukraine War (2022–present): Disrupted supplies of wheat, corn, natural gas, and oil. Many countries dependent on Ukraine’s grain faced food shortages.
US-China Trade War (2018–2020): Tariffs and sanctions disrupted technology and manufacturing supply chains, particularly electronics.
Middle East conflicts: Threaten oil shipping routes, especially through chokepoints like the Suez Canal and Strait of Hormuz.
C. Economic Factors
Inflation & Currency Fluctuations: Rising costs of raw materials, fuel, and labor make global shipping expensive.
Labor Strikes: Dock workers, truckers, or airline staff strikes can paralyze logistics.
Global Recession Risks: Lower demand impacts supply chain planning and inventory cycles.
D. Logistical Bottlenecks
Port Congestion: During COVID, ports like Los Angeles and Shanghai saw ships waiting weeks to unload containers.
Shipping Container Shortages: Containers were stuck in the wrong places due to demand imbalances.
Ever Given Incident (2021): A single container ship blocking the Suez Canal for 6 days disrupted global trade worth billions.
E. Technological & Cyber Risks
Cyberattacks: Ransomware on logistics companies or ports can freeze operations. Example: The 2017 NotPetya attack crippled Maersk’s shipping systems.
Digital Dependency: Overreliance on automated systems means even small software glitches can cause major delays.
F. Human-Related Issues
Labor Shortages: Truck drivers in Europe and the U.S. remain in short supply, delaying goods movement.
Policy Changes: Sudden government restrictions, environmental regulations, or export bans (like India’s ban on rice exports in 2023) can shake global markets.
3. Impacts of Global Supply Chain Disruptions
Supply chain disruptions ripple across industries, economies, and societies.
A. Economic Impacts
Inflation: Shortages push prices up. Example: Chip shortages raised car prices worldwide.
GDP Slowdowns: Countries dependent on exports face reduced growth.
Business Losses: Companies lose revenue when they can’t deliver products on time.
B. Industry-Specific Impacts
Automobiles: Car production lines halted due to semiconductor shortages.
Electronics: Smartphone and laptop makers struggled to meet pandemic-driven demand.
Healthcare: Shortages of PPE, medicines, and vaccines during COVID.
Food Industry: Rising costs of grains, fertilizers, and shipping raised food prices globally.
C. Social Impacts
Job Losses: Factory shutdowns affect millions of workers.
Consumer Stress: Empty shelves and higher prices cause frustration.
Inequality: Developing countries face harsher consequences, especially with food and medicine shortages.
D. Strategic Impacts
Shift in Global Trade Alliances: Countries reduce dependency on adversarial nations.
Rise of Protectionism: More countries adopt “self-sufficiency” policies.
Rethinking Efficiency vs. Resilience: Businesses now focus on balancing cost-cutting with security.
4. Real-World Case Studies
Case 1: The Semiconductor Shortage (2020–2023)
Triggered by COVID lockdowns and surging demand for electronics.
Car makers like Ford and Toyota halted production.
Waiting times for laptops, gaming consoles, and phones increased.
Case 2: Suez Canal Blockage (2021)
The Ever Given, a giant container ship, blocked the canal.
12% of global trade was stuck for nearly a week.
Cost global trade $9 billion per day in delays.
Case 3: Russia-Ukraine War (2022)
Ukraine, known as the “breadbasket of Europe,” saw grain exports collapse.
Energy markets destabilized as Europe scrambled for alternatives to Russian gas.
Shipping in the Black Sea faced risks, raising insurance and freight costs.
5. How Companies and Governments are Responding
A. Diversification of Supply Chains
Moving production from China to Vietnam, India, Mexico, and Eastern Europe.
“China + 1” strategy gaining momentum.
B. Reshoring and Nearshoring
Bringing production closer to home to reduce dependency.
Example: U.S. investing in domestic semiconductor manufacturing (CHIPS Act 2022).
C. Technology and Digitalization
AI and big data for better demand forecasting.
Blockchain for transparent tracking of shipments.
Automation in warehouses and ports to reduce labor dependency.
D. Strategic Stockpiling
Governments and companies building reserves of essential goods.
Example: Many countries stockpiling rare earth minerals and semiconductors.
E. Sustainability & Green Supply Chains
Shift toward renewable energy in logistics.
Electric trucks, biofuels, and carbon-neutral shipping.
Recycling and circular supply chains to reduce waste.
Conclusion
Global supply chain disruptions have shown the fragility of a hyperconnected world. While globalization brought efficiency and low costs, it also introduced systemic risks. Pandemics, wars, natural disasters, and political decisions can now paralyze industries thousands of miles away.
The lesson for businesses and governments is clear: resilience is as important as efficiency. The future of supply chains will depend on diversification, digitalization, and sustainability. Those who adapt quickly will thrive, while those who remain over-reliant on fragile links may face constant disruptions.
In essence, global supply chain disruptions are not just logistical problems—they are economic, political, and social challenges that shape the future of globalization itself.

Climate Change & Carbon TradingPart I: Understanding Climate Change
1. The Science of Climate Change
Climate change refers to long-term shifts in temperatures and weather patterns, largely caused by human-induced greenhouse gas emissions. The main GHGs include:
Carbon dioxide (CO₂): from burning fossil fuels (coal, oil, gas) and deforestation.
Methane (CH₄): from agriculture (especially livestock), landfills, and fossil fuel extraction.
Nitrous oxide (N₂O): from fertilizers and industrial processes.
Fluorinated gases: synthetic gases from industrial and refrigeration processes.
The Earth’s average temperature has already risen by over 1.2°C since pre-industrial times, and the IPCC warns that exceeding 1.5°C will trigger catastrophic and irreversible impacts.
2. Impacts of Climate Change
Extreme Weather: More frequent hurricanes, droughts, heatwaves, and floods.
Rising Seas: Melting polar ice and thermal expansion threaten coastal communities.
Biodiversity Loss: Ecosystems struggle to adapt to rapid changes.
Agriculture: Crop failures and food insecurity increase.
Economic Damage: Billions lost annually in disaster recovery and adaptation.
Human Health: Heat stress, spread of diseases, and air pollution-related illnesses.
3. Global Climate Agreements
Recognizing the urgency, countries have come together to negotiate climate treaties:
1992: UN Framework Convention on Climate Change (UNFCCC) – set the stage for global cooperation.
1997: Kyoto Protocol – introduced binding emission reduction targets and created the first carbon trading systems.
2015: Paris Agreement – nearly 200 countries pledged to limit warming to “well below 2°C” and ideally to 1.5°C.
Carbon trading emerged out of these international negotiations as a way to reduce emissions efficiently and cost-effectively.
Part II: The Concept of Carbon Trading
1. What is Carbon Trading?
Carbon trading is a market-based mechanism to control pollution by providing economic incentives for reducing emissions. It works by setting a limit (cap) on the total amount of greenhouse gases that can be emitted. Companies or countries receive emission allowances under this cap, and these allowances can be traded.
In simple terms:
If a company emits less than its allowance, it can sell its surplus credits.
If a company emits more than its allowance, it must buy credits or face penalties.
This creates a financial value for carbon reductions, encouraging innovation and efficiency.
2. Types of Carbon Trading
(a) Cap-and-Trade Systems
A central authority sets a cap on emissions.
Companies receive or buy allowances.
Trading occurs in a regulated market.
Example: European Union Emissions Trading System (EU ETS).
(b) Carbon Offsetting / Voluntary Markets
Organizations or individuals invest in projects that reduce or absorb emissions (like reforestation, renewable energy).
Credits are generated from these projects and sold in voluntary markets.
Popular among corporations aiming for “carbon neutrality.”
3. Carbon Credits & Carbon Allowances
Carbon Credit: A certificate representing one metric ton of CO₂ reduced or removed.
Carbon Allowance: A permit under a regulatory cap-and-trade scheme, allowing the holder to emit one ton of CO₂.
Part III: Evolution of Carbon Trading
1. The Kyoto Protocol and Early Systems
The Kyoto Protocol (1997) introduced three mechanisms:
International Emissions Trading (IET): Countries with surplus emission units could sell them to others.
Clean Development Mechanism (CDM): Allowed industrialized countries to invest in emission-reduction projects in developing countries.
Joint Implementation (JI): Similar projects between developed countries.
This created the foundation of the global carbon market.
2. European Union Emissions Trading System (EU ETS)
Launched in 2005, EU ETS remains the largest carbon trading scheme in the world. It covers power plants, industry, and aviation within Europe. It works in phases, gradually tightening emission caps and increasing the cost of carbon allowances.
3. Other Carbon Markets
Regional Greenhouse Gas Initiative (RGGI) in the U.S.
California Cap-and-Trade Program.
China’s National ETS (2021): now the world’s largest by coverage.
India & South Korea exploring voluntary and compliance-based systems.
Part IV: Benefits of Carbon Trading
1. Economic Efficiency
Carbon trading allows emissions to be reduced where it is cheapest to do so. This avoids uniform, rigid regulations.
2. Incentivizing Innovation
By putting a price on carbon, businesses are encouraged to develop renewable energy, energy efficiency, and carbon capture technologies.
3. Flexibility for Companies
Firms can choose between reducing emissions in-house or purchasing credits.
4. Revenue for Governments
Auctioning allowances generates billions in revenue, which can be invested in climate adaptation, renewable energy, and social welfare.
5. Encouraging Global Cooperation
Projects under mechanisms like CDM foster technology transfer and sustainable development in developing nations.
Part V: Criticisms and Challenges
1. Over-allocation and Low Prices
Early systems often gave too many free allowances, leading to low carbon prices and weak incentives to reduce emissions.
2. Risk of Greenwashing
Some companies use cheap offsets instead of making real emission reductions.
3. Measurement and Verification Issues
Ensuring that carbon offset projects actually reduce emissions is complex. For instance, how do we prove a forest will not be cut down in the future?
4. Unequal Impact
Poor communities may bear the brunt of offset projects (land grabs for tree plantations, displacement of locals).
5. Market Volatility
Carbon prices can be unstable, creating uncertainty for businesses planning long-term investments.
Part VI: Carbon Trading in India
India, as a fast-growing economy and the world’s third-largest emitter, plays a key role. The government has launched initiatives like:
Perform, Achieve, and Trade (PAT): improving industrial energy efficiency.
Renewable Energy Certificates (RECs): promoting green electricity.
Carbon Credit Trading Scheme (2023): a framework for compliance and voluntary carbon markets.
If implemented effectively, India could become a major player in global carbon markets while balancing development and sustainability.
Conclusion
Climate change is not only an environmental challenge but also an economic, social, and ethical one. Carbon trading has emerged as one of the most significant tools to address it, creating financial incentives for emission reductions. From the Kyoto Protocol to the Paris Agreement, carbon markets have evolved into a central pillar of global climate policy.
However, carbon trading is no silver bullet. Its success depends on strict caps, transparent monitoring, fair distribution, and integration with other climate policies. If designed well, carbon markets can drive innovation, fund green projects, and accelerate the global transition to a low-carbon future.
Ultimately, carbon trading is a means to an end. The real goal is climate stability, protecting ecosystems, and ensuring a sustainable future for generations to come. For that, both markets and morality must work hand in hand.

Geopolitics & Energy Trading1. Historical Context: Energy as a Strategic Weapon
1.1 Oil in the 20th Century
The 20th century is often called the “Century of Oil.” With the rise of automobiles, aviation, and industrialization, oil replaced coal as the dominant fuel. The Middle East, home to massive reserves, became the strategic center of global energy politics.
World War II highlighted the importance of oil. Control over oil fields in the Middle East, the Caucasus, and Southeast Asia was a major military objective.
The U.S. emerged as both a top producer and consumer of oil, ensuring its military and economic supremacy.
1.2 OPEC and the Oil Shocks
In 1960, oil-exporting countries formed OPEC (Organization of the Petroleum Exporting Countries) to coordinate prices and policies. The OPEC oil embargo of 1973 against the U.S. and its allies caused oil prices to quadruple, leading to stagflation in Western economies. This event demonstrated how energy could be used as a geopolitical weapon.
1.3 Natural Gas and Russia’s Leverage
During the Cold War and beyond, the Soviet Union (later Russia) used natural gas pipelines to exert influence over Europe. Even in the 21st century, Russia’s dominance in supplying gas to Europe has made energy security a central geopolitical concern.
1.4 Rise of Renewables and Energy Security
In recent decades, climate change concerns and the instability of fossil fuel prices have pushed countries to diversify into renewable energy, nuclear power, and LNG (Liquefied Natural Gas). However, the geopolitical dimensions remain: rare earth minerals for solar panels, lithium for batteries, and uranium for nuclear power all introduce new trade dependencies.
2. Energy Trading: Mechanisms and Market Dynamics
Energy trading involves the buying, selling, and hedging of energy commodities such as oil, natural gas, coal, electricity, and increasingly, carbon credits.
2.1 Types of Energy Commodities Traded
Oil & Refined Products: Crude oil (Brent, WTI, Dubai) and products like gasoline, diesel, jet fuel.
Natural Gas: Pipeline gas and LNG, traded regionally and globally.
Coal: Still dominant in Asia, especially in China and India.
Electricity: Power trading through regional grids and spot markets.
Renewables & Carbon Credits: Certificates for green energy and emissions trading.
2.2 Energy Trading Hubs
Oil: Brent (London), WTI (New York), Dubai/Oman (Middle East).
Natural Gas: Henry Hub (U.S.), TTF (Netherlands), JKM (Japan-Korea Marker).
Coal: Newcastle (Australia), Richards Bay (South Africa).
Electricity: Nord Pool (Europe), PJM Interconnection (U.S.).
2.3 Financial Instruments in Energy Trading
Futures and Options: Used for hedging price volatility.
Swaps and Derivatives: Risk management tools.
Spot Trading: Immediate delivery transactions.
Energy trading is not only about physical barrels or tons moving—it is also about financial markets, where traders speculate on price movements, hedge risks, and create liquidity.
3. Geopolitical Dimensions of Energy Trading
Energy trade is influenced by multiple geopolitical factors.
3.1 Control of Supply Chains
Countries with abundant energy resources, like Saudi Arabia, Russia, Iran, Venezuela, use them as strategic tools. Controlling pipelines, shipping routes, and export terminals gives these countries leverage over consumers.
3.2 Chokepoints and Maritime Routes
Some key chokepoints in global energy trade:
Strait of Hormuz (Persian Gulf): About 20% of global oil trade passes here. Any blockade would send prices soaring.
Suez Canal (Egypt): Connects Middle Eastern oil to Europe.
Malacca Strait (Southeast Asia): Vital for oil flows to China, Japan, and South Korea.
3.3 Sanctions and Energy Wars
Iran: Subject to U.S. sanctions, limiting its oil exports.
Russia: Sanctions after the Ukraine war forced Europe to seek alternative gas suppliers.
Venezuela: Sanctions crippled its oil sector, reducing output drastically.
3.4 Energy as a Diplomatic Tool
Energy deals often accompany strategic alliances:
Russia–China gas pipelines strengthen political ties.
Middle East countries sign long-term supply contracts with Asia to ensure steady revenues.
The U.S. uses LNG exports to reduce Europe’s dependence on Russia.
4. Major Players in Global Energy Geopolitics
4.1 The United States
Largest producer of oil and gas (thanks to shale revolution).
Uses energy exports to project geopolitical influence.
Maintains military presence in the Middle East to secure energy supply routes.
4.2 Saudi Arabia and OPEC+
Saudi Arabia is the swing producer of oil, capable of increasing or reducing output to influence prices.
OPEC+, which includes Russia, plays a decisive role in oil supply management.
4.3 Russia
Energy superpower with vast oil and gas reserves.
Uses energy pipelines as a tool of influence, especially in Europe.
Faces growing competition due to sanctions and LNG diversification.
4.4 China
World’s largest energy importer.
Invests in energy projects globally (Africa, Middle East, Latin America).
Pioneering renewable energy but still heavily reliant on fossil fuels.
4.5 The European Union
Highly dependent on imports, especially gas.
Leading in carbon trading and green transition policies.
Vulnerable to geopolitical disruptions like the Russia-Ukraine war.
4.6 India
Fastest-growing energy consumer.
Heavy reliance on Middle East oil and global coal imports.
Diversifying into renewable energy and nuclear power.
5. Risks and Challenges
Volatility in Prices: Geopolitical tensions cause massive swings in energy prices.
Supply Disruptions: Wars, sanctions, and blockades threaten global supply.
Climate Change Pressure: Fossil fuel dependence clashes with decarbonization goals.
Technological Shifts: EVs, renewables, and storage could undermine oil & gas dominance.
Energy Nationalism: Countries hoarding resources or restricting exports for domestic security.
Conclusion
Geopolitics and energy trading are inseparable. From oil shocks in the 1970s to today’s battles over LNG, rare earths, and carbon credits, the story of global energy is as much political as it is economic. Energy has been used as a weapon, a bargaining chip, and a diplomatic tool.
In the future, while renewable energy may reduce the dominance of oil and gas, new dependencies on rare earths, hydrogen, and clean technologies will create fresh geopolitical challenges. Energy will continue to shape the global order—deciding alliances, conflicts, and the very survival of economies.
The relationship between geopolitics and energy trading is, in essence, the story of power—economic power, military power, and environmental power. And as the world transitions to a greener future, this story will only grow more complex and dynamic.
US Federal Reserve Policies & Interest Rate Impact1. The Federal Reserve: Structure & Role
The Fed was created in 1913 through the Federal Reserve Act to provide the U.S. with a safe, flexible, and stable monetary and financial system. Its structure reflects a balance between public and private interests:
Board of Governors (Washington, D.C.): 7 members appointed by the President, confirmed by the Senate. They set broad monetary policies.
12 Regional Federal Reserve Banks: Spread across cities like New York, Chicago, San Francisco, etc. They act as operational arms and provide economic data.
Federal Open Market Committee (FOMC): The most important policymaking body. It consists of 12 members (7 governors + 5 regional bank presidents, with New York Fed always included). The FOMC sets interest rate targets and conducts open market operations.
Dual Mandate
The Fed operates under a dual mandate given by Congress:
Promote maximum employment.
Maintain stable prices (control inflation).
Additionally, it seeks moderate long-term interest rates and financial stability.
2. Federal Reserve Policy Tools
The Fed uses several instruments to influence money supply and credit conditions.
2.1 Open Market Operations (OMO)
Buying or selling U.S. Treasury securities in the open market.
Buying securities → injects money → lowers interest rates → stimulates growth.
Selling securities → withdraws money → raises rates → controls inflation.
2.2 Discount Rate
The interest rate at which commercial banks borrow directly from the Federal Reserve.
Lower discount rate = cheaper borrowing = more liquidity in the system.
2.3 Reserve Requirements
The portion of deposits banks must keep with the Fed.
Rarely changed today, but lowering requirements increases money supply.
2.4 Interest on Reserve Balances (IORB)
The Fed pays interest on reserves held by banks.
Adjusting this rate influences interbank lending rates.
2.5 Quantitative Easing (QE) & Tightening (QT)
QE: Large-scale asset purchases (Treasuries, mortgage-backed securities) to pump liquidity, especially during crises (2008, COVID-19).
QT: Selling assets or letting them mature to absorb liquidity and control inflation.
3. The Importance of Interest Rates
Interest rates are at the core of Fed policy. The most closely tracked is the Federal Funds Rate (FFR) — the rate at which banks lend reserves to each other overnight.
Lowering rates: Encourages borrowing, spending, and investment.
Raising rates: Discourages excessive borrowing, cools demand, and fights inflation.
Because the dollar is the world’s reserve currency, U.S. interest rate decisions affect global capital flows, exchange rates, and commodity prices.
4. Historical Evolution of Fed Interest Rate Policies
4.1 The Great Depression & Early Years
In the 1930s, missteps by the Fed (tightening during banking crises) worsened the Depression. This experience shaped the modern view that central banks must act aggressively in downturns.
4.2 Post-WWII & Bretton Woods Era
Rates were kept low to support government borrowing needs. With Bretton Woods tying the dollar to gold, the Fed had limited independence.
4.3 The 1970s: Stagflation & Volcker Shock
The 1970s saw high inflation + stagnant growth. Fed Chair Paul Volcker raised interest rates above 20% in the early 1980s to crush inflation. This caused a severe recession but restored credibility.
4.4 The Great Moderation (1985–2007)
Stable inflation and growth characterized this period. The Fed fine-tuned rates to smooth cycles, often seen as a “golden era” of monetary policy.
4.5 The 2008 Global Financial Crisis
Fed slashed rates to near zero and introduced QE to rescue the banking system and stimulate recovery.
4.6 COVID-19 Pandemic Response
Again, rates were cut to 0–0.25%, with trillions of dollars in QE. Liquidity measures prevented economic collapse but sowed seeds for inflation later.
4.7 Inflation Surge of 2021–2023
Supply chain disruptions, fiscal stimulus, and energy shocks led to 40-year high inflation. The Fed responded with aggressive rate hikes, the fastest since the 1980s.
5. Transmission Mechanism: How Rate Changes Affect the Economy
When the Fed raises or lowers rates, the impact spreads through multiple channels:
Credit Costs: Mortgages, car loans, business loans become costlier or cheaper.
Consumer Spending: Lower rates encourage purchases; higher rates reduce demand.
Investment Decisions: Companies expand more under cheap credit.
Asset Prices: Stock markets, bonds, and real estate respond strongly.
Exchange Rates: Higher U.S. rates attract capital inflows, strengthening the dollar.
Inflation Expectations: Fed credibility influences public confidence in price stability.
6. Impact on Different Sectors
6.1 Households
Lower rates: Cheaper mortgages, lower credit card interest, stock market gains → wealth effect.
Higher rates: Expensive home loans, costlier debt servicing → reduced consumption.
6.2 Businesses
Expansion is easier when borrowing costs are low.
High rates delay projects, reduce hiring, and increase bankruptcies for leveraged firms.
6.3 Stock Market
Low rates = bullish equities (future profits discounted at lower rates).
High rates = bearish, as bonds become more attractive and financing costs rise.
6.4 Bond Market
Prices fall when rates rise (inverse relationship).
Yield curve often signals recessions when inverted.
6.5 Housing & Real Estate
Sensitive to mortgage rates. Higher rates cool housing demand, lower affordability.
6.6 Global Impact
Emerging markets face capital outflows when U.S. rates rise.
Dollar strength pressures countries with dollar-denominated debt.
Commodity prices (oil, gold) often fall when the dollar strengthens.
Challenges in Interest Rate Policy
Lagged Effects: Policy changes take months or years to fully show impact.
Global Interdependence: Other central banks respond to Fed moves.
Debt Burden: High U.S. government debt makes rising rates expensive for fiscal policy.
Asset Bubbles: Prolonged low rates risk speculative excesses.
Uncertainty of Neutral Rate: Economists debate what interest rate level is “neutral.”
Conclusion
The U.S. Federal Reserve’s interest rate policies are at the heart of economic management domestically and globally. By balancing growth and inflation, the Fed attempts to achieve stability, but trade-offs are inevitable. History shows that too loose or too tight a stance can have dramatic consequences.
Going forward, the Fed’s credibility and adaptability will determine how effectively it navigates inflation cycles, financial stability, and global challenges. For investors, businesses, and households, “Don’t fight the Fed” remains a timeless truth.

Sovereign Debt & Global Government Bond Trading1. The Concept of Sovereign Debt
1.1 Definition
Sovereign debt refers to the financial obligations of a national government, typically in the form of bonds, notes, or bills, issued to domestic and international investors. Unlike corporate or household debt, sovereign debt is backed by the state’s ability to tax, print currency (for monetary sovereigns), or pledge future revenues.
1.2 Purpose of Sovereign Borrowing
Fiscal Deficit Financing – Covering gaps between government expenditure and revenues.
Infrastructure Projects – Financing long-term development like roads, power plants, and education.
Counter-Cyclical Spending – Stimulating economies during recessions.
Debt Refinancing – Rolling over old debt with new issuance.
Foreign Exchange & Reserve Building – Issuing foreign currency debt to strengthen reserves.
1.3 Types of Sovereign Debt
Domestic Debt – Issued in local currency, bought mostly by domestic investors.
External Debt – Issued in foreign currencies (USD, EUR, JPY, etc.), attracting global investors.
Short-term vs. Long-term Debt – Ranging from treasury bills (maturing in months) to bonds with maturities of 30 years or more.
2. Evolution of Sovereign Debt
Sovereign borrowing dates back centuries.
Medieval Europe – Monarchs borrowed from bankers to finance wars (e.g., Italian city-states lending to monarchs).
17th Century England – Creation of the “consols” (perpetual bonds) and the Bank of England institutionalized sovereign debt markets.
19th Century – Global trade expansion saw countries like Argentina, Russia, and Ottoman Empire issuing debt in London and Paris.
20th Century – Post-WWII Bretton Woods system made U.S. Treasuries the global benchmark.
21st Century – Sovereign bonds now dominate global capital markets, with increasing cross-border integration, ETFs, and derivatives.
3. Structure of Global Government Bond Markets
3.1 Major Bond Issuers
United States – Largest market, U.S. Treasuries are the global risk-free benchmark.
Eurozone Sovereigns – Germany, France, Italy, Spain, etc., forming the largest block of bonds.
Japan – Japanese Government Bonds (JGBs), held mostly by domestic institutions.
Emerging Markets – Brazil, India, China, South Africa, etc., increasingly significant.
3.2 Investor Base
Central Banks – Hold bonds as reserves and for monetary policy.
Institutional Investors – Pension funds, insurance companies, mutual funds.
Foreign Governments & Sovereign Wealth Funds – For diversification and trade balance management.
Retail Investors – Via savings bonds, ETFs, and mutual funds.
3.3 Market Segments
Primary Market – Governments issue debt through auctions and syndications.
Secondary Market – Investors trade bonds in over-the-counter (OTC) markets or exchanges.
Derivatives Market – Futures, options, and swaps linked to sovereign bonds.
4. Mechanics of Government Bond Trading
4.1 Issuance Process
Auctions: Competitive and non-competitive bids (e.g., U.S. Treasury auctions).
Syndication: Banks underwrite large bond deals for global distribution.
Private Placements: Direct sales to select investors.
4.2 Bond Pricing & Yields
Bond prices are inversely related to yields. Key concepts:
Coupon Rate – Fixed interest payments.
Yield to Maturity (YTM) – Return if held to maturity.
Yield Curve – Plot of yields across different maturities, signaling market expectations.
4.3 Trading Platforms
OTC Networks – Banks, dealers, and institutional investors.
Electronic Platforms – Bloomberg, Tradeweb, MarketAxess.
Futures & Options Markets – CME, Eurex, SGX for hedging and speculation.
5. Role in Global Finance
5.1 Benchmark for Risk-Free Rate
U.S. Treasuries, German Bunds, and JGBs are benchmarks for pricing corporate bonds, loans, and derivatives.
5.2 Safe Haven Asset
In crises, investors flock to sovereign bonds of stable countries (U.S., Switzerland, Japan), causing yields to fall.
5.3 Monetary Policy Transmission
Central banks buy or sell government bonds (open market operations) to influence liquidity and interest rates.
5.4 Reserve Asset
Foreign exchange reserves of central banks are largely invested in government bonds of major economies.
5.5 Capital Flows & Exchange Rates
Sovereign bond yields attract global capital. For example, higher U.S. yields attract inflows, strengthening the dollar.
6. Risks in Sovereign Debt
6.1 Credit Risk
Risk of default—Argentina (2001), Greece (2010), Sri Lanka (2022).
6.2 Currency Risk
Foreign investors in local currency bonds face FX volatility.
6.3 Interest Rate Risk
Bond prices fall when interest rates rise.
6.4 Liquidity Risk
Some emerging market bonds lack active secondary markets.
6.5 Political & Geopolitical Risk
Political instability, sanctions, or wars disrupt repayment.
Challenges & Controversies
Debt Sustainability – Rising debt-to-GDP ratios in U.S., Japan, Italy spark long-term concerns.
Monetary Financing – Central banks buying government debt blurs fiscal-monetary boundaries.
Market Concentration – Dominance of few large investors (e.g., BlackRock, Vanguard).
Geopolitics – Sanctions on Russia’s bonds, China-U.S. tensions, weaponization of reserves.
Conclusion
Sovereign debt and global government bond trading are central pillars of the modern financial system. They provide safety for investors, benchmarks for pricing, liquidity for monetary policy, and capital for governments. However, sovereign debt markets are not without risks—ranging from defaults and political upheavals to interest rate shocks and currency crises.
As the world enters an era of high debt, climate imperatives, digital finance, and geopolitical fragmentation, sovereign debt will continue to shape the future of international finance. Global government bond trading, once limited to elite institutions, is now a truly worldwide marketplace reflecting the interconnectedness of economies.
Ultimately, sovereign debt is not just about borrowing; it is about trust—the trust of citizens in their governments, and of global investors in the financial system.

Arbitrage Opportunities Across World Exchanges1. Historical Background of Arbitrage
The roots of arbitrage stretch back centuries. Merchants in ancient times often exploited price discrepancies between different regions. For example:
Medieval trade routes: A trader could buy spices in India at low cost and sell them in Venice for a much higher price. This was a form of geographical arbitrage.
Gold Standard Era (19th century): Traders moved gold between cities like London and New York when exchange rate differences emerged.
Early stock markets: With the rise of exchanges in Amsterdam (1600s), London (1700s), and New York (1800s), traders began noticing price gaps between dual-listed stocks.
These historical examples were limited by communication and transport delays. But with the telegraph, telephone, and later the internet, arbitrage evolved into a high-speed, technology-driven strategy.
2. Understanding Arbitrage in Modern Exchanges
Today, arbitrage opportunities arise because no two markets are perfectly efficient. Prices may differ due to:
Time zone gaps – Tokyo, London, and New York operate in different hours.
Liquidity differences – A stock may have deeper trading in one exchange than another.
Regulatory restrictions – Taxes, transaction costs, or capital controls create distortions.
Information asymmetry – News may reach one market before another.
Currency fluctuations – Cross-border trades involve foreign exchange risks and opportunities.
In principle, arbitrage is about buying an asset cheaper in one place and selling it more expensively elsewhere—instantly or within a very short timeframe.
3. Types of Arbitrage Across World Exchanges
A. Spatial Arbitrage (Geographic Arbitrage)
This is the most classic form, where the same asset trades at different prices in two locations.
Example: A company’s shares are listed both in Hong Kong and New York. If the stock trades at $100 in New York and the equivalent of $102 in Hong Kong, traders can buy in New York and sell in Hong Kong.
B. Cross-Currency Arbitrage
Involves exploiting discrepancies in exchange rates.
Example: If EUR/USD, USD/JPY, and EUR/JPY are not aligned, a trader can loop through these conversions to lock in profit.
C. Triangular Arbitrage
More specific to forex markets. Traders exploit inconsistencies between three currency pairs simultaneously.
D. Statistical Arbitrage
Uses algorithms and quantitative models to detect pricing anomalies across exchanges.
Example: Pairs trading where two correlated stocks diverge temporarily in price.
E. Commodity Arbitrage
Prices of commodities like gold, oil, or wheat may vary across exchanges such as NYMEX (New York) and MCX (India). Arbitrageurs buy low in one and sell high in another.
F. Futures-Spot Arbitrage
Exploiting price differences between futures contracts in Chicago (CME) and the spot market in Shanghai or London.
G. Regulatory Arbitrage
Here, differences in rules create opportunities. For example, one exchange may allow certain derivatives trading while another bans it, creating parallel markets.
4. Role of Technology in Arbitrage
Modern arbitrage would be impossible without technology.
High-Frequency Trading (HFT): Ultra-fast algorithms execute trades in microseconds to capture fleeting arbitrage gaps.
Co-location services: Exchanges allow traders to place servers next to their data centers, reducing latency.
Blockchain & Crypto Arbitrage: With decentralized exchanges and global crypto markets, arbitrage between platforms like Binance, Coinbase, and Korean exchanges has become popular.
AI & Machine Learning: Algorithms analyze huge volumes of data to identify patterns humans may miss.
Technology doesn’t just create opportunities—it also reduces them quickly because once an arbitrage is spotted, it disappears as traders exploit it.
5. Real-World Examples of Global Arbitrage
A. Dual-Listed Stocks
Companies like Alibaba (listed in both NYSE and Hong Kong) or Royal Dutch Shell (listed in London and Amsterdam) often show slight price variations across exchanges. Professional arbitrageurs track these.
B. Gold Market
Gold trades in London (LBMA), New York (COMEX), and Shanghai. Price differences sometimes arise due to local demand, currency issues, or government policies. Arbitrageurs move gold or use paper contracts to profit.
C. Oil Market
The Brent crude benchmark (London) and WTI crude (New York) often trade at different spreads. Traders arbitrage these spreads with futures and physical oil trades.
D. Crypto Arbitrage
Bitcoin prices often differ across countries. For example, in South Korea (the "Kimchi Premium"), Bitcoin has historically traded 5–15% higher than in the U.S. due to capital restrictions.
E. Index Futures
Nifty (India), Nikkei (Japan), and S&P 500 (U.S.) futures trade almost 24/7. Arbitrageurs exploit price differences between futures traded in Singapore, Chicago, and domestic exchanges.
6. Challenges in Arbitrage
While arbitrage sounds like free money, in practice it faces many obstacles:
Transaction Costs: Commissions, spreads, and clearing fees can wipe out profits.
Currency Risks: Exchange rate movements can reverse arbitrage gains.
Capital Controls: Many countries restrict cross-border money flow.
Latency: Delays of even milliseconds can cause missed opportunities.
Liquidity Risks: Prices may differ, but executing large trades may not be possible.
Regulatory Risks: Authorities may restrict arbitrage trading to protect domestic markets.
Market Volatility: Sudden price swings can turn an arbitrage into a loss.
Arbitrage and Global Market Integration
Arbitrage plays a vital role in making global markets more efficient. By exploiting discrepancies, arbitrageurs push prices back into alignment. For example:
If gold trades at $1,800 in London and $1,820 in New York, arbitrage will push both toward equilibrium.
In FX, triangular arbitrage ensures that currency pairs remain mathematically consistent.
Thus, arbitrage acts as a self-correcting mechanism in global finance, reducing inefficiencies.
The Future of Global Arbitrage
Looking ahead, arbitrage opportunities will evolve:
Artificial Intelligence: Smarter algorithms will find hidden inefficiencies.
24/7 Markets: With crypto leading the way, global markets may never sleep, creating new overlaps.
CBDCs (Central Bank Digital Currencies): Will reduce settlement risks but may also create new arbitrage across jurisdictions.
Environmental & Carbon Markets: Carbon credits may become arbitrageable commodities across countries.
Geopolitical Shifts: Sanctions, wars, or policy changes can create huge temporary arbitrage gaps.
Conclusion
Arbitrage across world exchanges represents one of the most intriguing aspects of global finance. It thrives on inefficiencies, time zone differences, currency movements, and regulatory mismatches. Far from being just a trick for quick profits, arbitrage serves a deeper function: it connects and integrates global markets, ensuring that prices reflect a unified reality rather than fragmented local conditions.
From the spice traders of the Silk Road to today’s AI-driven high-frequency traders, the pursuit of risk-free profit has remained constant. What has changed is the scale, speed, and sophistication of arbitrage across world exchanges. In the future, as technology reshapes markets and globalization deepens, arbitrage will continue to be both a challenge and an opportunity for traders, institutions, and regulators worldwide.
International Payment Gateways1. Introduction
In today’s digital economy, global trade is no longer limited to large corporations. From small businesses to freelancers, millions of people engage in cross-border transactions every day. A consumer in India can order a gadget from the U.S., a freelancer in Africa can work for a client in Europe, and a retailer in Asia can sell to buyers worldwide. The lifeline that makes all this possible is the International Payment Gateway (IPG).
At its core, an international payment gateway is the digital bridge that securely facilitates financial transactions between buyers and sellers across borders. It ensures that when a customer pays in one country, the funds are processed, converted, and settled appropriately in the seller’s account, regardless of geographic location.
This article explores the concept of international payment gateways in detail—what they are, how they work, their benefits, challenges, and future outlook.
2. What is an International Payment Gateway?
An International Payment Gateway (IPG) is a technology platform that allows merchants and businesses to accept payments from customers around the world. It acts as a middleman between the merchant’s website (or app) and the bank or financial network that processes the payment.
Key Functions
Authorization – Verifies whether the customer has sufficient funds or credit.
Authentication – Confirms the legitimacy of the transaction and prevents fraud.
Processing – Transmits transaction details securely to banks or card networks.
Settlement – Transfers the funds to the merchant’s bank account.
Currency Conversion – Converts customer payments into the merchant’s preferred currency.
In simple words, a payment gateway is like a virtual cash register for online businesses, but with global reach.
3. Evolution of International Payment Gateways
The journey of payment gateways has evolved alongside the growth of e-commerce:
1990s – Early days of online shopping, simple credit card processors emerged.
2000s – Rise of PayPal and other digital wallets made cross-border payments easier.
2010s – Mobile payments, API-driven gateways (like Stripe), and global reach.
2020s and beyond – Blockchain-based solutions, AI-driven fraud prevention, and seamless multi-currency wallets dominate the market.
Today, gateways not only process payments but also provide fraud protection, analytics, compliance, and global settlement infrastructure.
4. How International Payment Gateways Work
Let’s simplify the complex flow of cross-border transactions into steps:
Step 1: Customer Initiates Payment
A customer selects a product/service and chooses a payment method (credit card, debit card, digital wallet, UPI, PayPal, etc.).
Step 2: Encryption
The gateway encrypts sensitive information (card details, banking info) to ensure security.
Step 3: Routing to Processor
The data is sent to the acquiring bank (merchant’s bank) via the gateway.
Step 4: Communication with Card Networks
The acquiring bank sends the request to the card network (Visa, Mastercard, Amex, etc.), which then routes it to the issuing bank (customer’s bank).
Step 5: Authorization
The issuing bank checks funds, fraud risks, and authenticity before approving or declining.
Step 6: Response Sent Back
The authorization result is sent back through the same chain—card network → acquiring bank → gateway → merchant website.
Step 7: Settlement
If approved, funds are deducted from the customer’s account, converted into the merchant’s currency if needed, and deposited into the merchant’s bank account (usually within a few days).
5. Features of International Payment Gateways
Modern international gateways offer a wide range of features:
Multi-Currency Support – Customers can pay in their own currency.
Multiple Payment Methods – Credit cards, debit cards, wallets, bank transfers, cryptocurrencies.
Fraud Prevention – AI-driven monitoring, 3D Secure authentication, tokenization.
Compliance – Adheres to PCI DSS (Payment Card Industry Data Security Standard) and regional regulations.
Recurring Billing – Useful for subscriptions and SaaS businesses.
Mobile Integration – Seamless payments on apps and mobile sites.
Analytics & Reporting – Insights into transactions, chargebacks, and customer behavior.
6. Types of International Payment Gateways
There are several categories of gateways based on their functionality and business models:
1. Hosted Gateways
Redirect customers to the gateway’s payment page (e.g., PayPal, Razorpay checkout).
Easy to integrate, but less control over user experience.
2. Integrated Gateways
Customers enter payment details directly on the merchant’s site.
Requires PCI compliance but offers better branding and user experience.
3. API-Based Gateways
Offer advanced flexibility, customization, and direct integration with apps/websites.
Examples: Stripe, Adyen.
4. Localized Gateways
Cater to regional markets with local currency and payment methods.
Example: Alipay (China), Paytm (India).
5. Cryptocurrency Gateways
Enable payments via Bitcoin, Ethereum, or stablecoins.
Examples: BitPay, CoinGate.
7. Major Players in the International Payment Gateway Industry
Some leading international payment gateways include:
PayPal – Global leader in cross-border digital wallets.
Stripe – Popular with startups and developers for API-based integration.
Adyen – Enterprise-focused, used by companies like Uber and Spotify.
Worldpay – Long-standing provider with global reach.
Authorize.Net – One of the earliest online payment gateways.
2Checkout (now Verifone) – Multi-currency global payments.
Alipay & WeChat Pay – Dominant in China.
Payoneer – Widely used for freelancer payments worldwide.
Razorpay, PayU, CCAvenue – Strong players in India.
8. Benefits of International Payment Gateways
For businesses and consumers, these gateways bring immense advantages:
For Businesses
Access to global customers.
Increased sales through diverse payment methods.
Automated conversion and settlement in preferred currency.
Fraud protection and security compliance.
Easy integration with websites, apps, and e-commerce platforms.
For Customers
Convenience of paying in local currency.
Wide choice of payment methods.
Secure and fast transactions.
Global access to products and services.
9. Challenges of International Payment Gateways
Despite their benefits, IPGs face challenges:
High Transaction Fees – Cross-border fees, currency conversion, and settlement charges can be expensive.
Regulatory Compliance – Different countries have varying rules (KYC, AML, data protection).
Fraud & Chargebacks – International transactions are riskier and prone to disputes.
Currency Volatility – Exchange rate fluctuations affect settlements.
Technical Integration – API complexity and ongoing maintenance can be challenging.
Limited Accessibility – Some regions lack reliable banking or digital infrastructure.
10. International Payment Gateway Regulations
To operate globally, gateways must adhere to strict rules:
PCI DSS Compliance – Ensures cardholder data protection.
KYC (Know Your Customer) & AML (Anti-Money Laundering) – Prevents illicit financial activities.
GDPR (General Data Protection Regulation) – Governs data privacy in the EU.
Local Regulations – RBI (India), FCA (UK), SEC (US), etc.
Conclusion
International Payment Gateways are the unsung heroes of the digital economy. They ensure that whether you’re a small Etsy seller in India, a freelancer in Africa, or a corporation in America, you can send and receive payments globally with just a few clicks.
While challenges like high fees, fraud risks, and regulatory hurdles remain, the benefits far outweigh them. As technology advances—with blockchain, AI, and digital currencies—payment gateways will become even faster, cheaper, and more secure.
In essence, International Payment Gateways are not just about payments—they are about enabling global trade, financial inclusion, and the future of borderless commerce.

The Global Shadow Banking System1. Understanding Shadow Banking
1.1 Definition
Shadow banking refers to the system of credit intermediation that occurs outside the scope of traditional banking regulation. Coined by economist Paul McCulley in 2007, the term highlights how non-bank entities perform bank-like functions such as maturity transformation (borrowing short-term and lending long-term), liquidity transformation, and leverage creation—yet without the same safeguards, such as deposit insurance or central bank backstops.
1.2 Key Characteristics
Non-bank entities: Shadow banking is carried out by hedge funds, money market funds, private equity firms, securitization vehicles, and other institutions.
Credit intermediation: It channels savings into investments, much like traditional banks.
Regulatory arbitrage: It often arises where financial activity moves into less regulated areas to avoid capital and liquidity requirements.
Opacity: Complex instruments and off-balance sheet entities make it difficult to track risks.
1.3 Distinction from Traditional Banking
Unlike regulated banks:
Shadow banks cannot access central bank liquidity in times of crisis.
They lack deposit insurance, increasing systemic vulnerability.
They rely heavily on short-term wholesale funding such as repurchase agreements (repos).
2. Historical Evolution of Shadow Banking
2.1 Early Developments
Shadow banking’s roots can be traced to the 1970s and 1980s, when deregulation in advanced economies allowed financial innovation to flourish. Rising global capital flows created demand for new instruments outside traditional bank lending.
2.2 Rise of Securitization
The 1980s–2000s saw the explosion of securitization, where loans (e.g., mortgages) were bundled into securities and sold to investors. Special Purpose Vehicles (SPVs) and conduits became central actors in shadow banking, financing long-term assets with short-term borrowing.
2.3 Pre-Crisis Boom (2000–2007)
The shadow system expanded rapidly before the 2008 financial crisis. Investment banks, money market funds, and structured investment vehicles financed trillions in mortgage-backed securities (MBS) and collateralized debt obligations (CDOs). This system appeared efficient but was highly fragile.
2.4 The 2008 Financial Crisis
When U.S. subprime mortgage markets collapsed, shadow banks faced a sudden liquidity freeze. Lacking deposit insurance and central bank support, institutions like Lehman Brothers collapsed, triggering global contagion. The crisis revealed the systemic importance—and dangers—of shadow banking.
2.5 Post-Crisis Reconfiguration
After 2008, regulators tightened banking rules, pushing even more activities into the shadow system. Simultaneously, reforms such as tighter money market fund rules sought to contain systemic risks. Despite these efforts, shadow banking has continued to grow, especially in China and emerging markets.
3. Structure of the Shadow Banking System
The shadow banking universe is diverse, consisting of multiple actors and instruments.
3.1 Key Entities
Money Market Funds (MMFs) – Provide short-term financing by investing in highly liquid securities.
Hedge Funds & Private Equity – Use leverage to provide credit, often in riskier markets.
Structured Investment Vehicles (SIVs) – Finance long-term securities through short-term borrowing.
Finance Companies – Offer consumer and business loans without deposit funding.
Broker-Dealers – Rely on repo markets to fund securities inventories.
Securitization Conduits & SPVs – Issue asset-backed securities (ABS).
3.2 Instruments and Mechanisms
Repos (Repurchase Agreements) – Short-term loans secured by collateral.
Commercial Paper – Unsecured short-term debt issued by corporations or conduits.
Mortgage-Backed Securities (MBS) – Bundled mortgage loans sold to investors.
Collateralized Debt Obligations (CDOs) – Structured products pooling various debt instruments.
Derivatives – Instruments like credit default swaps (CDS) that transfer credit risk.
3.3 Interconnectedness
The system is deeply interconnected with traditional banks. Many shadow entities rely on bank credit lines, while banks invest in shadow assets. This interdependence amplifies systemic risk.
4. Global Dimensions of Shadow Banking
4.1 United States
The U.S. remains the epicenter, with trillions in assets managed by MMFs, hedge funds, and securitization vehicles. Its role in the 2008 crisis highlighted its global impact.
4.2 Europe
European banks historically relied on securitization and repo markets, making shadow banking integral to cross-border finance. Luxembourg and Ireland are major hubs due to favorable regulations.
4.3 China
China’s shadow banking system emerged in the 2000s as a response to tight bank lending quotas. Wealth management products (WMPs), trust companies, and informal lending channels fueled rapid credit growth. While supporting growth, they also raised concerns of hidden debt risks.
4.4 Emerging Markets
In Latin America, Africa, and Southeast Asia, shadow banking fills credit gaps left by underdeveloped banking sectors. However, limited oversight raises systemic vulnerabilities.
5. Benefits of Shadow Banking
Despite its risks, shadow banking provides several advantages:
Credit Diversification – Expands funding beyond banks.
Market Liquidity – Enhances efficiency in capital markets.
Financial Innovation – Encourages new instruments and risk-sharing mechanisms.
Access to Credit – Supports SMEs and consumers underserved by traditional banks.
Global Capital Mobility – Facilitates international investment flows.
6. Risks and Challenges
6.1 Systemic Risk
Shadow banking increases interconnectedness, making financial crises more contagious.
6.2 Maturity and Liquidity Mismatch
Borrowing short-term while investing in long-term assets creates vulnerability to runs.
6.3 Leverage
High leverage amplifies both profits and losses, making collapses more severe.
6.4 Opacity and Complexity
Structured products like CDOs obscure underlying risks.
6.5 Regulatory Arbitrage
Activities shift to less regulated domains, making oversight difficult.
6.6 Spillover to Traditional Banking
Banks are exposed through investments, credit lines, and funding dependencies.
Conclusion
The global shadow banking system is a double-edged sword. On one hand, it enhances financial diversity, supports credit creation, and fuels innovation. On the other, it introduces opacity, leverage, and systemic fragility that can destabilize economies. The 2008 crisis demonstrated how vulnerabilities in the shadow system can trigger global turmoil.
Going forward, regulators must adopt balanced approaches: tightening oversight without stifling beneficial innovation. International coordination is critical, given the cross-border nature of shadow banking. As financial technology evolves, the boundaries between traditional banks, shadow entities, and digital platforms will blur even further.
Ultimately, shadow banking is not merely a “shadow” but an integral part of modern finance—one that demands vigilance, transparency, and adaptive regulation to ensure it serves as a force for stability and growth rather than crisis and contagion.
Role of Rating Agencies in World Finance1. Origins and Evolution of Rating Agencies
The story of rating agencies dates back to the early 20th century in the United States.
1909 – Birth of Ratings: John Moody published the first bond ratings in the "Moody’s Manual," rating railroad bonds.
1920s – Expansion: Poor’s Publishing (later S&P) and Fitch followed, rating municipal and corporate bonds.
Post-WWII Era: The global expansion of capital markets created a need for standardized credit evaluations.
1970s – Modernization: The U.S. Securities and Exchange Commission (SEC) recognized some agencies as Nationally Recognized Statistical Rating Organizations (NRSROs), giving them official status.
1990s – Global Dominance: With globalization, agencies expanded internationally, influencing sovereign ratings across emerging markets.
2008 – Financial Crisis Fallout: Agencies faced heavy criticism for giving top ratings to mortgage-backed securities that later collapsed.
Today: They remain powerful gatekeepers of global capital flows, with ratings impacting everything from sovereign debt yields to corporate financing.
2. What Are Rating Agencies?
A rating agency is an independent institution that assesses the credit risk of issuers and financial instruments. The rating represents an opinion on the likelihood that the borrower will meet its obligations.
2.1 Types of Ratings
Sovereign Ratings: Creditworthiness of national governments.
Corporate Ratings: Ratings for private or public companies.
Municipal Ratings: For cities, states, and local government entities.
Structured Finance Ratings: Covering securities like mortgage-backed or asset-backed instruments.
2.2 The Rating Scale
Most agencies use letter-based scales:
Investment Grade: AAA, AA, A, BBB (considered safe).
Speculative or Junk Grade: BB, B, CCC, CC, C (higher risk).
Default: D (issuer has defaulted).
The finer distinctions (e.g., AA+, A−) help investors evaluate relative risks.
3. Functions of Rating Agencies in Global Finance
Rating agencies play several vital roles in the financial system:
3.1 Providing Independent Risk Assessment
They offer unbiased evaluations of issuers and instruments, reducing the information gap between borrowers and investors.
3.2 Facilitating Investment Decisions
Investors rely on ratings to determine where to allocate capital, especially in global bond markets.
3.3 Reducing Information Asymmetry
By publishing standardized ratings, agencies make complex financial data more digestible for investors.
3.4 Influencing Cost of Capital
Higher-rated borrowers enjoy lower interest rates, while lower-rated ones pay more for access to credit.
3.5 Supporting Regulatory Frameworks
Many regulators use ratings to set capital requirements for banks, insurance firms, and pension funds.
3.6 Enabling Market Discipline
Ratings act as a check on governments and corporations, rewarding fiscal responsibility and penalizing reckless financial management.
4. Role in Sovereign Finance
Sovereign credit ratings are among the most influential outputs of rating agencies.
A sovereign downgrade can lead to higher borrowing costs for a country.
Ratings affect foreign direct investment (FDI) inflows and portfolio investments.
Global institutions like the IMF and World Bank sometimes incorporate ratings into their assessments.
Examples:
The Eurozone debt crisis (2010–2012) saw Greece, Portugal, and Spain downgraded, worsening their borrowing costs.
Emerging markets like India or Brazil often face investor sentiment swings tied to rating outlook changes.
5. Role in Corporate Finance
For corporations, ratings determine access to both domestic and international capital markets.
A high rating allows companies to issue bonds at favorable interest rates.
A downgrade can cause share prices to fall and raise refinancing costs.
Credit ratings influence mergers, acquisitions, and capital structuring decisions.
Example: Apple, with a strong credit rating, can borrow billions at minimal rates compared to a weaker company with junk-rated debt.
6. Impact on Global Capital Markets
6.1 Bond Markets
The bond market, worth trillions of dollars, depends heavily on ratings to evaluate risks.
6.2 Investor Mandates
Pension funds, insurance companies, and sovereign wealth funds often have rules restricting them to investment-grade securities. A downgrade to junk status forces them to sell, impacting markets.
6.3 Crisis Amplification
Downgrades can create a domino effect during crises, accelerating capital flight and worsening downturns.
Advantages of Rating Agencies
Enhance global capital flows.
Provide benchmarks for risk pricing.
Improve transparency in financial markets.
Assist governments and corporations in long-term planning.
Limitations of Rating Agencies
Ratings are opinions, not guarantees.
Possibility of bias or errors.
Can exaggerate crises through downgrades.
Heavy concentration of power in a few global players (S&P, Moody’s, Fitch).
Conclusion
Rating agencies are both pillars and paradoxes of global finance. They provide essential risk assessments that guide trillions of dollars in investments, support transparency, and help regulate international capital markets. Yet, their unchecked influence, conflicts of interest, and role in past crises reveal the dangers of overreliance on their opinions.
The future of rating agencies lies in striking a balance—maintaining their indispensable role while ensuring transparency, accountability, and diversification in the credit evaluation landscape. In a world where finance is increasingly global, digital, and interconnected, rating agencies will continue to shape the destiny of nations, corporations, and investors alike.
Petrodollar & Oil Trade Mechanisms1. Origins of the Petrodollar System
1.1 Oil and the Bretton Woods Order
After World War II, the Bretton Woods Agreement (1944) created a global financial system where most currencies were pegged to the U.S. dollar, and the dollar itself was pegged to gold at $35 per ounce. This made the dollar the cornerstone of world trade. Since oil was becoming a critical global resource, it naturally started being priced in dollars.
1.2 The Collapse of Bretton Woods
In 1971, President Richard Nixon ended the convertibility of the dollar to gold. This “Nixon Shock” meant the U.S. dollar was no longer backed by gold, leading to concerns about its stability. At the same time, oil demand was booming worldwide, and the U.S. needed a way to preserve the dollar’s dominance.
1.3 U.S.–Saudi Deal and Birth of Petrodollars
In 1974, the U.S. struck a historic deal with Saudi Arabia, the world’s largest oil exporter and de facto leader of OPEC (Organization of Petroleum Exporting Countries). The agreement included:
Saudi Arabia pricing its oil exclusively in U.S. dollars.
Investing surplus revenues in U.S. Treasury securities and financial markets.
In return, the U.S. provided military protection and security guarantees.
Other OPEC members followed suit. This was the birth of the petrodollar system, where oil exports globally were priced and traded in U.S. dollars. The result: demand for dollars surged worldwide, cementing the U.S. currency as the world’s reserve currency.
2. How the Petrodollar System Works
2.1 Dollar-Denominated Oil
Under the petrodollar system, any country wishing to buy oil must first acquire U.S. dollars. This creates constant global demand for dollars, ensuring its strength and liquidity in foreign exchange markets.
2.2 Recycling of Petrodollars
Oil-exporting nations like Saudi Arabia, Kuwait, and the UAE generate huge dollar revenues. These dollars are then recycled in two ways:
Investment in U.S. assets: Treasuries, bonds, real estate, and equities.
Loans to developing countries: Petrodollar surpluses often flow into global banks, which lend them to countries in need of capital.
This cycle—oil buyers purchasing dollars, exporters reinvesting dollars—sustains global financial flows.
2.3 U.S. Strategic Advantage
Because oil trade requires dollars, the U.S. enjoys unique privileges:
Ability to run persistent trade deficits without collapsing currency value.
Financing government spending through foreign purchases of U.S. debt.
Strengthening its geopolitical influence by controlling financial channels linked to the dollar.
In essence, the petrodollar acts as a form of “hidden tax” on the world, since global demand for dollars supports U.S. economic power.
3. Oil Trade Mechanisms in Practice
3.1 Global Oil Markets
Oil is traded in both physical markets and futures markets:
Physical market: Actual crude is bought and sold, usually under long-term contracts or spot deals.
Futures market: Contracts on exchanges (like NYMEX or ICE) allow traders to speculate or hedge against oil price movements.
Both markets are dominated by U.S. dollar pricing benchmarks such as:
WTI (West Texas Intermediate) – benchmark for U.S. oil.
Brent Crude – benchmark for international oil trade.
3.2 Shipping & Logistics
Oil trade relies heavily on maritime transport. Tanker routes like the Strait of Hormuz, Suez Canal, and Strait of Malacca are chokepoints critical to supply. Insurance, shipping contracts, and freight charges also link back to dollar-based systems.
3.3 Role of OPEC and Non-OPEC Producers
OPEC, founded in 1960, has historically coordinated oil output to influence prices. But newer players like Russia, the U.S. (via shale oil), and Brazil also play major roles. Despite these shifts, the dollar remains the settlement currency.
3.4 Derivatives and Financialization
Beyond physical barrels, oil is increasingly a financial asset. Banks, hedge funds, and institutional investors use futures, options, and swaps to speculate or manage risk. The fact that all these instruments are denominated in dollars further entrenches the petrodollar.
4. Geopolitical Implications of the Petrodollar
4.1 Dollar Hegemony
The petrodollar is a cornerstone of U.S. financial dominance. Control over oil trade means:
U.S. sanctions become extremely powerful (cutting nations off from dollar-based transactions).
Countries are incentivized to hold dollar reserves.
American banks and financial institutions dominate global capital flows.
4.2 Middle East Politics
The U.S.–Saudi alliance is at the heart of the petrodollar system. U.S. military presence in the Middle East has often been tied to protecting oil flows and ensuring dollar-denominated trade.
4.3 Wars and Petrodollar Resistance
Countries that attempted to bypass the petrodollar often faced geopolitical pushback:
Iraq (2000): Saddam Hussein switched oil sales to euros. The U.S. invasion in 2003 reversed this.
Libya (2010): Muammar Gaddafi proposed a gold-backed African dinar for oil. NATO intervention soon followed.
Iran: Has long sought to sell oil in euros, yuan, or barter arrangements, facing heavy U.S. sanctions.
4.4 Rise of China and Yuan Internationalization
China, the world’s largest oil importer, has pushed for alternative arrangements:
Launching Shanghai crude oil futures denominated in yuan.
Signing oil-for-yuan agreements with Russia, Iran, and others.
Promoting the “petroyuan” as a challenger to the petrodollar.
5. Economic Effects of the Petrodollar System
5.1 On the U.S.
Benefits: Cheap financing, stronger global financial role, ability to run deficits.
Risks: Overreliance on dollar demand can mask structural weaknesses in U.S. manufacturing and trade.
5.2 On Oil Exporters
Oil-rich nations earn vast revenues, but dependence on dollars ties them to U.S. monetary policy. Petrodollar inflows can also create “Dutch Disease”—overdependence on oil revenues at the expense of other sectors.
5.3 On Importing Countries
Nations must secure dollars to pay for oil. This can create vulnerability during dollar shortages, especially in developing countries, leading to debt crises (e.g., Latin America in the 1980s).
5.4 On Global Finance
Petrodollar recycling has fueled global liquidity. But when oil prices collapse, dollar inflows shrink, causing volatility in emerging markets and banking systems.
6. Challenges to the Petrodollar System
6.1 Shift Toward Multipolarity
The world is moving toward multipolar finance, with alternatives like:
Petroyuan (China).
Digital currencies and blockchain settlements.
Barter systems (oil-for-goods agreements).
6.2 U.S. Sanctions Overuse
While sanctions are a powerful tool, their frequent use pushes countries to seek alternatives to dollar-based trade. Russia, Iran, and Venezuela are examples of nations turning to non-dollar settlements.
6.3 Renewable Energy Transition
As the world moves toward renewable energy and electric vehicles, long-term oil demand may decline. This could erode the centrality of the petrodollar in the global system.
6.4 De-dollarization Movements
Countries like BRICS members (Brazil, Russia, India, China, South Africa) are actively promoting alternatives to dollar dominance. The creation of BRICS financial frameworks could reduce reliance on the petrodollar.
Conclusion
The petrodollar system has been one of the most powerful and enduring mechanisms in the modern global economy. It links the world’s most traded commodity—oil—to the U.S. dollar, reinforcing American financial dominance for nearly five decades. Oil trade mechanisms, whether through physical barrels, futures contracts, or financial derivatives, all flow through this system, shaping the destiny of nations.
However, the petrodollar is not invincible. Geopolitical rivalries, overuse of U.S. sanctions, the rise of China, and the gradual energy transition toward renewables are all eroding its absolute dominance. While the dollar is unlikely to lose its central role overnight, the world is clearly moving toward a more multipolar currency system for energy trade.
The story of the petrodollar is not just about oil or money—it is about power, politics, and the architecture of the global economy. Its future will depend on how nations navigate energy transitions, financial innovations, and geopolitical shifts in the decades to come.

Using simple volume for added confluence in Elliott Wave Theory!Shown on the chart is 2 of the ways you can use the highest volume spikes on the chart to find out where you are in the wave count. Easiest way is to find the highest volume with the steepest slope of trend to label as your third wave. Same concept whether its bearish bars printing or bullish bars. The highest volume shown is actually part of the retracement, albeit in one of the actionary waves (moving with trend), alot of buying happened at the termination of the wave C of the zig zag shown in green. Perfect scenario to rake in buy orders from retail then dump on them to finish out the WXY pattern. This is just 2 of the many scenarios in which you can find help from the volume oscillator to give you a directional bias in Elliott Waves. Happy Trading