PEPE to outpace majorsI wouldn't mind trading PEPE here. Not much reason other than the fact it's a Tier 1 meme and that it's getting more bids out of this relief rally than bitcoin. Comes with a crisp 3:1 reward:risk. Don't forget to set your stop loss!
Crypto market

#1000PEPEUSDT #4h (ByBit) Descending trendline breakout & retestPepe The Frog just regained 50MA support and is pulling back to it, seems to be heading towards 200MA resistance after.
⚡️⚡️ #1000PEPE/USDT ⚡️⚡️
Exchanges: ByBit USDT
Signal Type: Regular (Long)
Leverage: Isolated (5.0X)
Amount: 5.0%
Current Price:
0.0116140
Entry Targets:
1) 0.0114203
Take-Profit Targets:
1) 0.0132591
Stop Targets:
1) 0.0104987
Published By: @Zblaba
CRYPTOCAP:PEPE BYBIT:1000PEPEUSDT.P #Pepe #Meme pepe.vip
Risk/Reward= 1:2.0
Expected Profit= +80.5%
Possible Loss= -40.3%
Estimated Gaintime= 1 week

BTC market-maker probability weightIf the price of BTC reaches the level of $70,000, shorts will be liquidated by $3.5 Billion.
And if the price of BTC reaches the level of $51,500, then longs will liquidate about $10 Million.

Could SHIBA bounce from here?Price is falling towards a support level which is an overlap support that is slightly below the 50% Fibonacci retracement and could bounce from this level to our take profit.
Entry: 0.1670
Why we like it:
There is an overlap support that is slightly below the 50% Fibonacci retracement.
Stop loss: 0.1621
Why we like it:
There is a pullback support level.
Take profit: 0.1726
Why we like it:
There is an overlap resistance level.
Please be advised that the information presented on TradingView is provided to Vantage (‘Vantage Global Limited’, ‘we’) by a third-party provider (‘Everest Fortune Group’). Please be reminded that you are solely responsible for the trading decisions on your account. There is a very high degree of risk involved in trading. Any information and/or content is intended entirely for research, educational and informational purposes only and does not constitute investment or consultation advice or investment strategy. The information is not tailored to the investment needs of any specific person and therefore does not involve a consideration of any of the investment objectives, financial situation or needs of any viewer that may receive it. Kindly also note that past performance is not a reliable indicator of future results. Actual results may differ materially from those anticipated in forward-looking or past performance statements. We assume no liability as to the accuracy or completeness of any of the information and/or content provided herein and the Company cannot be held responsible for any omission, mistake nor for any loss or damage including without limitation to any loss of profit which may arise from reliance on any information supplied by Everest Fortune Group.

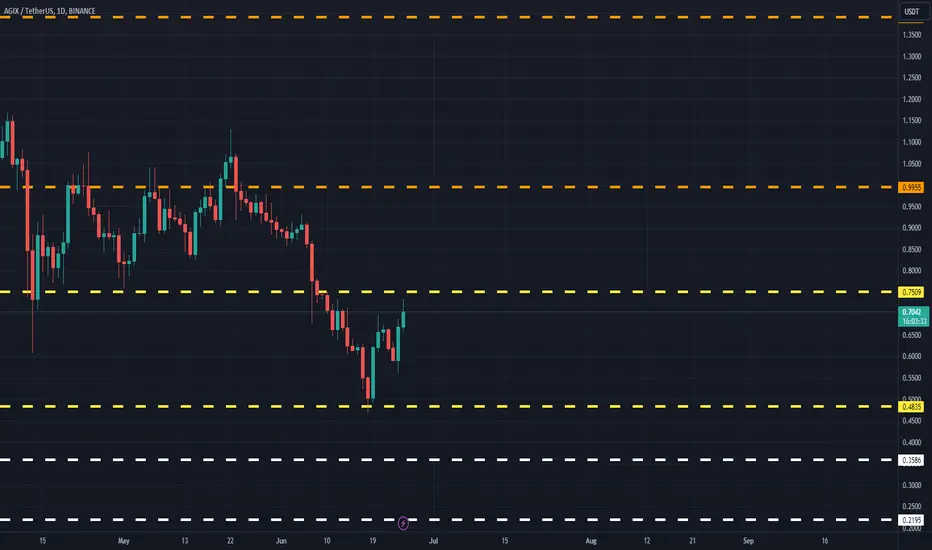
AGIXUSDT(SingularityNet) Daily tf Range Updated till 25-06-24AGIXUSDT(SingularityNet) Daily timeframe range. it had a retrace back close to 0.7509. it needs a little bit more volume for to break over 0.7509 clean which can later lead to 0.9955. local retrace point is at 0.4835.
Jun.19-Jun.25(ETH)Weekly market recapThe market fell further as we expected last week. During the economic data window, the market began to price in only one interest rate cut this year. This is not just for crypto market, but for all financial markets. This is likely to last until early July, before bulls come back and bring enthusiasm again. During this period, the PCE released this Friday will bring about a small rebound.
In addition, multiple BTC ETFs have experienced net outflows for several consecutive days, which is also a microcosm of the US market sentiment. After some asset management companies submitted S-1 documents for the ETH ETF, the market expected that the ETH ETF would be officially listed in early July, which would also bring about a small-level rebound.
Regardless, we are on the way to a rate cut, and the long-term trend for all types of financial assets must be upward.
ETH fell less than BTC. This may be related to the upcoming listing of ETF ETH. Yesterday's decline saw significant trading volume, but eventually a pin-bar formed. For ETH, the MBF indicator does not indicate bottom-buying sentiment. There is no obvious blue column representing whales on the TSB indicator. The ME indicator continues to maintain a bullish trend, but the wavy area gradually narrows.
To sum up, we believe that ETH is likely to remain fluctuating this week. We maintain our original resistance level 4000 and support level 2800.
Disclaimer: Nothing in the script constitutes investment advice. The script objectively expounded the market situation and should not be construed as an offer to sell or an invitation to buy any cryptocurrencies.
Any decisions made based on the information contained in the script are your sole responsibility. Any investments made or to be made shall be with your independent analyses based on your financial situation and objectives.

Jun.19-Jun.25(BTC)Weekly market recapThe market fell further as we expected last week. During the economic data window, the market began to price in only one interest rate cut this year. This is not just for crypto market, but for all financial markets. This is likely to last until early July, before bulls come back and bring enthusiasm again. During this period, the PCE released this Friday will bring about a small rebound.
In addition, multiple BTC ETFs have experienced net outflows for several consecutive days, which is also a microcosm of the US market sentiment. After some asset management companies submitted S-1 documents for the ETH ETF, the market expected that the ETH ETF would be officially listed in early July, which would also bring about a small-level rebound.
Regardless, we are on the way to a rate cut, and the long-term trend for all types of financial assets must be upward.
Over the past seven days, BTC has fallen continuously, pulling back below the given support level, but there has been no significant increase in trading volume. After BTC approached a low, the MBF indicator once again showed obvious bottom-buying sentiment. As shown in the chart, the last time the MBF indicator prompted bottom-buying sentiment was in early May, and then BTC rose to ATH again. On the WTA indicator, there have been no obvious blue columns representing whales over the past week. The ME indicator continues to maintain a bullish trend, but the wavy area further narrows.
To sum up, we believe that BTC may rebound after approaching the low of the range. We maintain the original resistance level 74000 and temporarily lower the support level to 58000.
Disclaimer: Nothing in the script constitutes investment advice. The script objectively expounded the market situation and should not be construed as an offer to sell or an invitation to buy any cryptocurrencies.
Any decisions made based on the information contained in the script are your sole responsibility. Any investments made or to be made shall be with your independent analyses based on your financial situation and objectives.

LONG BITCOIN 57000 ALL trading ideas have entry point + stop loss + take profit + Risk level.
hello Traders, here is the full analysis for this pair, let me know in the comment section below if you have any questions, the entry will be taken only if all rules of the strategies will be satisfied. I suggest you keep this pair on your watchlist and see if the rules of your strategy are satisfied. Please also refer to the Important Risk Notice linked below.
Disclaimer

VET longVET looks good to long...
Let's wait for retest of BTC and market for a better entry...
No hurry... Respect the risk...


$$$BITCOIN, Going to hit 66k soon.Welcome, Trader. Welcome to our cryptocurrency community!
We are going to discussing #BTCUSDT 💹
#BTCUSDT🔥🚀
---------------
Update:
#BFC tests the 60k area and take a bullish turn from the major support zone✅👉.
Currently moving at the support area of a channel.➡️✅
As it test the 60k favourite area, so we are expecting 66K very soon.📈👀
Crypto Analyst Hub
#crypto #cryptocurrency #bitcoin #ethereum #blockchain #btc #cryptotrading #cryptonews #eth #cryptocurrencies #nft #bitcoinnews #bitcoins #trading #bitcoinmining #forex #binance #cryptoart #nfts#trading #forex #trader #investing #stocks #forextrader #stockmarket #daytrader #forextrading #invest #bitcoin #daytrading #cryptocurrency #crypto #investor #investment #forexsignals #nse #chartpattern #cedarforex #candlepatterns #learntrading #bseinstitute #shorttermtrade #bankniftytrading #stockmarketph #calloptions #mqlsignal #futuretrader #tradingmemes #chartpatterns #tradingview #tradinglife #tradinglifestyle #tradingstrategy #tradingtips #tradingplan #tradingsignals #tradingaccounts #tradingsignal #tradingforex #tradingsync #tradingroom #litecoin #ethereum #bitcoincash #cryptocurrencies #ripple #btc #bitcoinnews #bitcoinmining #blockchain #eth #bitcoin #bitcoins #coinbase #cryptocurrency #crypto #bitcointrading #dogecoin
BTC
ETH
USDT
PEPE
DOGE

MMPRO - Exiting from stage 1!As we can see from the chart, stage 1 was highlighted around 0.12$ level, where we are having a break out, and the price is trying to reach the 0.15$ level as first, which is about +20% from actual prices.
Volumes are growing, and we can expect a x2 in price soon seen the project fundamentals.
Lets see how it works out!
Good trading!!

BTCUSDTHello guys
My idea 💡 about BTCUSDT is,
Btc is during the correction and after correction will be complete, BTCUSDT have 2 targets 🎯
0.Correction 52k-58k
1.about 100 k
2.about 170 k

AGIXUSDT Alert: Major Breakout Could Signal Strong Bullish Move!Yello, Paradisers! Did you see our recent prediction about #AGIXUSDT breaking above its resistance? Well, it just happened! Let's dive into what this means for your trading strategy.
💎#AGIX has successfully broken above the resistance zone at $0.6903, indicating a significant bullish potential. If AGIX holds this level, we could see a robust bullish movement. If the price maintains its momentum at this new support, there's a high probability of a bullish ride towards the next resistance zone at $0.9280.
💎Should #AGIX break above $0.9280, the next target is the subsequent resistance zone. Conversely, if the price fails to sustain momentum at the current support, we expect a potential bullish rebound from the lower demand zone around $0.6288.
💎Staying vigilant is crucial. Keep a close eye on AGIX's price movements. A breakdown below the $0.6288 demand area, confirmed by a daily closure, would challenge our bullish outlook and could lead to further declines.
It's essential to remain patient and disciplined. Strive for consistent profitability by waiting for the best, highest probability trading opportunities.
MyCryptoParadise
iFeel the success🌴

ALT SEASONthis is alt season in reverse. the scammers on trading view have been selling you alt season for a few years now but when price goes below every single support level in its path and cannot break above any resistance level, the only direction is down to hell and also im sorry for saying this, but most people relying on scammers for trading data deserve that hell.


Litecoin shortLitecoin bounced off the 0.5 Fibonacci retracement level. Bearish movement is likely to continue and reach the 67.7.

AAVE short setupThe basic structure of AAVE is bear. This pullback can be considered an internal pullback.
A good supply range in this permanent area
The targets are marked on the chart.
Closing a daily candle above the invalidation level will violate the analysis.
Note that the financial market is risky, so:
Do not enter any position without confirmation and trigger.
Do not enter a position without setting a stop.
Do not enter a position without capital management.
When we reach the first TP, save some profit and try to move the stop continuously in the direction of your profit.
If you have any comments please post them, comments will help us improve our performance
Thanks


ETHUSDT 5 days away?Accumulation takes about 4 months as per you can see on the charts, and now we are 5 days away from reaching the 4 months...
My AVWAP is about to touch resistance around the 1,900, and the short volume its on a decline, but RSI its on the overbought side.
Is a bullish period about to come?
What are your thoughts?

SOL MARKED STRUCTURE SHIFTED INTO BULLISH | READY FOR 200$.Whole market was struggling in recent days. If we look at SOLUSDT chart then it has taken higher time frame poi with liquidation hunting wick. Now has broke through recent high and did clear market structure shift into bullish side. So as MSS has been done so we are looking for FVG and Sell side liquidity to build long position, which I have marked onto the chart as well. You can keep eye on that marked FVG and SSL.

BTCUSDApply risk management
Risk Warning: Trading in CFDs is highly speculative and carries a high level of risk. It is possible to lose all of your invested capital. These products may not be suitable for everyone, and you should ensure that you fully understand the risks taking into consideration your investment objectives, level of experience, personal circumstances as well as personal resources. Speculate only with funds that you can afford to lose. Seek independent advice if necessary. Please refer to our Risk Disclosure.
BDSwiss is a trading name of BDS Markets and BDS Ltd.
BDS Markets is a company incorporated under the laws of the Republic of Mauritius and is authorized and regulated by the Financial Services Commission of Mauritius ( FSC ) under license number C116016172, address: 6th Floor, Tower 1, Nexteracom Building 72201 Ebene.
BDS Ltd is authorized and regulated by the Financial Services Authority Seychelles (FSA) under license number SD047, address: Suite 3, Global Village, Jivan’s Complex, Mont Fleuri, Mahe, Seychelles. Payment transactions are managed by BDS Markets (Registration number: 143350)
Disclaimer

(ETH) ethereumA made up idea here. The lines converge in the middle of july. If the price of Ethereum climbs towards that moment there is a good chance Ethereum crashes. If the price of Ethereum stays neutral or even declines leading to the middle of July there is a good chance the price of Ethereum rises. Mysterious.
The Olympics start at the end of July. . . . . . .
