TOTAL 3 BULLRUN ??Hello everyone.
We can see a similar structure to that of December - February (yellow triangles). It is possible that the bearish sentiment has ended. BOTTOM IS IN !!!!
The last phase of the cycle, THE BULL RUN, is about to START.
(NOT FINANCIAL ADVICE)
Crypto market


Will Bitcoin bonce off the Power Law trend this time?After each halving event in the past bitcoin price tend to come back to the blue "buy zone".
Currently bitcoin price toched the 15 year long Power Law trend (green line).
It is the perfect line to bounce off. However, if we analyze the previous 3 halving events we will see that the blue zone was hit each time after halving. In the current cycle this means that the price may come in below 50k zone, but not for very long time.
The lower wave band is corrently at about 40k level.
Let's see the outcome.

Gala (GALA)On the above 4-day chart price action has recently corrected 50% since a sell signal in late January (ask below if you wish to see). A number of reasons now exist to be long..
1) You know why.
2) Price action finds support on the golden ratio.
3) There is a positive divergence between RSI and price action.
4) The bull flag channel, naturally a bullish pattern on confirmation of a breakout to the upper side of the channel.
5) A breakout confirmation will result in a 300% gain from current levels.
Is it possible for price action to fall further? Sure.
Is it probable? No.
Ww
Type: Trade
Risk: <= 6%
Timeframe to open: Now
Return: 300%

BTC FUD !!!Rejection level 60120 + technicaly support at this bullrun. I'm expecting to see 73k from this point

BTCUSDT - BULLISH PENNANT, CORRECTION. BREAKOUTToday I'm presenting for your consideration a weekly chart of BITCOIN that over the span of 5 MONTHS has been forming a Bullish Pennant Pattern. The Pattern however is not yet fully formed and though the price has attempted to retest on several occasions now at it's All Time High, the Price has fallen back each time as it appears to consolidate. What we need to see yet is a strong pullback down to approximately $65,049, likely to happen by the first week of July that will give us a bottom and subsequent rise up to $70,392 at which point the Pennant pattern will be complete and I will expect a breakout in the last week of July. The next move after that would be to $73,777. to equal the previous High. The Flag Pole of the Pennant is $31519 so from the Breakout level of $70,392 that will give us a potential run into new territory that could last several month up to $101,911. Also one of my primary indicators that I like to use for Price Reversals is the Money Flow Index. As you can see with the MFI it has formed a Very Strong Negative Divergence in the opposite direction of the rise and subsequent neutral trend of the current price making me Strongly believe the Price will retrace as much as 5.8% from $69k. In total the Pennant will take another 7 weeks to complete before the breakout. Now because I don't trade in BTC I will take positions first of all in BITI and then switch over to BITO for the Bullish Reversal and Breakout. The expected gain over the span of the next 5-6 months is a minimum of 40% - 50% playing this strategy.

$People/USDT Falling Wedge Formed$Dear Traders, 🚀📈
We are convening a discussion focused on #People
#PEOPLEUSDT 🔎🚀
-------------------
⏰ Time Frame: 6H
The Falling Wedge Pattern is Formed ✅😎
Now it's Ready to Break the Pattern 🤑
In Case of Successful Breakout, Expecting a Bullish Move of 60% 🚀📈🤞
#crypto #cryptocurrency #bitcoin #ethereum #blockchain #btc #cryptotrading #cryptonews #eth #cryptocurrencies #nft #bitcoinnews #bitcoins #trading #bitcoinmining #forex #binance #cryptoart #nfts#trading #forex #trader #investing #stocks #forextrader #stockmarket #daytrader #forextrading #invest #bitcoin #daytrading #cryptocurrency #crypto #investor #investment #forexsignals #nse #chartpattern #cedarforex #candlepatterns #learntrading #bseinstitute #shorttermtrade #bankniftytrading #stockmarketph #calloptions #mqlsignal #futuretrader #tradingmemes #chartpatterns #tradingview #tradinglife #tradinglifestyle #tradingstrategy #tradingtips #tradingplan #tradingsignals #tradingaccounts #tradingsignal #tradingforex #tradingsync #tradingroom #litecoin #ethereum #bitcoincash #cryptocurrencies #ripple #btc #bitcoinnews #bitcoinmining #blockchain #eth #bitcoin #bitcoins #coinbase #cryptocurrency #crypto #bitcointrading #dogecoin CRYPTOCAP:BTC CRYPTOCAP:ETH CRYPTOCAP:USDT CRYPTOCAP:PEPE CRYPTOCAP:DOGE NASDAQ:ALT

1W BTC shake-out until 2024-08-08, then soar for 2025-08 peakThis is a 1W alternative view for the 1D idea here:
BTC shake-out until 2024-08-08, then soar for 2025-08 peak
Increased Speculation Strains Bitcoin Market
The recent slowdown in the Bitcoin market can be attributed to several factors, including a shift in investor behavior. Many individuals treated cryptocurrencies like checking accounts, fueling excessive speculation instead of adopting a long-term investment approach similar to certificates of deposit or traditional bonds (excluding ETF bonds). This speculative frenzy led to a depletion of disposable income, straining the financial health of the middle class. As a result, businesses are experiencing a drop in revenue due to decreased middle-class consumption.
Technical Analysis: Shakeout and Potential Price Movement
From a technical analysis perspective, Bitcoin (BTC) is anticipated to remain in a consolidation phase, or "shakeout," for the next 46 days, potentially ending on or before August 8th, 2024. This suggests a period of price fluctuations without a clear upward or downward trend. Following this, a price rise is expected, with initial signs appearing as early as July 2024, but a more substantial increase is likely between August 2024 and peaking in August 2025.
Long-Term BTC Cycle: Boom, Bust, and Renewal
While the prediction is for a peak in August 2025, it's crucial to consider the cyclical nature of Bitcoin. Historically, Bitcoin has followed boom-and-bust cycles. Following the 2025 peak, a significant bear cycle is anticipated, potentially leading to a crash extending until August 2028. This extended downturn could be exacerbated by potential recessions in 2025 and/or 2026, coupled with continued inflationary pressures. However, this bear cycle is likely to be followed by a new bull cycle, mirroring past Bitcoin market behavior.
Historical Performance and Potential Entry Points (Informational Only):
This section presents investment strategies that have aligned well with historical market trends, along with potential future holding entry points based on the provided data. It's crucial to understand that past performance is not a guarantee of future results, and the cryptocurrency market remains highly volatile.
November 2021: Holding USDT (Tether)
March 2022: Holding PAXG (Gold)
December 2022: Holding BTC (Bitcoin)
August 2025 (roughly +/- 4 months): Holding USDT (Tether)
January 2026 (roughly +/- 3 months): Holding PAXG (Gold)
Historical Data Chart:
NOTE: The vertical white lines on this 1W chart above this comment represents the halving points for BTC.

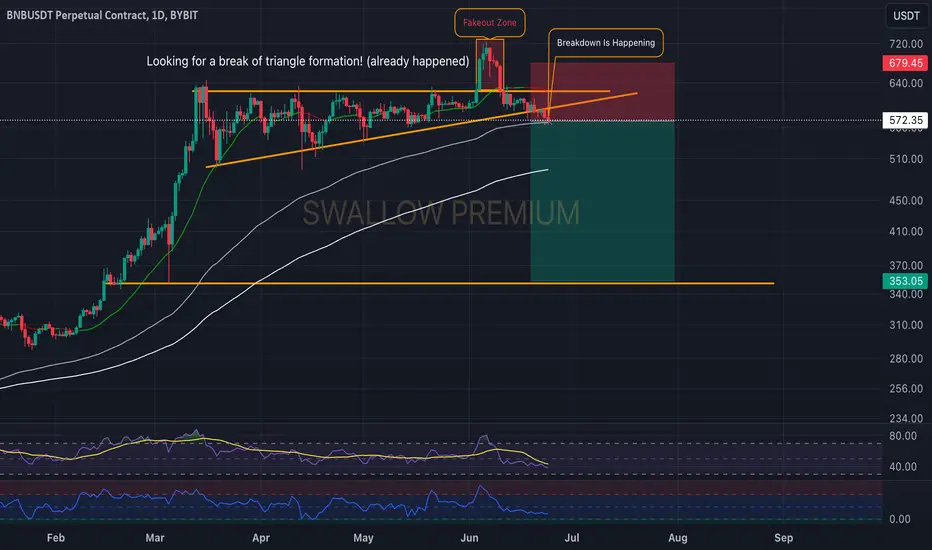
Binance Coin (BNB): Breaking Drown from Triangle Formation!BNB has broken down from triangle formation, leading the price towards 100 EMA (which we are looking to be broken).
As soon as we see a breakdown from 100EMA, we should see a further downward movement towards 200EMA and the local support zone as well!
Swallow Team
ADAUSDTADAUSDT.
Will ADAUSDT get bids from buyers ?
As the price is at strong support level and bullish divergence indicating the buyers may attack this zone. If this happens and buyers start buying from here then the next target could be 0.4 followed by 0.4500
What you guys think of this idea?

Could Litecoin rise from here?Price is currently at a support level which is a pullback support and could potentially rise from this level to our take profit.
Entry: 70.84
Why we like it:
There is a pullback support level.
Stop loss: 67.28
Why we like it:
There is a pullback support level which lines up with the 161.8% Fibonacci extension.
Take profit: 75.07
Why we like it:
There is a pullback support level.
Please be advised that the information presented on TradingView is provided to Vantage (‘Vantage Global Limited’, ‘we’) by a third-party provider (‘Everest Fortune Group’). Please be reminded that you are solely responsible for the trading decisions on your account. There is a very high degree of risk involved in trading. Any information and/or content is intended entirely for research, educational and informational purposes only and does not constitute investment or consultation advice or investment strategy. The information is not tailored to the investment needs of any specific person and therefore does not involve a consideration of any of the investment objectives, financial situation or needs of any viewer that may receive it. Kindly also note that past performance is not a reliable indicator of future results. Actual results may differ materially from those anticipated in forward-looking or past performance statements. We assume no liability as to the accuracy or completeness of any of the information and/or content provided herein and the Company cannot be held responsible for any omission, mistake nor for any loss or damage including without limitation to any loss of profit which may arise from reliance on any information supplied by Everest Fortune Group.

Ethereum (ETH): 100EMA Is Being Tested + Possible Short?Ethereum has a similar pattern to Bitcoin, with 2 fakeout zones formed near the local ATH zone (within our timeframe).
With that being said, Ethereum is also testing the 100EMA and looking to fully secure it before moving back to testing the 200EMA.
We are waiting for a breakdown and a movement to 200 EMA (potentially breaking it as well).
Swallow Team

Solana Price UpdateSOL Update in the Daily Timeframe.
SOL in the daily timeframe is holding strong support at $128, and we are likely to see a 25% to 35% bounce-back in the upcoming days.
The invalidation point will be a daily close below the $128 support level.
Leverage trading with 2x to 3x and a stop-loss below the support level can be considered a risk-taking strategy.
Do your own research. Not financial advice.

SOLANA Gearing up for 40% rally!SOL is gearing up for a 40% rally from its current support level.
From its current price of $135, SOL is likely to reach up to $170 soon.
Entry: From $120 to CMP.
Invalidation/SL: $116.
Target: $148, $155, $163, $172.
Leverage: 2x to 3x.
Note: Do your own research before investing. Not financial advice.
#Solanaseason24

A 800% move to $6000 for Binance token (BNB) by September?On the above monthly chart of BNB token there is easily an hour of topic to discuss. However attention spans amongst the equity providers do not afford a detailed explanation so the short version..
1) Price action is in a legacy uptrend channel since inception with a confirmation of uptrend continuation (unlike LTC).
2) Price action is at resistance after three years of consolidation. This is the third test of resistance. Blue pointing down arrows.
3) Just as with May 2020 prior to the break of resistance, Stochastic RSI previously crossed above 80. (orange arrows). This is the same situation as today. Stochastic RSI remains with momentum for 182 days. Should history repeat, momentum continues until August / September.
4) The bull flag pattern confirms a breakout AND support. A measured move from the flagpole of the last resistance breakout takes price action to $6000.
Is it possible price action corrects? Sure.
Is it probable? No.
Ww
Type: trade
Risk: <=6%
Timeframe for long: You decide
Return: 800% over the next 16 weeks

REACH is gonna reach for the starsREACH is forming a nice bottom structure which reminds me of BONK before take-off. Also the RSI is printing higher highs on the daily since the beginning of May. The volume is going up, whales are accumulating for sure.
With only $2.5 Million fully diluted marketcap and 100% of the coins in circulation this AI web3 social-fi protocol could surprise a lot of people in the upcoming bullrun.

Turbo break outTurbo is closing above resistance levels and is about to hit an uptrend Fibonacci sequence. With BTC bouncing from a low of $58,400, this could be a great setup if BTC remains stable.
For those who are not familiar, Turbo is the new meme coin for this bull run. This AI coin has shown great potential and still has a low market cap of only $350 million. With a market cap of $4.2 billion, we can expect a price of $0.6 (11 times the current price).

$BTC ready for relaunch? In this video we breakdown the current downtrend in #BTC. I see this making a u-turn in the near future, but we are ready to go short should the levels noted in the video break!!

Litecoin (LTC), imminent collapse to $30?And possibly below $10 after that?
Most if not all Alt-tokens have returned to their 2017 lows with 95% to 98% corrections since 2021. Pick any token popular at that time:
1) DASH.. 95% correction with a return to $25 in 2023 as it was in 2017. Inflation adjusted, the price should be $19! A bucket of expired sardines in a Norwegian Fish-market has gained more value.
2) XLM -90%
3) HBAR -95%
4) ADA -95%
5) NEO -95%
6) ETH -75% (massively bearish still!)
7) SOL -96%
It is everywhere you look, 95% corrections are all over.
Currently Litecoin is at an 85% correction. 95% takes price action to $15. Inflation adjusted, less than $10.
The technical analysis also supports the outlook. On the above 10 day chart:
a) A significant trend-line support has broken (orange line). Over the last 10 years Litecoin has enjoyed a continuous uptrend. The support has now failed AND confirmed. Yes price action could rally to $130-140, the bulls would get excited. Regardless, breaking this confirmed resistance will not be easy.
b) The 2nd bear flag breakout. It has confirmed. A 70% correction from the exit point measures to $28.
c) If support at $28 does not confirm, the next support is just under $10, the full 95% correction like everything else.
Is it possible price action continues sideways? Sure.
Is it probable? No.
Ww

Bitcoin just about completes range extension#Bitcoin bulls have been silenced overnight, and North American #crypto traders waking up a bit stunned I suppose. Keep in mind we have almost completed a range extension.

$$$GRTUSDT, Forming a bullish falling wedge.Welcome, Trader. Welcome to our cryptocurrency community!
We are going to discussing #GRTUSDT 💹
#GRTUSDT🔥🚀
---------------
Update:
#PEOPLE is formed a bullish falling wedge pattern over a 6 Hr time frame✅👉.
Currently moving inside it and resting just above the major support.➡️✅
If it retest the major support zone, we are expecting 45% very soon.📈👀
Crypto Analyst Hub
#crypto #cryptocurrency #bitcoin #ethereum #blockchain #btc #cryptotrading #cryptonews #eth #cryptocurrencies #nft #bitcoinnews #bitcoins #trading #bitcoinmining #forex #binance #cryptoart #nfts#trading #forex #trader #investing #stocks #forextrader #stockmarket #daytrader #forextrading #invest #bitcoin #daytrading #cryptocurrency #crypto #investor #investment #forexsignals #nse #chartpattern #cedarforex #candlepatterns #learntrading #bseinstitute #shorttermtrade #bankniftytrading #stockmarketph #calloptions #mqlsignal #futuretrader #tradingmemes #chartpatterns #tradingview #tradinglife #tradinglifestyle #tradingstrategy #tradingtips #tradingplan #tradingsignals #tradingaccounts #tradingsignal #tradingforex #tradingsync #tradingroom #litecoin #ethereum #bitcoincash #cryptocurrencies #ripple #btc #bitcoinnews #bitcoinmining #blockchain #eth #bitcoin #bitcoins #coinbase #cryptocurrency #crypto #bitcointrading #dogecoin
BTC
ETH
USDT
PEPE
DOGE

ETH - Now We Wait!Hello TradingView Family / Fellow Traders. This is Richard, also known as theSignalyst.
📈 ETH has been bearish trading within the falling channel pattern marked in orange.
Currently, ETH is approaching the lower bound of the channel.
Moreover, it is retesting a strong demand zone $3,100 - $3,200.
🏹 Thus, the highlighted blue circle is a strong area to look for buy setups as it is the intersection of the green demand zone and lower orange trendline acting as a non-horizontal support.
📚 As per my trading style:
As #ETH approaches the blue circle zone, I will be looking for bullish reversal setups (like a double bottom pattern, trendline break , and so on...)
📚 Always follow your trading plan regarding entry, risk management, and trade management.
Good luck!
All Strategies Are Good; If Managed Properly!
~Rich

Trading Signal For FTMUSDT Fantom (15m) Trading Setup:
There is a Trading Signal to Sell in FTMUSDT Fantom (15m) (futures)
Traders can open their Sell Trades NOW
⬇️ Sell now or Sell on 0.5880
⭕️SL @ 0.6130
🔵TP1 @ 0.5269
🔵TP2 @ 0.4905
🔵TP3 @ 0.4425
What are these signals based on?
Classical Technical Analysis
Price Action Candlesticks Fibonacci
RSI, Moving Average , Ichimoku , Bollinger Bands
Risk Warning
Trading Forex, CFDs, Crypto, Futures, and Stocks involve a risk of loss. Please consider carefully if such trading is appropriate for you. Past performance is not indicative of future results.
If you liked our ideas, please support us with your likes 👍 and comments .
