BTCUSD Analysis - Selling OpportunityBTCUSD Analysis - Selling Opportunity
Open: 69600
SL: 75000
TP: 37000
Crypto market

Whispers from the Estate A Noble Decree to Long the COINA Discourse of Nobility: Bitcoin's Majestic Journey from 67,700 to the Sovereign Heights of 72,000
Ah, my esteemed companion, allow us to embark on a distinguished dialogue concerning the wondrous journey of Bitcoin, that most illustrious of digital treasures. With the refinement and discernment befitting our elevated station, let us contemplate the anticipated ascent of Bitcoin from its current valuation of 67,700 to the regal summit of 72,000.
Bitcoin, the crown jewel of the digital realm, stands as a beacon of innovation and resilience in the tumultuous seas of finance. Its genesis marked a paradigm shift, heralding an era where decentralized currencies reign supreme, untouched by the constraints of traditional monetary systems. It is with this in mind that we must consider the forthcoming rise in its price, a phenomenon that shall undoubtedly reaffirm its sovereignty in the realm of digital assets.
Allow me to elucidate upon the factors that lend credence to the prognosis of this upward trajectory. The ever-evolving landscape of global finance, fraught with volatility and uncertainty, plays a pivotal role in shaping the fortunes of our revered Bitcoin. As traditional markets falter under the weight of geopolitical strife and economic instability, astute investors flock to the sanctuary of digital currencies, seeking refuge from the tempestuous tides.
Moreover, the burgeoning mainstream adoption of Bitcoin, facilitated by institutional investors and corporate giants, serves as a testament to its enduring relevance and intrinsic value. With each passing day, we witness a burgeoning acceptance of Bitcoin as a legitimate store of value and a hedge against inflation, further fueling its ascent.
Furthermore, the unparalleled scarcity of Bitcoin, enshrined within its very code, imbues it with a unique allure akin to that of precious metals. With a fixed supply cap of 21 million coins, Bitcoin stands as a bastion of digital scarcity, a trait that resonates deeply with discerning investors seeking to preserve their wealth in an era of monetary debasement.
Thus, my dear comrade, it is with great conviction and a sense of profound reverence that I assert the ascent of Bitcoin from its current perch of 67,700 to the exalted heights of 72,000. In this endeavor, we witness not merely a financial transaction but a testament to the transformative power of innovation and resilience.
In conclusion, as we embark upon the noble pursuit of longing for Bitcoin, let us do so with the sagacity and grace that befits our station. For in Bitcoin, we find not only a digital asset but a symbol of boundless potential and steadfast resolve.
May our decisions be guided by prudence, and may our cherished Bitcoin continue to illuminate the path towards a more prosperous future.

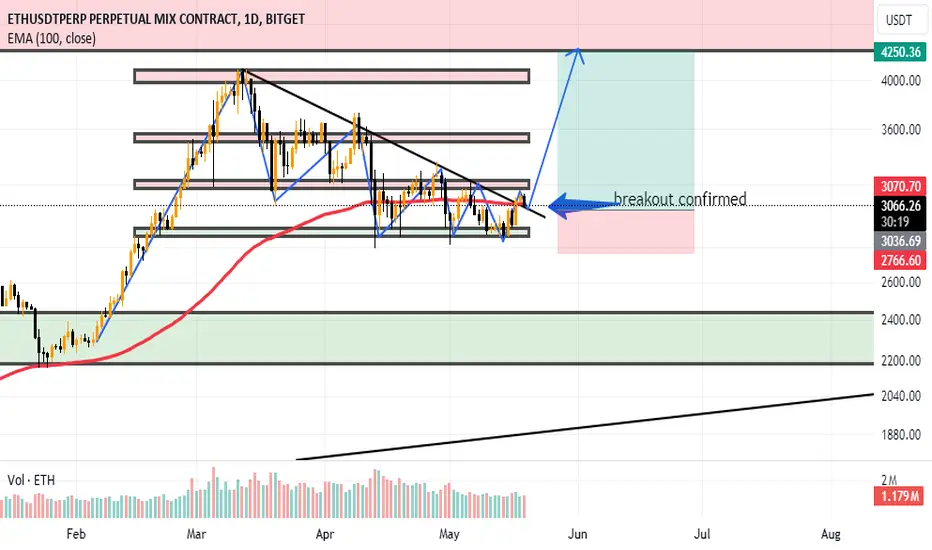
ETH Breakout confirmed on 4hETH 4h breakout confirmed market come to retest the trend line
lets take long entry
swing trade
entry :- 3060
take profit :-4050
stoploss:-2750
thanks me later
Alikze »» BABYDOGE | Ready to retest the supply areaAccording to the previous analysis, which was checked in the weekly time frame, until the dynamic trigger continued its growth, after which it faced a combined correction.
💎 Currently, in the 8H time frame, after a rise to the supply range and the constructed neckline, it has faced a correction to the green box area.
💎 Now it is inside a corner pattern in the green box range, which can grow up to 0.000000001864 in the first step and retest the dynamic trigger and the supply area again.
💎 Alternative scenario: if the green box is broken, it can continue the correction up to 0.000000001500 until the previous OB.
»»»«««»»»«««»»»«««
Please support this idea with a LIKE and COMMENT if you find it useful and Click "Follow" on our profile if you'd like these trade ideas delivered straight to your email in the future.
Thanks for your continued support.
Sincerely.❤️
»»»«««»»»«««»»»«««

TURBO Get ready for heavy pumping, another bonk is comingThe cup and pullback pattern is formed.
Heavy accumulations of whales (including okx wallet)
At least 1000% profit in two months.
Let it be remembered


202422 - a weekly price action after hour update - bitcoinbitcoin
Quote from last week:
bull case: Bulls need strong close above 67000 for 70000 and probably retest of ath. They tried 4 times now and failed. Market is also a wedge top on a lower time frame. Bulls have no good arguments around 67000.
comment: Last weeks my line in the sand for bulls was around 67250, since market was rejected there 3 times. Bulls finally broke above it with force and bears quickly retested that price and it turned support, which gives the bulls some momentum. Market has not touched the daily 20ema for 11 days, which is very bullish.
I have two paths forward Bitcoin could take imo. Either we are done with the latest small bull trend inside the bigger trading range and W5 ended at 71954 or W1 started around 61000 and the 71954 high was W3 and W5 could lead to a new ath. Answer should be given by Tuesday/Wednesday. Even if it makes a higher high, upside will probably be very limited and odds favor a continuation of the trading range.
current market cycle: Small bull trend (see channel) inside bigger trading range
key levels: 56000 - 74000
bull case: If bulls want another leg up for the ath, market should not drop below 68000 again. If it does, today was a lower high double top and we will trade sideways or down to break the bull channel. If bulls keep it above, their next target is the high of last week at 71954 and above the obvious ath magnet at 73805.
bear case: Bears see this rally done and the two legged correction missing the second leg down, which they want to get below 68000, break outside the bull channel and test the daily ema around 67500. I expect that Tuesday will give a decisive answer on this one. Right now I think the bears are slightly less favored.
short term: Neutral between 68000 - 72000. Market needs to break this range for higher or lower prices.
medium-long term: Down to 40000 (could take 3-6 months). Longer term than that time frame, I don’t know. Could also drop to 20000 again but let’s make 40000 first and see how many want to buy there. —unchanged
chart update: Adjusted bull channel, wave series and added possible two legged correction.

Ondousdt trading ideaOndousdt is demonstrating robust bullish momentum following a breakout from a bullish pennant formation.
The chart indicates a designated buyback area and the projected setup target. It remains to be seen how the price will respond to this development.
We welcome your insights and perspectives on this analysis.

btc supportThe point seen in the image
They show strong and important support in higher time frames
Open trigger
On the support levels if confirmed by Kendall and capital management.
W.A

ETH whales low volume signal has appeared! WHALES LOW VOLUME now put into action. Next is to wait until ETH WHALES say they’re ready to plunge. Whales low volume means BULL is ready to BULL RUN. Next move is to wait.
Price target $3,900

Alikze »» CRV | Congestion exit and dynamic trigger failureIn the weekly time, after a complex correction, now after exiting the concentration, it can take two paths in the face of the resistance ahead, of course,
🔰in the lower time, a shadow has been cast on the green box area. Therefore, after breaking the red bar, it will have the ability to grow up to the first supply zone, and if it continues, it can touch the second supply zone. If the behavior and structure of the post changes, it will be updated.
»»»«««»»»«««»»»«««
Please support this idea with a LIKE and COMMENT if you find it useful and Click "Follow" on our profile if you'd like these trade ideas delivered straight to your email in the future.
Thanks for your continued support.
Sincerely.❤️

Ethereum downside or breakout?Watching Ethereum (ETH) closely after it reached a high of $3,040 on a 4-hour timeframe chart today.
If support at $2,923 crumbles. A break below this level could send ETH down to $2,874.
However, there's also a chance for a breakout on the upside. If Ethereum can overcome resistance at $3,100, it could surge towards $3,160 or even $3,200.

Alikze »» FLOKI | Negative divergence in 1HIn 1 hour time, it is moving in an ascending channel.
It is currently within the range of the channel ceiling and the supply area.
According to the divergence that exists, a correction to the middle of the channel and the bottom of the green box range can be done.
💎 If it breaks the supply range, this divergence will be invalid. So for now I expect it to have another correction inside the channel and after it is finished it can move as wide as the channel to the next supply range.
💎 Alternative scenario: if the green box is broken, the upward path of the currency will be a little difficult and may face further correction.
If the behavior and structure of the post changes, it will be updated.
»»»«««»»»«««»»»«««
Please support this idea with a LIKE and COMMENT if you find it useful and Click "Follow" on our profile if you'd like these trade ideas delivered straight to your email in the future.
Thanks for your continued support.
Sincerely.❤️
»»»«««»»»«««»»»«««

#HOT Rally Alert: Your l to Buy and Prosper!**Technical Analysis Chart Description:**
Welcome to my Technical Analysis charts on TradingView! Before we dive into the analysis, it's essential to understand some important warnings:
1. **Subjectivity Alert:** Technical analysis involves interpreting market data and chart patterns, which can be subjective. Different analysts may interpret the same data differently, leading to varied conclusions.
2. **Historical Performance Doesn't Guarantee Future Results:** Past price movements do not guarantee future price movements. While historical data can provide insights, it's crucial to consider other factors that could influence price action.
3. **Risk of False Signals:** Technical indicators and chart patterns can produce false signals, leading to potential losses if relied upon blindly. Always cross-verify signals with other indicators or fundamental analysis.
4. **Market Volatility:** Crypto markets are highly volatile and can experience rapid price fluctuations. Be prepared for sudden and unexpected price movements, which may invalidate previously identified patterns.
5. **Risk Management:** Proper risk management is essential. Never invest more than you can afford to lose, and consider using stop-loss orders to mitigate potential losses.
6. **Emotional Bias:** Avoid emotional decision-making based on short-term price movements. Stick to your trading plan and strategy, and don't let fear or greed influence your decisions.
**Disclaimer for Crypto Trading:**
Trading cryptocurrencies carries inherent risks, and it's important to understand the following:
Cryptocurrency markets are highly speculative and can be subject to extreme volatility. Prices can fluctuate significantly within short periods, leading to substantial gains or losses.
Investing in cryptocurrencies involves the risk of total loss of capital. Unlike traditional assets, cryptocurrencies are not backed by any tangible assets or central authority, making them inherently risky.
Regulatory uncertainty and market manipulation are additional risks associated with cryptocurrency trading. Regulatory changes or negative news can have a significant impact on prices.
This analysis is for informational purposes only and should not be construed as financial advice. It's crucial to conduct thorough research and consult with a qualified financial advisor before making any investment decisions in the cryptocurrency markets.
By using this analysis, you acknowledge and accept the risks associated with cryptocurrency trading and agree to trade at your own discretion. The author of this analysis shall not be held responsible for any losses incurred as a result of using the information provided.

ETH. Weekly trading levels 27.05.2024 - 2.06.2024The level on top is the last. We were higher 3 years ago. If we go higher, we can check in the Daily Publications.
During the week you can trade from these price levels. Finding the entry point into a transaction and its support is up to you, depending on your trading style and the development of the situation. Zones show preferred price ranges WHERE to look for an entry point into a trade.
If you expect any medium-term price movements, then most likely they will start from one of the zones.
Levels are valid for a week, the date is in the title. Next week I will adjust the levels based on new data and publish a new post.
! Please note that brokers have a difference in quotes, take this into account when trading.
The history of level development can be seen in my previous posts. They cannot be edited or deleted. Everything is fair. :)
----------------------------------------------
I don’t play guess the direction (that’s why there are no directional arrows), but zones (levels) are used for trading. We wait for the zone to approach, watch the reaction, and enter the trade.
Levels are drawn based on volumes and data from the CME. They are used as areas of interest for trading. Traded as classic support/resistance levels. We see the reaction to the rebound, we trade the rebound. We see a breakout and continue to trade on a rollback to the level. The worst option is if we revolve around the zone in a flat.
Do not reverse the market at every level; if there is a trend movement, consider it as an opportunity to continue the movement. Until the price has drawn a reversal pattern.
Don't forget to like Rocket and Subscribe!!! Feedback is very important to me!

BTC. Weekly trading levels 27.05.2024 - 2.06.2024During the week you can trade from these price levels. Finding the entry point into a transaction and its support is up to you, depending on your trading style and the development of the situation. Zones show preferred price ranges WHERE to look for an entry point into a trade.
If you expect any medium-term price movements, then most likely they will start from one of the zones.
Levels are valid for a week, the date is in the title. Next week I will adjust the levels based on new data and publish a new post.
! Please note that brokers have a difference in quotes, take this into account when trading.
The history of level development can be seen in my previous posts. They cannot be edited or deleted. Everything is fair. :)
----------------------------------------------
I don’t play guess the direction (that’s why there are no directional arrows), but zones (levels) are used for trading. We wait for the zone to approach, watch the reaction, and enter the trade.
Levels are drawn based on volumes and data from the CME. They are used as areas of interest for trading. Traded as classic support/resistance levels. We see the reaction to the rebound, we trade the rebound. We see a breakout and continue to trade on a rollback to the level. The worst option is if we revolve around the zone in a flat.
Do not reverse the market at every level; if there is a trend movement, consider it as an opportunity to continue the movement. Until the price has drawn a reversal pattern.
Don't forget to like Rocket and Subscribe!!! Feedback is very important to me!

A 1200% gain to $400 in 2024 for ETC?Since May 2021 Ethereum classic has corrected 90% as shown on the above weekly chart. Unlike many legacy tokens ETC is one of the few building structure. The reasons to now consider a long position include:
1) Trend reversal, higher highs higher lows replace lower highs lower lows.
2) Support and resistance. Price action has left the long term downtrend channel resistance as indicated by the green arrows. Look left and see past horizontal resistance is now confirming support.
3) Hidden bullish divergence. This particular indication informs a strong move is about to occur. It happens when price action prints a higher low with a lower low on the stochastic RSI oscillator.
4) The price target. The downtrend channel is in actual fact a bull flag. The first impulsive move of 2021 becomes the flagpole. This flagpole is used to measure the target from the exit point of the channel to the area of $400
Is it possible price action continues to correct? Sure.
Is it probable? No.
Ww
Type: trade
Risk: <= 6%
Time frame for long: You decide
Return: 1200%

Alikze »» STRK | Move to the roof of the descending channelIn the 4H time, after a mixed correction, it has reached the $1 range, after which it has faced demand.
💎 It is currently moving in a downward channel.
According to the current momentum in the region, the current demand is suffering.
In the next step, it can continue to grow up to the supply area and the ceiling of the channel, which is a dynamic trigger.
💎 If it breaks the supply zone, it can fill the FVG gap in the 4H time frame. Therefore, if you fill the gap and pullback to the broken structure, the next target will be the next supply area.
💎 Alternative scenario: If the demand area breaks downwards, which is also in the midline of the channel, this correction can be extended and extended to the bottom of the channel and the origin of the OB movement.
»»»«««»»»«««»»»«««
Please support this idea with a LIKE and COMMENT if you find it useful and Click "Follow" on our profile if you'd like these trade ideas delivered straight to your email in the future.
Thanks for your continued support.
Sincerely.❤️
»»»«««»»»«««»»»«««

FLOKI TALLIES WIH PEPE - SAME BLUEPRINT
The striking correlation between $flokisusdt and BINANCE:PEPEUSDT will make you think they're being developed by the same developer, it is insane. Starting from the wave 2 and 4 of the of wave 1-yellow being a classic Zigzag and Triangle and wave 2-yellow for both being a classic Zigzag as well.
If you missed that big run for Floki and Pepe (called it since) there is still some juice left, at least 100% before we sell both and go away again.
PREVIIOUS ANALYSIS
OTHER ANALYSIS

ETH GARTLEY 2500 INCOMINGHere is an epic "potential" eth Gartley. Aiming for a late June/July bottom

LINKUSD: Rallying Back to $20 | 72.73% Confidence!COINBASE:LINKUSD has been drawing a lot of attention in the crypto space in the past few days. It experienced a significant drop in price (-47%), but now it's starting to show signs of a potential rebound and might be heading bullish again.
Here's the breakdown:
COINBASE:LINKUSD price took a major hit over the past 2-3 months and has been consolidating since. According to my Free Probability Indicator , There's a 72.73% chance it could climb back over $20, which is pretty much encouraging!
This price drop might actually be beneficial as it presents a great opportunity to buy LINK at a lower price.
If you're thinking about trading LINK, here's what you should consider:
Entry:
Wait for clear signs that the price is going up again, like huge up-move candle showing strong positive movements on the daily chart.
Once you're confident the trend is changing, consider buying LINK.
I'm currently looking at the 4H Equilibrium to get positioned.
Exit:
To protect yourself from drawdowns, consider setting a "trailing stop-loss." This will automatically trigger a sell order if the price starts dropping again after you buy, securing your running profits.
Risk Management:
Ensure you're not risking more money than you can afford to lose.
Only invest what you're comfortable with and consider how much you're willing to lose if things don't go as planned.
This isn't financial advice, just some insights to help you make informed decisions. Always do your own research before investing in anything.

#IOTX Ignited: Don't Miss Out on This Buy Trade!**Technical Analysis Chart Description:**
Welcome to my Technical Analysis charts on TradingView! Before we dive into the analysis, it's essential to understand some important warnings:
1. **Subjectivity Alert:** Technical analysis involves interpreting market data and chart patterns, which can be subjective. Different analysts may interpret the same data differently, leading to varied conclusions.
2. **Historical Performance Doesn't Guarantee Future Results:** Past price movements do not guarantee future price movements. While historical data can provide insights, it's crucial to consider other factors that could influence price action.
3. **Risk of False Signals:** Technical indicators and chart patterns can produce false signals, leading to potential losses if relied upon blindly. Always cross-verify signals with other indicators or fundamental analysis.
4. **Market Volatility:** Crypto markets are highly volatile and can experience rapid price fluctuations. Be prepared for sudden and unexpected price movements, which may invalidate previously identified patterns.
5. **Risk Management:** Proper risk management is essential. Never invest more than you can afford to lose, and consider using stop-loss orders to mitigate potential losses.
6. **Emotional Bias:** Avoid emotional decision-making based on short-term price movements. Stick to your trading plan and strategy, and don't let fear or greed influence your decisions.
**Disclaimer for Crypto Trading:**
Trading cryptocurrencies carries inherent risks, and it's important to understand the following:
Cryptocurrency markets are highly speculative and can be subject to extreme volatility. Prices can fluctuate significantly within short periods, leading to substantial gains or losses.
Investing in cryptocurrencies involves the risk of total loss of capital. Unlike traditional assets, cryptocurrencies are not backed by any tangible assets or central authority, making them inherently risky.
Regulatory uncertainty and market manipulation are additional risks associated with cryptocurrency trading. Regulatory changes or negative news can have a significant impact on prices.
This analysis is for informational purposes only and should not be construed as financial advice. It's crucial to conduct thorough research and consult with a qualified financial advisor before making any investment decisions in the cryptocurrency markets.
By using this analysis, you acknowledge and accept the risks associated with cryptocurrency trading and agree to trade at your own discretion. The author of this analysis shall not be held responsible for any losses incurred as a result of using the information provided.

ETH IS IT POSSIBLE?I see lot of greeds around ETH, and i think we can see something similar as the BTC ETF event. A shakeout and a drop can likely happen, and it would be a gift if the price can drop till $3.300, a level that looks solid for a possible bounce. Main trend is bullish and actually there are no reason to look for a short
