Triple Tops and QQQ / NasdaqSeems to love its triple tops! See chart. In a diamond topping pattern with a triple top. Favor downside break. Risk of continuation pattern to the upside.
ETF market

SP500 Possible Wyckoff Distribution TopWyckoff Distribution is a key concept in the Wyckoff Method of technical analysis, describing the phase where large institutional investors quietly sell their holdings (distribute them) to retail traders after a strong uptrend, signaling an upcoming market reversal from bullish to bearish (a "markdown"). It's characterized by a sideways trading range, increased selling pressure (supply overcoming demand), and specific chart events like Buying Climaxes (BC), Upthrusts (UT), Upthrust After Distribution (UTAD) and Signs of Weakness (SOW), helping traders identify top formations and potential shorting opportunities.
Key Characteristics & Phases
Follows an Uptrend (Markup): Occurs after a period of rising prices where demand was strong.
Smart Money Exit: Large players (the "Composite Operator") sell shares, often tricking retail traders into buying more as prices seem stable or slightly rising.
Phases (A-E):
Phase A: Stops the uptrend with a Buying Climax (BC) and Automatic Reaction (AR).
Phase B: Price moves sideways within a trading range, testing support/resistance.
Phase C (Upthrust/UT): A false breakout above the range's high, trapping buyers, often followed by a sharp reversal (Upthrust After Distribution - UTAD).
Phase D: Supply becomes dominant; signs of weakness (SOW) appear, with lower highs and higher lows.
Phase E: The downtrend (markdown) begins as the market breaks below the range, with high volume confirming supply's control.
Purpose for Traders
Identify Market Tops: Helps spot the end of bull markets.
Anticipate Downtrends: Signals the transition to a bearish markdown phase.
Find Shorting Entries: Provides high-probability setups for short positions, often on the pullback after a sign of weakness or breakdown.
The SP500 has gone through the same Wyckoff distribution pattern marking its last 2 tops.

SPY at All-Time Highs
Short-Term Technical Analysis (Days to Weeks)
On the daily timeframe, SPY has reached a major all-time high resistance zone around $690–$700 after a strong rally. Price is holding above the long-term ascending trendline (purple) and near the rising moving average (orange), indicating trend strength but slowing short-term momentum.
Bullish Short-Term Scenario:
A confirmed breakout and daily close above $700 could trigger an accelerated bullish move.
Bearish Short-Term Scenario:
Failure to break the all-time high and a loss of the trendline may lead to a healthy corrective phase rather than a bearish reversal.
Short-Term Target:
$740–$760
Short-Term Stop-Loss:
Daily close below $660
Long-Term Technical Analysis (Months to 1–2 Years)
From a broader perspective, SPY maintains a clean and powerful bullish structure. Previous pullbacks have consistently respected the trendline and moving averages, confirming strong buyer control.
Bullish Long-Term Scenario:
Holding above the ascending trendline could drive steady upside expansion over the next 1–2 years.
Bearish Long-Term Scenario:
Only a structural breakdown below the $620 area would meaningfully damage the long-term bullish outlook.
Long-Term Target:
$800–$830
Long-Term Stop-Loss:
Structural break below $600
Fundamental Analysis (Brief)
SPY reflects the strength of the U.S. economy:
• Strong earnings growth led by mega-cap tech
• Productivity gains driven by AI adoption
• Market expectations for more accommodative monetary policy
• Continued capital inflows into equity ETFs
Key risks remain interest rates, inflation surprises, and geopolitical shocks.
Final Takeaway
SPY is at a historic inflection point:
• Break and hold above all-time highs → bullish continuation
• Rejection → healthy correction and re-entry opportunity
For long-term investors, pullbacks remain strategic buying opportunities, not trend reversals.

Stock Market Forecast | BTC TSLA NVDA AAPL AMZN META MSFTQQQ stock market Forecast
Nvidia Stock NVDA Forecast
Apple Stock AAPL Forecast
Microsoft Stock MSFT Forecast
Google Stock GOOGL Forecast
Amazon Stock AMZN Forecast
Meta Forecast Technical Analysis
Tesla Stock TSLA Forecast
Magnificent 7 stocks forecast
Bitcoin CRYPTOCAP:BTC forecast
SP:SPX NASDAQ:NDX CME_MINI:NQ1! CME_MINI:ES1!

Wyckoff's Everywhere? Or Hallucinations?Is anyone else seeing Wyckoff distributions all over the place in stocks right now? I feel like I saw one and then started noticing them everywhere on major stocks
Bitcoin has one, started back in July and is straight out of a TA textbook. The prior cycles, Crypto peaked 1st being the most sensitive to liquidity changes.
Seems Bearish
Seems Bearish
However, TSM looks bullish!
It was forming a similar pattern but appears to be breaking out to the upside. If other stocks can follow this track things could keep going.

SPX: Looking for similarities to the Wyckoff Distribution today?Same pattern as today.
Wyckoff Distribution is a key concept in the Wyckoff Method of technical analysis, describing the phase where large institutional investors quietly sell their holdings (distribute them) to retail traders after a strong uptrend, signaling an upcoming market reversal from bullish to bearish (a "markdown"). It's characterized by a sideways trading range, increased selling pressure (supply overcoming demand), and specific chart events like Buying Climaxes (BC), Upthrusts (UT), Upthrust After Distribution (UTAD) and Signs of Weakness (SOW), helping traders identify top formations and potential shorting opportunities.
Key Characteristics & Phases
Follows an Uptrend (Markup): Occurs after a period of rising prices where demand was strong.
Smart Money Exit: Large players (the "Composite Operator") sell shares, often tricking retail traders into buying more as prices seem stable or slightly rising.
Phases (A-E):
Phase A: Stops the uptrend with a Buying Climax (BC) and Automatic Reaction (AR).
Phase B: Price moves sideways within a trading range, testing support/resistance.
Phase C (Upthrust/UT): A false breakout above the range's high, trapping buyers, often followed by a sharp reversal (Upthrust After Distribution - UTAD).
Phase D: Supply becomes dominant; signs of weakness (SOW) appear, with lower highs and higher lows.
Phase E: The downtrend (markdown) begins as the market breaks below the range, with high volume confirming supply's control.
Purpose for Traders
Identify Market Tops: Helps spot the end of bull markets.
Anticipate Downtrends: Signals the transition to a bearish markdown phase.
Find Shorting Entries: Provides high-probability setups for short positions, often on the pullback after a sign of weakness or breakdown.
The SP500 has gone through the same Wyckoff distribution pattern marking its last 2 tops.

SPY LongAscending triangle pattern in Uptrend, which is a strong bullish continuation pattern.
Trendline touch.
Long entry 681
Stop 677 (when trendline break)
Target 725 (top line of uptrend wedge)
Risk management is much more important than a good entry point.
I am not a PRO trader.
In my trading plan, the Max Risk of each short term trade should be less than 1% of an account.

QQQ Weekly Map (Dec 29 → Jan 5)The levels mark where rotation tends to pause or accelerate.
1) Bull Case — “Acceptance above EQ”
Trigger: Hold above 621 and reclaim 623 (UPR)
Targets: 626 → 629
Stretch (only if momentum persists): 634
2) Bear Case — “Rejection at EQ / Failed reclaim”
Trigger: Lose 621 (acceptance back below EQ)
Targets: 618 → 615 (LPR)
Extension: 613, and only in a true unwind 611
Invalidation
Long thesis weakens on acceptance back below 621
Short thesis weakens on acceptance above 623

Mean Reversion Setup: XLP1. RSI in oversold region
2. Price likely to rebound back to the mean
Trade Rules:
Entry Trigger - RSI has cross below oversold region, enter limit buy at close price
Exit Trigger - Close at market when close price cross above exit trigger (Red Line)
Notes: Maximum of 3 open positions

SPY Weekly Map (Dec 29 → Jan 5)The levels mark where rotation tends to pause or accelerate.
1) Bull Case — “Acceptance above EQ”
Trigger: Hold above 688 and reclaim 693 (UPR)
Targets: 696 → 702
Stretch (only if momentum persists): 710
2) Bear Case — “Rejection at EQ / Failed reclaim”
Trigger: Lose 688 (acceptance back below EQ)
Targets: 682 → 679 (LPR)
Extension: 673, and only in a true unwind 668
Invalidation
Long thesis weakens on acceptance back below 688
Short thesis weakens on acceptance above 693

TA for SPY, NVDA, AAP, MSFT for Dec 3–6Price Action vs. GEX Reality
Intraday Playbook for SPY, NVDA, AAPL, MSFT (This Week)**
This post I focus on intraday trading for the current week, using:
* 15-minute charts for structure & execution
* Intraday GEX (0DTE / weekly positioning) for direction, pinning, and exits
This is not a swing thesis.
This is how I trade day by day, letting positioning do the heavy lifting.
SPY – 15 Min Structure + GEX (Primary Driver)
Timeframe:
• 15-minute chart
• Intraday GEX (0DTE + weekly)
SPY has been in a weak intraday structure:
* Multiple CHoCHs failed
* Lower highs under supply
* Buyers unable to reclaim key resistance
Now layer GEX on top:
* Strong negative NET GEX below price
* Heavy PUT walls stacked near 681 → 679
* Call resistance overhead around 684–686
This tells me one thing clearly:
The market is not built for upside continuation unless GEX flips.
How I trade SPY here
* Entry idea: Short near resistance (684–686) if price stalls or rejects
* Continuation shorts: Break and hold below 681
* Profit zone: Scale near PUT walls (680 → 679)
* Exit / caution: If price holds above 686 and GEX starts flipping positive
No chasing.
No prediction.
Just reacting to where liquidity sits.
Move to NVDA and find out why NVDA follows SPY almost perfectly
Timeframe:
• 15-minute chart
• Intraday GEX
NVDA isn’t trading its own story — it’s trading SPY’s flow.
On structure:
* Failed BOS near 192–193
* CHoCH printed as SPY rolled over
* Price compressing instead of breaking
On GEX data below:
* Strong CALL resistance near 190–192
* PUT support clustered around 185
* Neutral-to-negative GEX = fade environment
How I trade NVDA
* Short bias: Near 190–192 if SPY stays weak
* Targets: 187.5 → 185 (PUT wall area)
* Exit shorts: If SPY regains strength and NVDA holds above 192
NVDA doesn’t lead.
It confirms.
Next, move to AAPL – Cleanest GEX Fade Setup
Based on Intraday GEX option data from the chart below
AAPL is a textbook example of GEX control.
* Call wall overhead near 272–273
* PUT support below near 269–270
* Net GEX negative = market makers sell rips
How I trade AAPL
* Short attempts: Near 272–273 rejection
* Targets: 270 → 269
* No longs: Unless price reclaims 273 and GEX flips positive
Sideways price ≠ random price.
It’s pinned.
For MSFT – Why the Bounce Was Not a Trend
Let look at the Intraday GEX option data we can see MSFT flushed hard, then bounced — which confused many traders. Let using GEX option data on below to see how MSFT plays out.
GEX explained it early:
* Heavy PUT positioning below 472
* Strong resistance near 480–485
* Negative GEX = mean reversion, not breakout
How I trade MSFT
* Scalp longs: Near 472 support only
* Fade rallies: Into 480–485
* Trend longs: Only if SPY flips + MSFT holds above 485
Bounce ≠ bullish trend.
Big Picture for This Week
* This is an intraday, positioning-driven market
* SPY decides direction
* NVDA, AAPL, MSFT follow SPY’s GEX gravity
* Best trades come from patience at levels, not prediction
Nothing here was random.
It was structured, positioned, and repeatable.
So Here is A Bonus How I Use GEX for Entries & Exits (Simple Rules)
I don’t use GEX to “predict price.”
I use it to manage risk and expectations.
My intraday rules:
* Negative GEX → take profits faster, fade moves
* Positive GEX → hold winners longer
* Between walls → expect chop
* Break + hold past wall with GEX flip → real breakout
If GEX doesn’t confirm, I don’t force the trade.
This analysis is for educational purposes only and reflects my personal trading approach. Always manage risk and trade responsibly.


MAGS in BUY ZONEMy trading plan is very simple.
I buy or sell when at either of these events happen:
* Price tags the top or bottom of parallel channel zones
* Money flow volume spikes beyond it's Bollinger Bands
So...
Here's why I'm picking this symbol to do the thing.
Price in buying zone at bottom of channels
Money flow momentum is spiked negative and under bottom of Bollinger Band
Entry at $65.30
Target is upper channel around $68
Also buying at lower channel at $64.

Too Late to Buy Silver?Hello I am the Cafe Trader.
Today we’re looking at Silver (SLV). After a strong, almost vertical run many are wondering if this has more in the tank? or are we too late?
Unfortunately when breaking new territory on pricing, it can be hard to pick tops or bottoms, but here are some ways you can play SLV if you are late to the game
Top of Demand . This is where the current Strong demand is sitting. We should see a reaction at this level. People at this area have aggresive sentiment, and will be looking to add here. If we start to break this level, then we could see the market try and find liquidity again.
Green Scenario
If buyers continue to defend the Top of Demand around the mid-60s, Silver can stay elevated and work higher through consolidation. This would likely look choppy at first, but as long as demand holds, the path remains open for a continuation even into the 100s (Many people might look to take profiit at $100 since it is a psycological number, so keep that in mind.)
Entry around $64 - 64.50
Exit (your choice) but I gave you a 3/1RR option.
Stop loss can be tighter then what I have drawn here, but with the volatility this high, keep it super tight, or loose, nothing in between. I am showing a loose Stop loss.
Red Scenario
If we lose the Top of Demand, I would expect a deeper rotation into the Strong Demand zone below. That area represents conservative area for buyers after such an aggressive run. A dip into that zone would not be bearish in the bigger picture — it may even pose a hotter reaction. We want price to hold above that Key level . The closer you can get an entry to that price the better.
Long Term
Aggressive: Top of Demand (~64)
Value: Strong Demand (~48–50)
Extreme Value: Key Level / Bottom of Demand (~44)
Overall, Silver looks strong. The question isn’t whether the trend is bullish — it’s whether buyers choose to hold price up here, or let it rotate lower to build a stronger base. Either outcome can still support higher prices over time.
Happy Trading,
@thecafetrader

The market may sell for a few daysLooks like right now the market will lose it's 18ma today and therefore the bias will be down. Again, the range trade idea (between 6900 and 6500) is still on the table as a possibility but there is significant support at 6700. The trade is invalid if we get over this morning's high.

QQQ mid-term TANasdaq is having negative divergence in volumes, there'e a trampoline move in the process with a potential squeeze downside, be careful and watch for the correction in upcoming days.

IWM Weekly Map (Dec 29 → Jan 5)The levels mark where rotation tends to pause or accelerate.
1) Bull Case — “Acceptance above EQ”
Trigger: Hold above 253 and reclaim 256 (UPR)
Targets: 258
Stretch (only if momentum persists): 261
2) Bear Case — “Rejection at EQ / Failed reclaim”
Trigger: Lose 253 (acceptance back below EQ)
Targets: 250 (LPR) → 249
Extension: 247, and only in a true unwind 243
Invalidation
Long thesis weakens on acceptance back below 253
Short thesis weakens on acceptance above 256

Venezuela oil confiscatedWith the news of the U.S. capturing Maduro and taking control of Venezuelan oil and the narrative that infrastructure will be replaced, I wonder if this will be bullish for the oil services. It's possible this was already priced in, seeing as the rising trend since mid-2025 has been steady.

Oil / Gas long term trend seems bullish (IHS)Looks like a bottom is forming where the white top target is the 2x measured move of the IHS

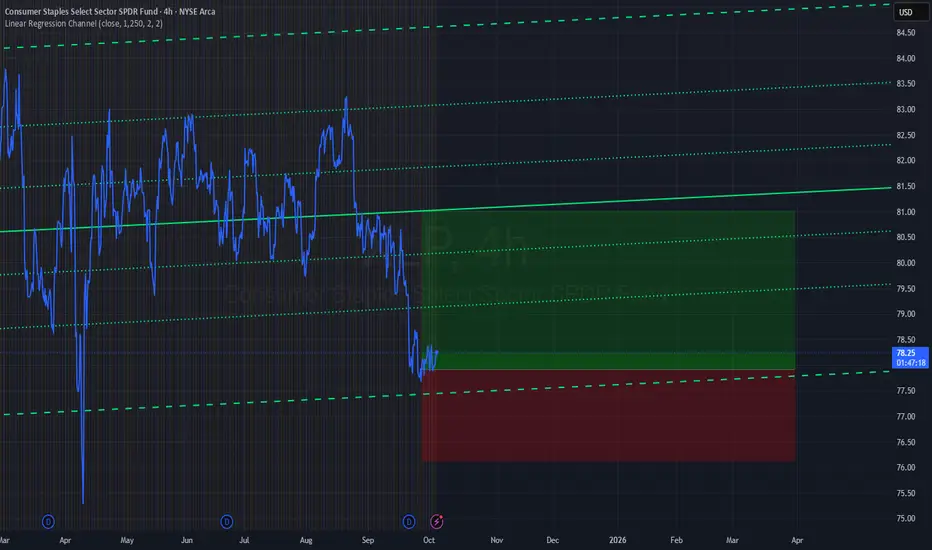
XLP Long trading opportunity(swing-trading) 1I expect a swing of about $3-$4 all the way up to $81+- around 1-3 months max.
I am risking money.
My entry price is $77.80
This is a buy and hold trade in a lower risk lower volatility instrument, I do think it can go lower than $70 any time soon but that would then be 20%+- down from its peak.
SPX: Looking for similarities to the Wyckoff Distribution today?Same pattern as today.
Wyckoff Distribution is a key concept in the Wyckoff Method of technical analysis, describing the phase where large institutional investors quietly sell their holdings (distribute them) to retail traders after a strong uptrend, signaling an upcoming market reversal from bullish to bearish (a "markdown"). It's characterized by a sideways trading range, increased selling pressure (supply overcoming demand), and specific chart events like Buying Climaxes (BC), Upthrusts (UT), Upthrust After Distribution (UTAD) and Signs of Weakness (SOW), helping traders identify top formations and potential shorting opportunities.
Key Characteristics & Phases
Follows an Uptrend (Markup): Occurs after a period of rising prices where demand was strong.
Smart Money Exit: Large players (the "Composite Operator") sell shares, often tricking retail traders into buying more as prices seem stable or slightly rising.
Phases (A-E):
Phase A: Stops the uptrend with a Buying Climax (BC) and Automatic Reaction (AR).
Phase B: Price moves sideways within a trading range, testing support/resistance.
Phase C (Upthrust/UT): A false breakout above the range's high, trapping buyers, often followed by a sharp reversal (Upthrust After Distribution - UTAD).
Phase D: Supply becomes dominant; signs of weakness (SOW) appear, with lower highs and higher lows.
Phase E: The downtrend (markdown) begins as the market breaks below the range, with high volume confirming supply's control.
Purpose for Traders
Identify Market Tops: Helps spot the end of bull markets.
Anticipate Downtrends: Signals the transition to a bearish markdown phase.
Find Shorting Entries: Provides high-probability setups for short positions, often on the pullback after a sign of weakness or breakdown.
The SP500 has gone through the same Wyckoff distribution pattern marking its last 2 tops.

The Good, The Bad, and the Ugly. Silver.Silver, oh Silver.
My sweet, shiny stone. Since $24 or so, I've tried to preach the good word.
Where are we at now?
Ill start with my fundamental idealism and a short bear/bull case.
Year of the horse, lets keep it short-ish..
Bull
Silver has never seen her own bullrun.. until now(?).
We have new imposed restrictions via China on export.
We can sleep at night knowing silver is never going away.
We can sleep at night knowing they want to keep continue building data centers.
Silver is everything we wholeheartdly use, electronically.
Bear
We are going to see some sort of bearish diver, weve been hot too long
$70 support? we are currently ping-ponging in price, not an ideal entry point.
I've made a channel for our temporary upper and lower bounds.
Id suggest to watch for now, its a great time to take TP if youve been here.
Peace on Earth, happy new year.

GLD to 320Seems obvious man. It's way up there. Let it come down a bit.
320 is also ~4500 on XAUUSD.
