SPY gap fill. BEWARE!Seems to be a bit of a gap that needs filled. Maybe not today, maybe not tomorrow, but sooner or later, will have to be dealt with.
ETF market

TLT for 15.04 big bear attack is comingFor TLT, I just wanted to share my own ideas, which are not investment advice, about the interaction of recent geopolitical events and expectations, as a note to history.
In the pre-trading hours, I expect 88.3 with the opening and maybe 86.9 with reaction sales. Since I foresee a movement around 1.045 in terms of Euro / Dollar parity, I suspect that there will be a serious withdrawal with possible reaction sales. In the meantime, I will make a loss as I am in a long position.

SILVER will follow GOLD?SLV: SILVER will follow GOLD?
-Breakout of long time accumulation.
-Vol for demand confirmed.
-Inversed HnS pattern.
-Demand zone waiting for a pull back.
.
Wait n see!

SPY Sellers In Panic! BUY!
My dear followers,
I analysed this chart on SPY and concluded the following:
The market is trading on 510.83 pivot level.
Bias - Bullish
Technical Indicators: Both Super Trend & Pivot HL indicate a highly probable Bullish continuation.
Target - 515.64
About Used Indicators:
A super-trend indicator is plotted on either above or below the closing price to signal a buy or sell. The indicator changes color, based on whether or not you should be buying. If the super-trend indicator moves below the closing price, the indicator turns green, and it signals an entry point or points to buy.
———————————
WISH YOU ALL LUCK

QQQ: Will Keep Growing! Here is Why:
Looking at the chart of QQQ right now we are seeing some interesting price action on the lower timeframes. Thus a local move up seems to be quite likely.
❤️ Please, support our work with like & comment! ❤️

TQQQ - Cup awaiting Handle ?TQQQ on a weekly chart in 2021 ascended into a falling wedge. As part of the falling wedge,
it started the downside initial part of a cup and handle pattern. The reversal occurred 11
months ago with the upside completion of the cup back to 57.5 In the typical cup and handle,
the handle then forms in a 50% retracement of the height of the cup. the cup height measures
44.5 over a period of about 9 months. Notably relative volumes peaked at the bottom of the
pattern. Once the retracement is complete, bullish continuation should occur to the extent of
the height of the cup above the lip. That is to say an uptrend from 57.5 adding 44.5 to get to
102 more or less. But first the retracement and reversal must occur.
Accordingly, if this is an incomplete cup and handle, it forecasts a retracement of 44.5 divided
by 2 or to about 38 as shown by the Fib retracement tool. After that price must reverse
then overcome the resistance of the lip of the cup ( 57.5) and continue to 102.
Overall, this forecasts that a bearish crash is in store for TQQQ ( as well as QQQ from which
it is leveraged). Time will tell if this pattern has given an accurate forecast. In the meanwhile,
I will watch for signs of QQQ topping out on the weekly time frame after the same signs on
lower time frames. The alternative view is that TQQQ is building an even bigger cup
right now with the lip at about 88 when the price had a high pivot down on November 22, 2021.
So, do you see a bigger or smaller cup pattern or none at all?

Little more room to the upside before a more meaningful pullbackAs the S&P rises, bullish signals become less clear. That said, a short-term top is likely near and fits the forecasting narrative.

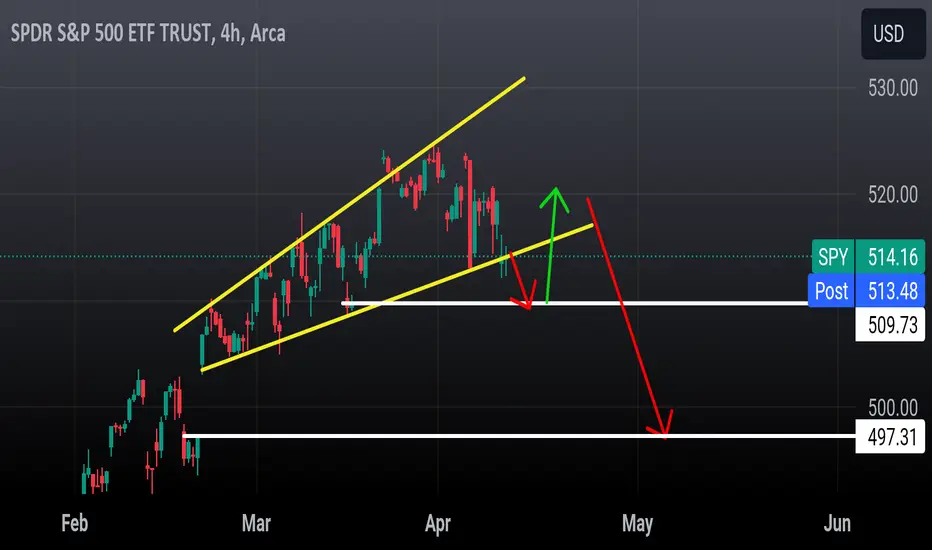
SPY could start a clear bearish trend.The market strongly breaks our subjective support of r200ma on April 4, and then tests the $520.00 zone, forming a clear resistance in that zone which gives us an HL's, on April 12 the price breaks a $512.00 support zone, zone that the price could test and then form a downward trend, if our prediction is confirmed, the price could be looking for the $495.00 zone.
Desclaimer:
The information and publications are not meant to be, and do not constitute , financial, investment, trading, or other types of advice or recommendations.

"SILVER" COULD BE THE NEXT GOLD!!!Hello everyone, I hope you are all doing well. Previously, I had shared my analysis on the price rise of gold. In case you missed it, I would like to share some new opportunities with you. The chart indicates a very bullish trend with 1 leg, 2 legs, and a positive RSI and MACD in monthly and yearly time frames. Silver is about to explode in price, with the first target being $40, which is a 60% increase. The next targets are $60 and $70. I will keep you updated on this in the future. Thank you for your attention. (This is a midterm analysis 6 months to 1.5 years)
TVC:SILVER MCX:SILVER1! CAPITALCOM:SILVER FX:XAGUSD OANDA:XAGUSD FOREXCOM:XAGUSD
Caution: Before executing a trade, consider the risk/reward ratio and
implement proper risk management techniques based on your total
investment amount.
Disclaimer: This information or service is for informational purposes
only and is not intended to be personal financial advice

Is QQQ forming a Top? Trend Channel Chart shows the potentialTops take time however QQQ is obviously very stretched here and the recent consolidation is providing Bears an opportunity to open short positions with relatively low risk. The big challenge is that tops take time - they have a way of chipping away and frustrating bears. Watch for a break of the Trend line and Back test failure for a Bear trigger

SPY: Long Trade Explained
SPY
- Classic bullish setup
- Our team expects bullish continuation
SUGGESTED TRADE:
Swing Trade
Long SPY
Entry Point - 510.83
Stop Loss - 507.58
Take Profit - 517.50
Our Risk - 1%
Start protection of your profits from lower levels
❤️ Please, support our work with like & comment! ❤️

QQQ Expected Growth! BUY!
My dear friends,
QQQ looks like it will make a good move, and here are the details:
The market is trading on 438.29 pivot level.
Bias - Bullish
Technical Indicators: Supper Trend generates a clear long signal while Pivot Point HL is currently determining the overall Bullish trend of the market.
Goal - 441.64
About Used Indicators:
Pivot points are a great way to identify areas of support and resistance, but they work best when combined with other kinds of technical analysis
———————————
WISH YOU ALL LUCK

$SPY Looking to Slide Lower BB slide coming right up! Next week should close some gaps. See you at the bottom!

Top forming in QQQ?QQQ seems to be creating a top here on the Trend Channel Chart. The symmetry with the previous Top in 2021 is striking. The consolidation at this extreme extension makes price look vulnerable however Tops take time and that can frustrate bear positions. Bear Stops are often placed just above the Top Trend Cap but the Top formation has a way of triggering those early tight stops. Watch for a break of the first Trend Channel rail followed by a Back test of the Trend rail for the Bear set up.

SPY Flag Analysis{Flag pattern}Hi every one
no need to say something , chart is speaking it self .
Traders, if you like this idea or have your opinion about it, write in the comments. We will be happy
Things can change...
The markets are always changing and even with all these signals, the market changes tend to be strong and fast
Thank you for seeing idea . please support us
Good luck.

IWM/SPY, high probability resistance, 26.decIn 26th dec, there was a high probability weakness in IWM based on this graph.
Top of BB's and impulse has no potential, yet important resistance/break out.
//rising TNX is bad for cyclicals or small caps.

BOIL trends up continuation expected LONGBOIL is here on a 30 minute chart. It has reversed this week and ascended 13% with a double
bottom at 13 and 13.25 forming a resing support trendline. Volumes changed from selling
to buying. Price bounced off the ATR- stop loss in its pullback and now appears poised to
break through the moving average channel and get support after that cross-over.
I will take a long trade here with a stop loss of the pivot low of 14 while targeting the
upper boundary of the Keltner channel at 15.25 for two-thirds the position with the remainder
to run to try to reach 37 , the pivot high of January. As a leveraged instrument, BOIL is very
volatile and needs extra care in the trade.

1995 Thesis Being TestedIn my previous idea and in many of my comments here on TV I have noted how similar today's market is to the 1995 market specifically. Today's three-day candle close matches one similar event in 1995 right at the end of the year, as compared in the idea. This was the only time 3 consecutive three-day candles printed in 1995 & the next close will be critical to determine if this comparison is still valid.
Please see the ideas I've linked for two other direct comparisons between this market and 1995 (& late 1994 in one of the ideas). The comments in Steversteves idea include a mathematical comparison between 1995 & 2024 using ATR and average daily change that will likely be invalidated if we see more downside right away.

$SPY April 13, 2024AMEX:SPY April 13, 2024
15 Minutes.
AMEX:SPY took 50 average support in the daily.
Now 505-510 levels become important to hold.
The uptrend is from 493 levels in 15 minutes.
Made a high of524 levels.
so 61.8% retracement for that move is around 505 levels.
If that level is not held next week I find it difficult to go long.
Any rise up to 516 levels I will sell as I have a target 505 levels SL 518.
The long is only above 524 levels as of now.
Downtrend now bias at the moment.

The Candle That Started The Bull MarketToday the SPDR S&P 500 ETF made a rare marubozu candle - that is a candle with no bottom and no top. It is not said to have any predictive power, but to only exist when buyers (or sellers) have high confidence. The current bull market has historical parallels that suggest it may be here to stay. In 1995, a similar candle was printed the day before the legendary 1990's bull ran began.
Could it really be that simple? Maybe not. But the historical price action from 30 years ago has a LOT more parallels than that. Take these examples from the ETF's first all-time-high in 1994 & the recent all-time-high that has just been surpassed...
The marubozu candles both printed following a descending wedge/megaphone formation, then a sharp uptrend with an unfilled gap beneath the final price action.
But are there any bearish historical parallels? Yes, actually. Sort of.
Price-action in SPY futures is also similar to the Nikkei's 1998 futures trading. Note the same kind of lows in October 1998/2022 and March 1999/2023, with similar volume. A technical pullback happened at approximately the same time as now. However, a just as in 1994, a run to new all-time-highs followed on the futures chart - but not a new bull market in Japan. In this scenario, SPY has a target of approximately 535 before reversal.
SPY price action seems more bullish now than either of the scenarios I have highlighted, though!
Every day at this point we don't see a sizable rejection suggests this is the start of some new wave in the ETF's history.
Trade safe!

Short term SPY target 503Short term target for SPY is 503 over the next few weeks. This is the area of the most support with the gap up. Upward channel from the last 3 months was broken several days ago, and now we are in a different technical situation.

SpyLooking for a gap close at 509 by End of week followed by a bounce back to 518-520 before the next leg down to 497..
Ascending broadening wedge here.
Vix 4 hour chart.. is flagging for a move up to 18 .
Dow jones
Bear channel formed here. Next target is 37,800.. I expect a dead cat there before fi al target of 37,000
Nasdaq or IXIC
Looking for 15,930 this week then A bounce back to 16,250 before a correction down to 15,500 gap close.. what this looks like on QQQ is a drop to 433 then a pop to 441 before a leg down to 420
Camina o revienta.Slow move up, very slow, more slow than I would like and desire. But UP, at the end. Some might call it "acumulation" or any fashion word to describe what market does for unkownn reasons, when it moves slowly.
So here are the rhythms of this FOUR year corrective move. And now? walk or Burst (again), fly or Die (once more).
I chose the first.Is my choice. In fact I see the sector reaching all time hights again during 2025.
It would not be a path full of roses. When has it been before?
In a nutshell for this coming year:
- Dollar mainly down.
- Gold mainy UP
- Miner mainly UP-
And in addition to all this:
- General Markets (S&P500) also UP to all tme hights.
- China (Shanghai Index) up, in a explosive manner.
