SMH PutNASDAQ:SMH - Buy Jun-21-24 $235 Put @ $7.35 Limit to Open
Similar to XLC, downward bias. Expectation that markets will see a correction for a few weeks.
ETF market

XLC PutAMEX:XLC - Buy Jun-07-24 $82.5 Strike Puts @ $0.7 Limit to Open
Prime for a short. Oscillator overbought and diverging downward. Put prices are attractive and not overpriced like major indices. Topping a major resistance ceiling, and price formation, makes it a very attractive short.

GLD - Buy the PullbackWhile today's down move may look dramatic to some, two things going on. One is a typical .382 Fib retracement. The other, a test of the breakout level. Looks like an easy run to the top of the trend channel above 230.

The Long Case for SemiconductorsThe long thesis for SOXL, Semiconductor 3x Long.
With Crypto, AI, Automation etc we will soon come to view Semiconductors as a fuel for computational power. Just like we need gas for cars and electricity for all the rest the next phase of the economy is running off of Computational Power at a mass global scale.
The internet was the mass explosion of collective knowledge onto the world. This next phase will be the democratization of computational power to go with that knowledge.
As things are the semiconductor industry is well insulated through its extreme specialization.
Governments will move to increase their own semiconductor production but this is 5-10years out and will most likely end up contracting/subsidizing Established semiconductor manufacturers.
This all points Up for Semiconductors.

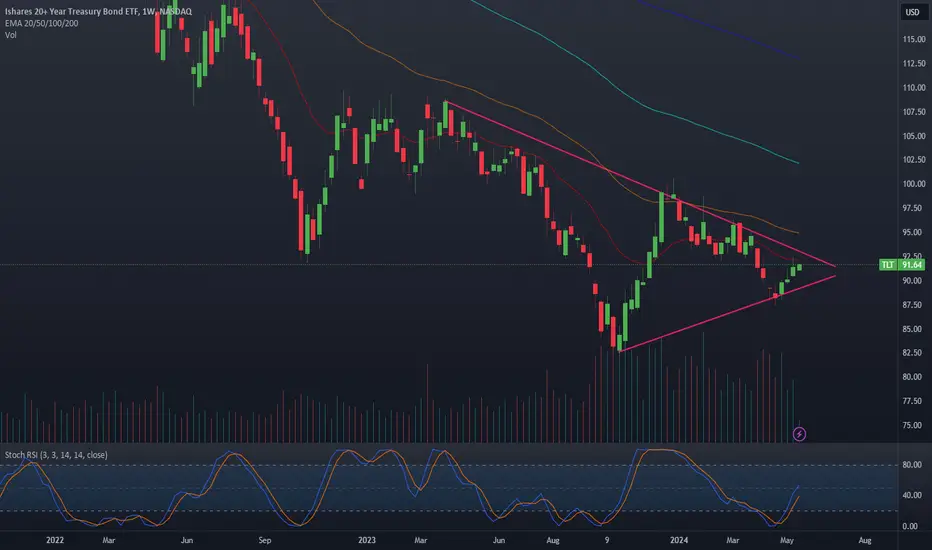
TLT wedgeTLT presents a wedge on a rising trend, this is bullish for risk on markets. As inflation remains sticky any report of easing inflation will cause TLT to break through this to the upside. Remember that if 20 year bonds rise, this helps alleviate the yield curve and drop shorter-dated bonds, this reduces overall interest rates. In a healthy market, longer-dated bonds should always provide more yield than monthlies, this is not the case for the last year plus because of the yield curve inversion.
-Late June or July this wedge breaks to the upside
-Rate cuts will follow
-Either the market pumps into elections hard, or we start to go into a recession
-I believe Biden will not allow a recession until 2025 due to elections
Spy Ascending TriangleI caught 529 puts. From earlier this morning, And after exit We tagged the trend line for the support of the ascending triangle

Signal & Noise: Macro Tests: Italy, Japan, IndiaThis piece was meant to focus on the number of major equity indices that are near all time highs, or attempting to break out of long term ranges, and how their behaviors around those prior highs over coming months will likely offer significant insight into what comes next. It evolved to something else.
I am convinced that most market fluctuations are random, mostly untradable noise. And yet, most who work with markets for a living, are required to place meaningless behavior into a continuous narrative for clients and employers. Importantly, once a narrative is publicly expressed, the analyst/trader becomes entrapped in that narrative and all of the resultant behavioral biases that being identified with a view entail. Working in the institutional setting, my personal solution was to focus on longer time frames.
Part of the technicians evolution is finding the style that best suits their emotional and risk management tolerance. For me, it was a long and sometimes painful journey. One of my toughest challenges was finding a systematic approach to separating signal from noise. In other words, when is market behavior important and when is it not. And if it is, how do I subsequently fashion a trade to take advantage of the informational advantage.
Anyone who has traded for a living knows that market behaviors and patterns are often unreliable. This is particularly true if they are occurring in a trending market and well away from substantive support or resistance (the most obvious exception being early stage trends and climax/ending structures). Don't get me wrong, trading focused systematic entries to established trends can work very well. But, I prefer to enter initial positions into trends that are in their early stages, where I have tighter control over risk management and where my macro opinion, hopefully divergent with the dominant market narrative, is more likely to be a change catalyst.
When patterns occur at the proper position on the chart, they become far more valuable and actionable. To be fair, I don't completely ignore day to day fluctuations. Years of staring at tens of thousands of charts has given me a decent feel for the short term fluctuations. But I place far less emphasis on building trading plans or adjusting my positions around them, and I try to avoid labeling them as meaningful for anything more than a short term trade. In these cases my chart analysis typically consists of a cursory glance at the price-volume relationships and general view of the chart. On the other hand, solid confluences of support and resistance that have been well defined in the weekly and monthly perspectives are my personal wheelhouse. When I find these markets, I focus on them intently.
In my process, I actively scan for markets that are testing well defined price junctures in their weekly and monthly perspectives. At these junctures the price/volume behavior combinations in the daily, weekly and even hourly perspectives become meaningful and often produce actionable insight.
As a professional fixed-income trader I have always been envious of non-constrained traders who had thousands of global stocks, equity indices, currencies, commodities across multiple time perspectives to choose from. There is always a fat pitch setting up somewhere as long as you are dogged enough to go find them.
On to the charts: Multiple global equity markets are testing important prior highs, many in monthly perspectives others in weekly perspectives. These are precisely the situations in which signal quality is high and the price/volume relationships become more important and where often times new trends with quality risk reward tolerances set up from.
These are all charts that have recently moved onto my watch list.
MSCI Italy:
The MSCI Italy represents a point in case. Italy recently moved modestly above the top of a two decade long trading range. From this position, even small daily perspective fluctuations generate meaningful information. Importantly, with the long trading range acting as potential cause, potential targets of a breakout are much-much-much higher and even a failure back toward the trading range lows would produce roughly a 40-45% return. It's pretty simple, either the market is A) Breaking out. B) Has washed out the top of the range, sucked in weak hands, and will soon fail back into the range leaving weak hands trapped.
My initial thought upon examining the chart was that it was indeed breaking out of its decade long trading range.
• The September 2022 low (B) was higher than the prior low (A).
• During the last decline toward the range lows (34.53 - 20.99) there were significant signs of accumulation.
• The market is clearly above the most immediate horizontal resistance( 34.45- 34.53) and just above the 36.88 resistance.
• Corrections since breaking out have mostly taken the form of bull flags or pennants.
However:
• Momentum is significantly over-extended in all time frames.
• The weekly slow stochastic is diverging and threatening to rollover.
• The monthly slow stochastic is attempting to rollover.
• Near the Top of the daily, weekly and monthly Bollinger Bands.
• Multiple price channel tops conflude in the 38.00 area of the chart.
• Volume has declined markedly as the market rallied over the last 19 months. This suggests a lack of selling pressure as opposed to strong demand.
• Since 2011 the peaks have been running in the mid 40 month range. Currently at 35 months.
• While above most recent resistance, the 2009 high @ 43.54 should offer strong resistance.
If the market is ready to pullback, the price-volume relationships, pattern, behavior relative to support and resistance zone and other traditional technical relationships should allow early entry into the next meaningful directional move.
For now, I suspect that the market may indeed be breaking out in the long term, but the long laundry list of concerns suggests that a pullback is likely to develop before the next strong trending phase begins. The behaviors on the pullback, and where the pullback holds (most likely the broken C-D resistance) will be key.
NIKKEI 225 Monthly:
Nikkei is another major market testing its all-time high. At all time highs and a channel top. Clearly a watch list chart.
MSCI India ETF:
India is interesting. There has been a very positive change in the reporting on India's economic outlook and the market recently moved to a new all time high. But note the swell in volume and the poor upside result generated by that volume. I suspect strong hands are selling the rally.
And finally, many of the topics and techniques discussed in this post are part of the CMT Associations Chartered Market Technician’s curriculum.
Good Trading:
Stewart Taylor, CMT
Chartered Market Technician
Shared content and posted charts are intended to be used for informational and educational purposes only. The CMT Association does not offer, and this information shall not be understood or construed as, financial advice or investment recommendations. The information provided is not a substitute for advice from an investment professional. The CMT Association does not accept liability for any financial loss or damage our audience may incur.

TEC LongSimple trend following for an ETF that keeps moving. Nice alternative whilst we wait for major markets to pick a direction.

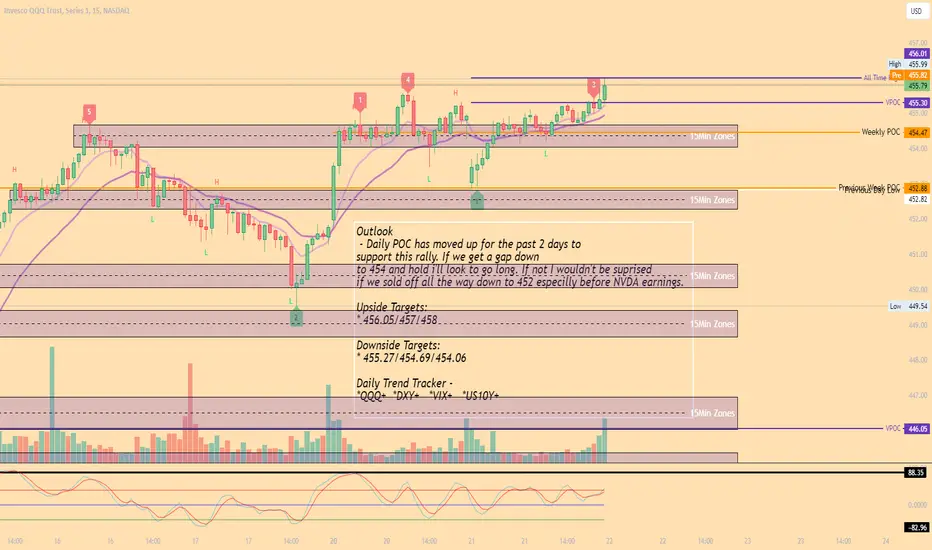
QQQ Scalping Zones 5/22Outlook
- Daily POC has moved up for the past 2 days to
support this rally. If we get a gap down
to 454 and hold i'll look to go long. If not I wouldn't be suprised
if we sold off all the way down to 452 especilly before NVDA earnings.
Upside Targets:
* 456.05/457/458
Downside Targets:
* 455.27/454.69/454.06
Daily Trend Tracker -
*QQQ+ *DXY+ *VIX+ *US10Y+
the case for further pain in bondsmaking the case if the parabola fits, seems to fit better than what has been drawn before, what if personal bias can make things seem rosier than they really are

Spy Ascending TraiangleTo day we may push pass 531.11 - 531.57
There is a trend line that started on the 17th that now has two touches of support to the upside.


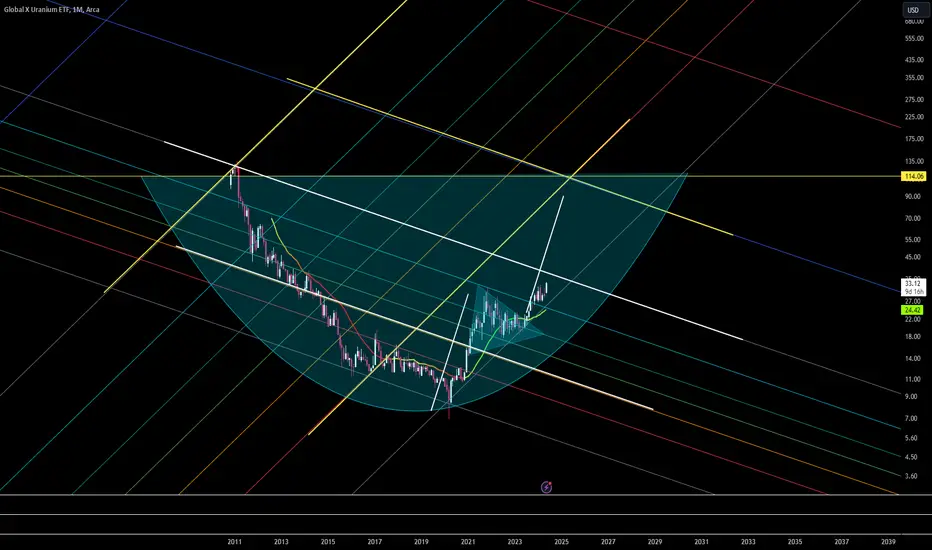
bullish on Uranium bullish on uranium and expect this ETF to breakout soon
Support: $17
Resistance I: $43
Resistance II: $100
According to Munro, who is co-chair of the World Nuclear Association’s Nuclear Fuel Demand Working Group, “we are on the cusp of a new nuclear age in which decarbonisation imperatives collide head-on with unrealistic expectations of renewables penetration, leaving nuclear power to wean the world off coal and decarbonise the expanding electrical grid, domestic heating, industrial heating and hard to abate areas of industry including hydrogen production. If nuclear power can achieve its decarbonisation potential around the world, the implications for uranium demand will be astonishing.”

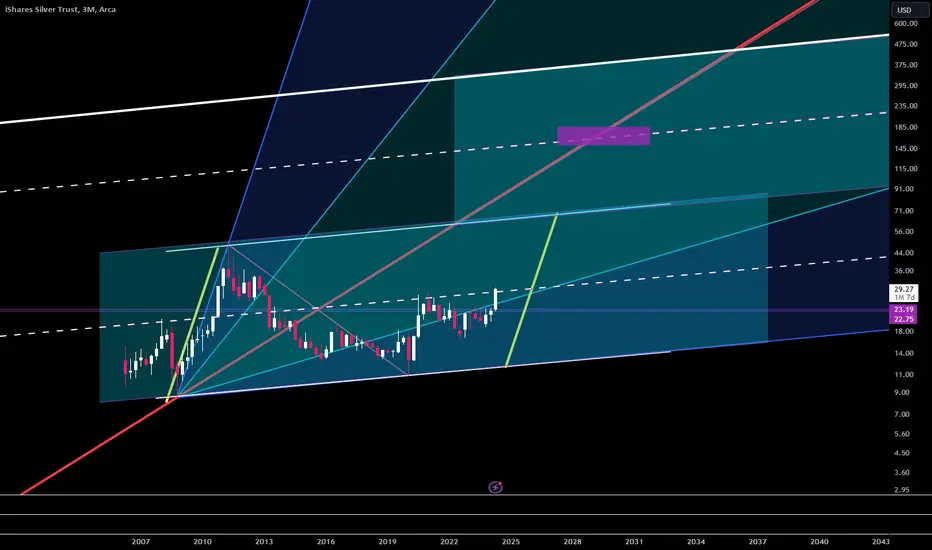
silver slv update on AMEX:SLV #slv #silver we are looking at a key 3-month resistance being tested, to continue to the upside. slv
Spy is hotLooks like AMEX:SPY can hover here and trade higher from these levels. RSI is hot and momentum is carrying this uptrend. Low volume = sellers not in sight. NASDAQ:NVDA earnings might push it to close above $531.50 by Wednesday. A down day with high volume will be the beginning of a pullback.

$SPY May 22, 2024AMEX:SPY May 22, 2024
15 Minutes.
Oscillator divergence getting sorted out.
At the moment sell below 529.7 and buy above 531.75.
If NASDAQ:SPT crosses 531.75 with bar having close near top, we can buy for 534 range.
And if it closes below 529 with bar close near low of bar i will short for 527.5 levels which also is possible 200 average during the day.
For the day consider the rise 529.07 to 531.51.
AMEX:SPY need to hold 530for a target 533.5 to 534 if 531.75 is crossed.
At the moment AMEX:SPY is struggling around 531.5 three times.
One negative issue I have is, the stochastics had a black bar on top and it retraced say below 25 without creating a black bar at bottom. But once it has crossed 75 there is no black bar on top. So, momentum seems to have lost. Have marked in chart.
So, I will wait for first 15 minutes after open and take a call.

Elliott Wave Analysis on S&P 500 ETF (SPY) Calling for More UpsiShort Term Elliott Wave in S&P 500 ETF (SPY) suggests the rally from 4.20.2024 low is in progress as an impulse. Up from 4.20.2024 low, wave ((i)) ended at 510.75 and dips in wave ((ii)) ended at 499.49. The ETF has extended higher in wave ((iii)) with internal subdivision as another impulse in lesser degree. Up from wave ((ii)), wave i ended at 508.19 and dips in wave ii ended at 499.55. Wave iii ended at 518.57, wave iv ended at 514.98, and wave v ended at 522.63 which completed wave (i).
Wave (ii) pullback has ended at 518.18 which subdivides into a double three Elliott Wave structure. The ETF then extended higher inw ave (iii) towards 531.52 and pullback in wave (iv) ended at 527.32. Final leg wave (v) is in progress and can see a few more highs before ending wave (v) of ((iii)). Afterwards, it should pullback in wave ((iv)) to correct cycle from 5.1.2024 low before it resumes higher. Near term, as far as pivot at 499.73 low stays intact, expect dips to find support in 3, 7, 11 swing for further upside.

$SLV ETF Inverse Head & Shoulders Pattern & Fibonacci ResistanceAMEX:SLV ETF Inverse Head & Shoulders Pattern & 50% Fibonacci Resistance. Silver will need to consolidate before it can break higher to the blue line.
The Inverse Head & Shoulders (IHS) pattern is a bullish reversal pattern in technical analysis, typically appearing at the end of a downtrend. It is characterized by three distinct lows:
1. **Left Shoulder:** The initial low formed during the downtrend.
2. **Head:** A lower low, signifying a continuation of the downtrend but also a potential reversal point.
3. **Right Shoulder:** Another low, typically higher than the head, indicating weakening downward pressure.
The neckline of the IHS pattern is a resistance level drawn by connecting the highs between the left shoulder and head, and the head and right shoulder. When the price breaks above this neckline, it confirms the pattern and signals a potential reversal to an uptrend.
Traders often use the IHS pattern in conjunction with Fibonacci retracement levels to determine potential price targets. After the neckline breakout, the price is likely to retrace a portion of the initial move up before continuing higher. Common Fibonacci retracement levels used are 38.2%, 50%, and 61.8%.
**Here's how the Inverse Head & Shoulders pattern and Fibonacci resistance work together:**
1. **Identify the IHS Pattern:** Locate the left shoulder, head, right shoulder, and neckline on a price chart.
2. **Confirm the Breakout:** Wait for the price to break decisively above the neckline on increasing volume.
3. **Apply Fibonacci Retracement:** Draw Fibonacci retracement levels from the low of the head to the high of the right shoulder.
4. **Set Price Targets:** Look for potential resistance and profit-taking opportunities at the 38.2%, 50%, and 61.8% retracement levels.
**Key Points:**
* The IHS pattern is a powerful bullish reversal signal.
* Fibonacci retracement levels can help identify potential price targets after the breakout.
* Traders should always combine the IHS pattern with other technical indicators and risk management strategies to improve their trading decisions.
**Disclaimer:** Technical analysis is not a foolproof method for predicting price movements. It's essential to conduct thorough research and consider various factors before making any investment decisions.

$SMH Parallel Channel Uptrend Continues NASDAQ:SMH Parallel Uptrend Continues
The SMH ETF (VanEck Semiconductor ETF) is an exchange-traded fund designed to track the performance of the MVIS® US Listed Semiconductor 25 Index (MVSMHTR). This index is composed of the 25 largest U.S.-listed companies involved in semiconductor production and equipment.
**Key points about SMH ETF:**
* **Objective:** To replicate the price and yield performance of the MVIS® US Listed Semiconductor 25 Index as closely as possible, before fees and expenses.
* **Investment Focus:** Companies engaged in the design, manufacturing, and distribution of semiconductors.
* **Holdings:** Includes well-known semiconductor companies like Nvidia, Taiwan Semiconductor Manufacturing, Qualcomm, etc.
* **Market Exposure:** Provides investors with targeted exposure to the U.S. semiconductor industry.
* **Trading:** Trades on major stock exchanges like other ETFs.
**Why invest in SMH ETF?**
* **Diversification:** Offers a diversified portfolio of leading semiconductor companies.
* **Growth Potential:** The semiconductor industry is vital for technological advancement and has significant growth potential.
* **Convenience:** An easy way to gain exposure to the semiconductor sector without buying individual stocks.
* **Liquidity:** Typically high trading volumes ensure easy buying and selling of shares.
For further information, you can refer to the following resources:
* **VanEck SMH ETF Page:** (www.vaneck.com)
* **ETF Database:** (etfdb.com)
* **ETF.com:** (www.etf.com)
Remember, investing in ETFs involves risks, and past performance does not guarantee future results. Always conduct thorough research and consider your investment goals before making any decisions.

Growth > Value suggests still appetite for risk assetsThe Growth/Value ratio chart suggests that growth stocks may continue to outperform value stocks - which is normally in line with risk assets in general doing well.

SPY (S&P500 ETF) - Weekly - Potential Resistance Price TestSPY (S&P500 ETF) has been in an uptrend since 2023 and is approaching its all-time-high price resistance again.
$523.07 is the current all-time-high price resistance.
$497.83 is the current support level price, and also the 0.236 fibonacci level.
Bullish Scenario: If SPY price breaks out above $523.07, the next resistance price targets could be: $537, $550, $563, $575.
Bearish Scenario: If SPY price reversse back down, a potential lower-low in the price could be set over time. Support price levels could be: $508, $497, $489, $476, $466.
Note: corporate earnings, FOMC interest rate changes, government legislation, breaking news, and global events could override technical chart patterns.
Date created: 05/10/2024

Top hunting the illusive dropStill looking for the spot I am will to short. I see we still could be a week away.
Each day i will post what I see and if a trade develops than we find it together.
I have no idea of these threads having any value to anyone, so comments or feed back woud be great.
