ETF market
Spy is hotLooks like AMEX:SPY can hover here and trade higher from these levels. RSI is hot and momentum is carrying this uptrend. Low volume = sellers not in sight. NASDAQ:NVDA earnings might push it to close above $531.50 by Wednesday. A down day with high volume will be the beginning of a pullback.

$SPY May 22, 2024AMEX:SPY May 22, 2024
15 Minutes.
Oscillator divergence getting sorted out.
At the moment sell below 529.7 and buy above 531.75.
If NASDAQ:SPT crosses 531.75 with bar having close near top, we can buy for 534 range.
And if it closes below 529 with bar close near low of bar i will short for 527.5 levels which also is possible 200 average during the day.
For the day consider the rise 529.07 to 531.51.
AMEX:SPY need to hold 530for a target 533.5 to 534 if 531.75 is crossed.
At the moment AMEX:SPY is struggling around 531.5 three times.
One negative issue I have is, the stochastics had a black bar on top and it retraced say below 25 without creating a black bar at bottom. But once it has crossed 75 there is no black bar on top. So, momentum seems to have lost. Have marked in chart.
So, I will wait for first 15 minutes after open and take a call.

Elliott Wave Analysis on S&P 500 ETF (SPY) Calling for More UpsiShort Term Elliott Wave in S&P 500 ETF (SPY) suggests the rally from 4.20.2024 low is in progress as an impulse. Up from 4.20.2024 low, wave ((i)) ended at 510.75 and dips in wave ((ii)) ended at 499.49. The ETF has extended higher in wave ((iii)) with internal subdivision as another impulse in lesser degree. Up from wave ((ii)), wave i ended at 508.19 and dips in wave ii ended at 499.55. Wave iii ended at 518.57, wave iv ended at 514.98, and wave v ended at 522.63 which completed wave (i).
Wave (ii) pullback has ended at 518.18 which subdivides into a double three Elliott Wave structure. The ETF then extended higher inw ave (iii) towards 531.52 and pullback in wave (iv) ended at 527.32. Final leg wave (v) is in progress and can see a few more highs before ending wave (v) of ((iii)). Afterwards, it should pullback in wave ((iv)) to correct cycle from 5.1.2024 low before it resumes higher. Near term, as far as pivot at 499.73 low stays intact, expect dips to find support in 3, 7, 11 swing for further upside.

MEGA TRADE: Copper Short SqueezeCopper has had a monster run to the upside.
Its clearly going to affect aspects in the economy by applying upward pressure on inflation and downward pressure on home builders and construction.
Copper surging shows resilience in the global economy but simultaneously high copper prices could cure this rushing demand.
Copper technicals are screaming a pullback, a short setup is looming.

$SLV ETF Inverse Head & Shoulders Pattern & Fibonacci ResistanceAMEX:SLV ETF Inverse Head & Shoulders Pattern & 50% Fibonacci Resistance. Silver will need to consolidate before it can break higher to the blue line.
The Inverse Head & Shoulders (IHS) pattern is a bullish reversal pattern in technical analysis, typically appearing at the end of a downtrend. It is characterized by three distinct lows:
1. **Left Shoulder:** The initial low formed during the downtrend.
2. **Head:** A lower low, signifying a continuation of the downtrend but also a potential reversal point.
3. **Right Shoulder:** Another low, typically higher than the head, indicating weakening downward pressure.
The neckline of the IHS pattern is a resistance level drawn by connecting the highs between the left shoulder and head, and the head and right shoulder. When the price breaks above this neckline, it confirms the pattern and signals a potential reversal to an uptrend.
Traders often use the IHS pattern in conjunction with Fibonacci retracement levels to determine potential price targets. After the neckline breakout, the price is likely to retrace a portion of the initial move up before continuing higher. Common Fibonacci retracement levels used are 38.2%, 50%, and 61.8%.
**Here's how the Inverse Head & Shoulders pattern and Fibonacci resistance work together:**
1. **Identify the IHS Pattern:** Locate the left shoulder, head, right shoulder, and neckline on a price chart.
2. **Confirm the Breakout:** Wait for the price to break decisively above the neckline on increasing volume.
3. **Apply Fibonacci Retracement:** Draw Fibonacci retracement levels from the low of the head to the high of the right shoulder.
4. **Set Price Targets:** Look for potential resistance and profit-taking opportunities at the 38.2%, 50%, and 61.8% retracement levels.
**Key Points:**
* The IHS pattern is a powerful bullish reversal signal.
* Fibonacci retracement levels can help identify potential price targets after the breakout.
* Traders should always combine the IHS pattern with other technical indicators and risk management strategies to improve their trading decisions.
**Disclaimer:** Technical analysis is not a foolproof method for predicting price movements. It's essential to conduct thorough research and consider various factors before making any investment decisions.

$SMH Parallel Channel Uptrend Continues NASDAQ:SMH Parallel Uptrend Continues
The SMH ETF (VanEck Semiconductor ETF) is an exchange-traded fund designed to track the performance of the MVIS® US Listed Semiconductor 25 Index (MVSMHTR). This index is composed of the 25 largest U.S.-listed companies involved in semiconductor production and equipment.
**Key points about SMH ETF:**
* **Objective:** To replicate the price and yield performance of the MVIS® US Listed Semiconductor 25 Index as closely as possible, before fees and expenses.
* **Investment Focus:** Companies engaged in the design, manufacturing, and distribution of semiconductors.
* **Holdings:** Includes well-known semiconductor companies like Nvidia, Taiwan Semiconductor Manufacturing, Qualcomm, etc.
* **Market Exposure:** Provides investors with targeted exposure to the U.S. semiconductor industry.
* **Trading:** Trades on major stock exchanges like other ETFs.
**Why invest in SMH ETF?**
* **Diversification:** Offers a diversified portfolio of leading semiconductor companies.
* **Growth Potential:** The semiconductor industry is vital for technological advancement and has significant growth potential.
* **Convenience:** An easy way to gain exposure to the semiconductor sector without buying individual stocks.
* **Liquidity:** Typically high trading volumes ensure easy buying and selling of shares.
For further information, you can refer to the following resources:
* **VanEck SMH ETF Page:** (www.vaneck.com)
* **ETF Database:** (etfdb.com)
* **ETF.com:** (www.etf.com)
Remember, investing in ETFs involves risks, and past performance does not guarantee future results. Always conduct thorough research and consider your investment goals before making any decisions.

Growth > Value suggests still appetite for risk assetsThe Growth/Value ratio chart suggests that growth stocks may continue to outperform value stocks - which is normally in line with risk assets in general doing well.

SPYSitting on my hands at the moment. Looking to get into a short position but will not even entertain until a substantial break occurs. May nibble if weakness develops but for now I would only be looking to be a short term day trader and I would be long.

SPY (S&P500 ETF) - Weekly - Potential Resistance Price TestSPY (S&P500 ETF) has been in an uptrend since 2023 and is approaching its all-time-high price resistance again.
$523.07 is the current all-time-high price resistance.
$497.83 is the current support level price, and also the 0.236 fibonacci level.
Bullish Scenario: If SPY price breaks out above $523.07, the next resistance price targets could be: $537, $550, $563, $575.
Bearish Scenario: If SPY price reversse back down, a potential lower-low in the price could be set over time. Support price levels could be: $508, $497, $489, $476, $466.
Note: corporate earnings, FOMC interest rate changes, government legislation, breaking news, and global events could override technical chart patterns.
Date created: 05/10/2024

Top hunting the illusive dropStill looking for the spot I am will to short. I see we still could be a week away.
Each day i will post what I see and if a trade develops than we find it together.
I have no idea of these threads having any value to anyone, so comments or feed back woud be great.


GDXJ new weekly lowsDollar UP.
gold at a very TOP
And miner doing very bad, after all, cant be a bullish continuation.
That means for me a RESET, to a weekly low or even a MONTHLY bottom.
If after Fed meeting, gold continues crahing (and it could) if dollar seeks new HIGH, miners would fall more...
I am full short at this moment.
There is a gap at 33 that should be filled.
And under 30 is very probable...afterwards, wait and see

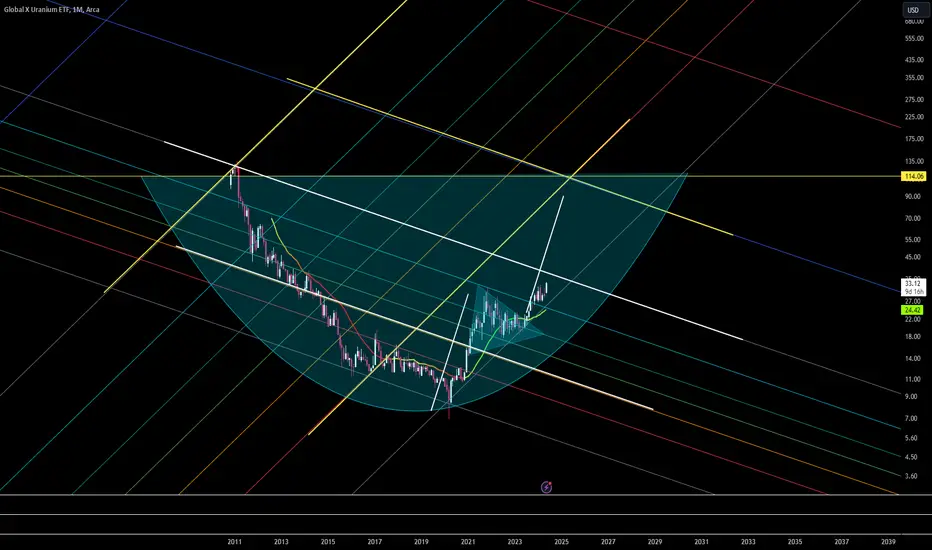
Yea, its a bull flag or whatever...Its clearly setting up for ATH and a push higher if everything goes accordingly.
What I am looking for is the DXY to push above 105 again and the VIX to start pumping, if these dont happen tomorrow after earnings then we are set up to rally until July - October.
I can see a pump until election time playing out, volatility is about to pick up big time within the next 6 months.

The Traditional 60/40 Portfolio ReimaginedThis is a snipet of a more extensive note on themacrobrief.substack.com
This trend of central banks accumulating higher gold reserves also holds true on a global basis.
This has huge implications for investors as foreign central banks hold lower US Treasury reserves vs higher gold reserves , it puts upwards pressure on US yields (Lower bond prices) and creates demand for gold resulting in higher gold prices.
The Macro Brief is a reader-supported publication. To receive new posts and support my work, consider becoming a free or paid subscriber.
Traditional 60/40 portfolios are likely to suffer if this trend of replacing US Treasury reserves with gold continues.
Traditional 60/40 vs Modern 60/40 vs 60/20/20 Stocks, Bonds & Gold
Below are the results for a monthly investment strategy investing $250 a month from 1984 to today in both the traditional 60/40 stocks and bonds vs modern 60/40 stocks and gold and also a balanced approach which has 60/20/20 stocks, bonds and gold. The portfolio is rebalanced yearly.
The tailwind in bonds from a 40 year decline in interest rates contributed to long periods of outperformance for the traditional 60/40 portfolio, however the other two portfolios of modern 60/40 and 60/20/20 both produced marginally better performance.
Given the macro landscape developing from central banking behaviour and the uncertainty of inflation, interest rates, we could be entering a period where the modern 60/40 produces long periods of outperformance. Considering an allocation which diversifies bond holdings with gold could offer a lifeline for the traditional 60/40 and better prepare investors' portfolios to navigate the road ahead.
Whilst the traditional 60/40 stocks and bonds portfolio has been the portfolio of choice for the global trends of the last 40 years, the trends emerging for the decades ahead especially the reduction of foreign central bank holdings of US treasuries and the accumulation of gold as part of their balance sheet means that investors portfolios stand to benefit a great deal by considering a switch from the traditional 60/40 models, with the most likely beneficiary being gold.
Stay tuned for more insights on financial strategies, market trends and macro insights from The Macro Brief.

QQQ Nothing can stop itNASDAQ cannot be stopped, or can it ?
can we finally see a breath taking from US Markets or are we gonna continue all the way through higher highs until it blows up
China did the right move to sell 53bn US Debt cause if this thing suddenly stops, then they would be the one holding the sand bag

#SPY Analysis, Key Levels & Targets for DAY Traders #SPY Analysis, Key Levels & Targets for DAY Traders
Today’s Trading Range is a little bit stinky, in my opinion. Implied move from options is small. Volume yesterday was extra stinky low. 37M when everything settled and 11M around 12:30ET…
I don’t like low volume trading so even though I will be trading a little bit what I’m really looking for is VOLUME….
Outside of that - The 35EMA has held us up since FOMC, so that’s the other level I’ll be looking for today.
Complete walkthrough in last nights video. GL today, y’all….

Looking interesting here. Beginning to gain levels on the daily.Looking interesting here. This is starting to smell like a bottom, since it gained that swing on the daily. For you pattern traders, a diamond reversal is in play. Risk/Reward here is pretty decent WITH STOPS at the low.

$QQQPrice swept liquidity and candle closed above key level. Waiting to see how price reacts to news. Overall looking to enter long

SLV 🩶ready for journey - double from here?AMEX:SLV
Silver , gold is commodity play and never want to hold for long term
however, opportunity to trade always an opportunity for PWI LAB portfolio
looking to add based on my weekly setup
What do you think?

$SPY interesting cycle analysisNot a recommendation, just thought the cyclical nature of these time periods align. We'll see :)

$SPY May 21, 2024AMEX:SPY May 21, 2024
15 Minutes
For the rise 525.18 to 531.52 4SPY earlier had retraced to 527.33.
Being 61.8% retracement usually it will make double top.
On that basis AMEX:SPY hit 531.56 today.
It retraced to 529.17.
Therefore 527.33 can be treated as HL.
Now that number should hold for uptrend.
Hence if we consider the rise from 527.33 to 531.56 AMEX:SPY need to hold 528.5 - 529 levels to continue the trend.
But we have oscillator divergence.
Hence holding 527 is important else we have a target 526-524, 524 being 23.6% retracement for the move 499.55 to 531.56.
Hence for the day
If 527 is broken i have a target 526 which is 200 averages in 15 minutes.
And if 531.75 is broken with good close on bar then target is 534.
I expect a one-sided move today based on open.

QQQ BULL FLAG | Possible New ATH'ssimple price action here, 4h macro structure broke to the upside with the 1h flagging at highs. Don't let it fool you though... this play could Boom OR Bust. Size accordingly.
