Nifty Nifty levels are based on volume profile
1. Gapup 26200 short
2. 26200-26100 trade reversal
3. Gapdown 26050 short
Futures market

GOLD Buys ideaFed dovish policy
Market structure shifted to Bullish, with buyers now in control.
Looking to play buys up until FOMC .

gold on short buy retest#XAUUSD we await price to breakout from 4213 to buy which range from 4211 is now invalid.
Buy stop 4213 2 Times breakout possible or market entry, target 4230-35, SL 4205.
Below the 4205 will form range which will trigger bearish formation, but below 4195 holds the strong bearish movement.

Ensure to break though the trendlinePlease ensure the trendline is broken to have the clear sign of buy direction

Gold - Warning #2 IssuedBut isn't Gold going to go up forever? Not necessarily...
Our systems at Bullfinder-official have identified potential high risk in OANDA:XAUUSD , issuing Warning #2.
This is the second time sirens have been sounded over the recent months on Gold.
Although this may not be the exact top of Gold's run, we would like to note that current regions may warrant greater caution, and present greater levels of risk.
What's to come over the months to follow? Time will tell.
We're inspired to bring you the latest developments across worldwide markets, helping you look in the right place, at the right time.
Thank you for reading. Stay tuned for further updates, and we look forward to being of service along your trading & investing journey...
Disclaimer: Please note all information contained within this post and all other Bullfinder-official Tradingview content is strictly for informational purposes only and is not intended to be investment advice. Please DYOR & Consult your licensed financial advisors before acting on any information contained within this post, or any other Bullfinder-official TV content.

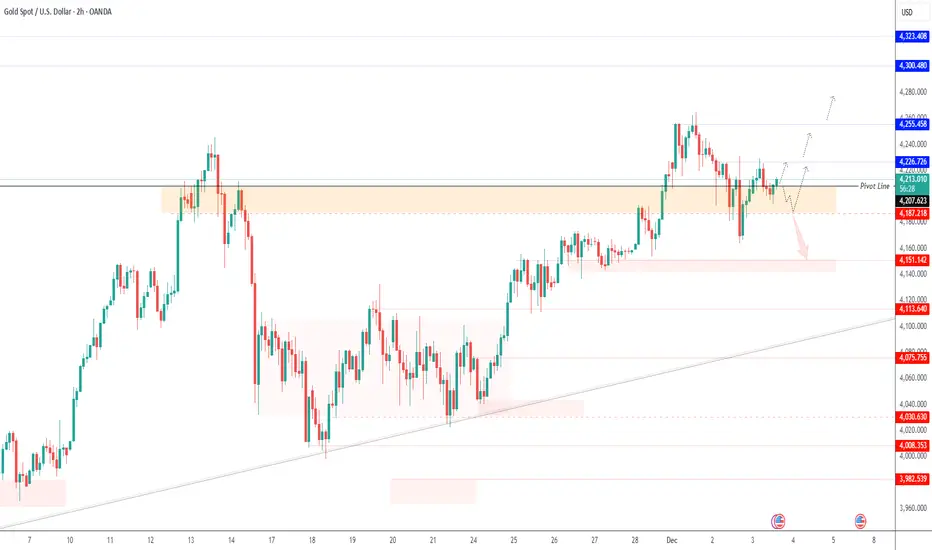
GOLD | Data-Driven Momentum Ahead of ADP & PCEGOLD – Technical Overview
Gold prices are rising as investors await key U.S. economic data this week for clearer signals on the Federal Reserve’s interest-rate outlook.
Markets are watching ADP employment, ISM Services, and the PCE price index, all of which are expected to influence rate-cut expectations.
According to the CME FedWatch Tool, traders now price in an 87% probability of a December rate cut.
Meanwhile, physical demand remains firm, with ETFs increasing their gold holdings for the fifth consecutive day, supporting overall bullish sentiment.
Technical Analysis
Gold maintains bullish pressure as long as it trades above 4207, targeting 4226 and 4255.
A breakout above 4255 could extend momentum toward the 4300 zone.
However, a 1H close below 4207 will trigger a bearish correction toward 4187.
A break below 4187 would further confirm a bearish trend continuation toward 4173 and 4151.
Key Levels
Pivot Line: 4207
Resistance: 4226 · 4255 · 4300
Support: 4187 · 4173 · 4151
A case for silver.Silver is currently under significant regulatory constraints, and its prevailing market price does not incentivize the allocation of capital toward ventures focused on increasing its supply. This creates a supply constraint for the asset.
Beyond its role as an inflation hedge, a characteristic shared by most commodities, silver possesses unique properties that are particularly valuable for industrial applications. As we stand on the brink of a new wave of industrial expansion, silver's conductivity and reflectivity make it indispensable in various technologies, such as solar panels (where China leads in production), antifreeze formulations, and numerous other applications.
Recently, President Putin announced that Russia will include silver in its strategic reserves. Meanwhile, China has been engaging in confidential agreements with miners and refiners to secure prices over extended periods. Due to China's relatively loose regulatory framework, these transactions are not publicly disclosed, and as a result, they are not reflected in silver's market price. This can be said for African, Latin-American, or other Asian countries with loose regulation for these kinds of markets. Silver pricing predominantly occurs on the futures market, which underscores cases where a disconnect arises between market prices and underlying realities, leading to potential distortions in valuation.
Case 1: JP Morgan commodities trading desk scandal.
" A federal jury in the Northern District of Illinois convicted a former trader at JPMorgan Chase and Credit Suisse today of fraud in connection with a spoofing scheme in the gold and silver futures markets.
According to court documents and evidence presented at trial, Christopher Jordan, 51, of Mountainside, New Jersey, was an executive director and trader on JPMorgan’s precious metals desk in New York from 2006 to 2009, and on Credit Suisse’s precious metals desk in New York in 2010. Between 2008 and 2010, Jordan placed thousands of spoof orders, i.e., orders that he intended to cancel before execution, to drive prices in a direction more favorable to orders he intended to execute on the opposite side of the market. Jordan engaged in this deceptive spoofing strategy while trading gold and silver futures contracts on the Commodity Exchange (COMEX), which is a commodities exchange operated by the CME Group. These deceptive orders were intended to inject false and misleading information about the genuine supply and demand for gold and silver futures contracts into the markets... Four other former JPMorgan precious metals traders were previously convicted in related cases. In August 2022, Gregg Smith and Michael Nowak... spoofing... In October 2018, John Edmonds pleaded guilty in the District of Connecticut... wire fraud, commodities fraud, price manipulation, and spoofing... In August 2019, Christian Trunz pleaded guilty in the Eastern District of New York to one count of conspiracy to engage in spoofing and one count of spoofing... "
This is the article if you'd like to read more: www.justice.gov
My thoughts; This type of practice is an example of how there always a disconnect with real life and markets. One must also remember how information travels and the infrastructure and systems in place that runs our financial system. I believe JP Morgan's swift settlement shows to me there was not much accountability addressed.
Case 2: Silver Thursday, Hunts Brothers, 1970s
" Nelson Bunker Hunt and William Herbert Hunt — oil company executives, investors and brothers — first began purchasing silver in the early 1970s at a price of less than $2 per ounce. The Hunt brothers’ fervor for silver accelerated dramatically following the death of their father in 1974, a Texas oil tycoon known as H.L. Hunt. His passing released a $5 billion fortune to members of the Hunt family.
Fueled by an enormous amount of capital, the Hunt brothers continued stockpiling silver and purchasing silver futures contracts. By early 1979, the price of silver had risen to about $6 per ounce. The Hunt brothers acquired roughly 195 million ounces of silver, about a third of the world’s total supply. They facilitated their silver purchases in part by investing in futures contracts through several brokers, including Bache Halsey Stuart Shields, Prudential-Bache Securities, and Prudential Securities. By December 1979, the market price for silver fluctuated between $20 and $25 per ounce.
Silver had become exorbitantly expensive even for practical uses. Doctors struggled to afford X-ray film for patients, families melted down their heirloom silver flatware, silver burglaries skyrocketed, and Tiffany’s & Co. was forced to drastically raise its jewelry prices. Tiffany’s even took out a full-page ad in the New York Times criticizing the Hunt brothers, writing, “We think it is unconscionable for anyone to hoard several billion, yes billion, dollars’ worth of silver and thus drive the price up so high that others must pay artificially high prices for articles made of silver.”
Silver reached a record high of $48.70 per ounce on Jan. 18, 1980. By some estimates, the Hunt brothers’ entire silver fortune peaked at a value of $10 billion.
Thursday, March 27, 1980
Facing out-of-control silver prices, COMEX (Commodity Exchange, Inc.), a division of the New York Mercantile Exchange (NYMEX), acted against the Hunt brothers. On Jan. 7, 1980, COMEX introduced Silver Rule 7, which placed heavy restrictions on the purchase of commodities on the margin.
Following its peak price of $48.70 per ounce, silver began its decline and the Hunt family’s silver fortune began to shrink.
On March 27, 1980, known as Silver Thursday, the price of silver dropped 50% in a single day, from $21.62 to $10.80 per ounce. The Hunt brothers failed to meet several margin calls and about $7 billion in paper assets suddenly turned into a $1.7 billion debt.
The sudden price drop threatened to collapse several investment firms and banks. To prevent widespread financial chaos, multiple banks joined together to issue the Hunt brothers a $1.1 billion line of credit..."
The original article: learn.apmex.com
My thoughts: Now you see that one entity can have huge influence on the market. Your once dusty silver mirror can become valuable enough for you to go and find it and clean it and sell it.
One actionable step you can take today is to capitalize on silver's current low valuation. There's clearly a lag between what's happening in the physical market and how that information gets reflected in exchange prices. Interestingly, we've seen noticeable price increases and premiums when buying physical silver, but there hasn’t been much movement in the more liquid instruments like the GLD or SLV ETFs—which, by the way, JPM vaults silver for. This disconnect exists because the market takes time to catch up to reality. What’s your take on this?
More articles:
marketsanity.com
www.justice.gov
www.reuters.com
www.investing.com
seekingalpha.com
investingnews.com
metalsedge.com
www.moneymetals.com

XAUUSD ANALYSIS 📉 XAUUSD (GOLD) H1 ANALYSIS & LEVEL FORECAST 📈
Gold has been moving downward on the H1 timeframe, showing clear rejection from the 4220 resistance zone. Price is currently moving inside a parallel channel, respecting both upper and lower boundaries.
After completing its downward move toward the 4180 support level for a potential retracement, the structure suggests that buyers may step in.
🔑 Key Levels to Watch
Resistance: 4220 (strong rejection zone)
Support: 4180 (retracement zone)
Upside Targets:
🎯 4260
🎯 4265
📌 Technical Outlook
If price holds above 4180, a bullish bounce toward 4260/4265 becomes highly probable. Break below 4180 would invalidate the bullish setup.


Short Covering vs. New Money (Waiting for the Catalyst)COMEX:GC1! COMEX_MINI:MGCG2026 FOREXCOM:XAUUSD
Traders. Mid-week context check as we wait for institutional commitment.
Market Context (The Mechanical Bounce): As noted in the previous update, yesterday's rotation was driven by Short Covering—old money exiting profitable shorts—rather than Initiative Buying (New Money) entering fresh longs.
The Trap: Short covering can lift the auction, but it lacks the sustained energy to break new highs. We are seeing price drift without aggressive volume.
Inventory: We are currently balancing above the Previous Week High (PWH). This zone is holding, but the auction feels "heavy" without fresh inflows.
The Fundamental "Hold" (Why Big Funds are Waiting): "Big Funds" are likely sidelined ahead of the tier-1 data dump. They need clarity before deploying serious capital for the week.
Today (Wed): ADP Payrolls & ISM Services.
Friday: The NFP (Non-Farm Payrolls).
The Reality: Until these numbers drop, we may remain in a "chop" or "balance" phase as institutions hedge rather than commit.
Plan & Execution:
Bias: Slightly Long, strictly conditional on holding above the PWH.
The Trigger: I need to see Follow Through. We need a volume spike (Initiative Buying) to confirm that "New Money" has arrived to defend this breakout.
Caution: If we fail to find acceptance higher and lose the PWH, expect a rotation back inside the previous balance to find liquidity.
Talk to you for the next update.

Gold 1H – 4262 Sweep Drop or 4188 Hold the Floor?🟡 XAUUSD – Intraday Smart Money Plan | by Ryan_TitanTrader (03/12)
📈 Market Context
Gold is trading into policy-driven liquidity engineering as former White House adviser Kevin Hassett gains renewed spotlight after public commentary from former U.S. President Donald Trump referencing potential Federal Reserve leadership influence. Expect sharp liquidity sweeps both sides before institutions commit.
Technically, H1 price coils between premium and discount extremes, and the next leg unlocks only after MSS (CHoCH) + BOS + displacement validation.
🔎 Technical Framework – Smart Money Structure (1H)
Current phase = liquidity-rich compression at H1 extremes
Liquidity zones & key triggers
• 🔴 SELL GOLD 4265 – 4267 | SL 4275
Institutional idea: sweep above premium → bearish MSS + valid BOS down → FVG/OB retest → delivery into discount.
• 🟢 BUY GOLD 4186 – 4184 | SL 4176
Institutional idea: sweep below discount → bullish MSS + BOS up → FVG/OB retest → demand expansion.
• 🟡 Equilibrium / Chop: no trading unless structure proves intent.
Expected sequence = Sweep → MSS/CHoCH → BOS → Displacement → Retest → Expansion
🎯 Execution Rules (unchanged methodology, matching your zones)
🔴 SELL GOLD 4265 – 4267 | SL 4275
Rules:
✔ Price taps 4266 zone → bearish MSS/CHoCH (M5–M15)
✔ Confirm clean bearish BOS down with displacement
✔ Enter on FVG fill or OB retest after displacement
Targets:
1. 4245 – 4240
2. 4225 – 4215
3. 4186 – 4184
🟢 BUY GOLD 4186 – 4184 | SL 4176
Rules:
✔ Price sweeps 4185 → bullish MSS/CHoCH + BOS up
✔ Confirm displacement away from discount
✔ Enter on wick rejection + FVG fill or OB retest confirmation
Targets:
1. 4215
2. 4240
3. 4265+
⚠️ Risk Notes
• Both sweeps = traps until BOS + displacement proves intent.
• No averaging inside compression.
• SL = structure invalidation only.
• Reduce lot size during volatility spikes from headline risk.
📍 Summary
Two institutional routes today:
• 4266 sweep → bearish MSS/BOS → retest → delivery into 4185
or
• 4185 sweep → bullish MSS/BOS → retest → expansion into new 4266+
Trade the structure. Let price narrate intent. Patience = edge.
📌 Follow @Ryan_TitanTrader for daily Smart Money breakdowns.

BUY ZONE
✅ BUY SIGNAL – XAUUSD
Signal: BUY
Entry Zone: 4201 – 4207 (marked BUY ZONE on chart)
Reason: Price has retraced into a fresh demand zone after a bullish impulse move. Current candles show slowing bearish momentum, indicating potential continuation to the upside.
Targets:
TP1: 4215
TP2: 4222
TP3:4230
Stop-Loss: Below zone at 4195
Bias: Bullish as long as price holds above the demand zone.

XAUUSD BUYLong position on XAUUSD we might as well look forward to ATH after major resistance got broken

Let the candle breakoutFrom overall view if we change to line chart in 1H we can see it doing the uptrend. Hence we need double confirmation for the candle breakout and retest in zone before we decide which direction the XAUUSD is going.

Gold Eyes Support as Fed Cut Bets Fuel Volatility📊 Market Developments
• Gold is trading around ~4,224 USD/ounce, with strong volatility as U.S. bond yields rise slightly → creating downward pressure on gold.
• Expectations that the Fed may cut interest rates soon help gold maintain underlying buying interest.
• The market is awaiting new U.S. economic data to determine a clearer direction.
📉 Technical Analysis
Key Resistance:
1. 4,240 – 4,250 USD (near resistance – recent reaction high).
2. 4,268 – 4,275 USD (extended resistance – breaking above may open the path toward 4,300).
Key Support:
1. 4,180 – 4,200 USD (near support – strong buy zone for bulls).
2. 4,155 – 4,165 USD (mid-term support – aligns with major EMAs; losing this zone may trigger a drop toward 4,130).
EMA:
• Price is hovering around EMA09 on H1/H4 → short-term trend remains indecisive, no clear bullish or bearish confirmation yet.
Candles / Volume / Momentum:
• Volume leans bearish, momentum slightly declining.
• Waiting for confirmation candles: a bullish reversal at 4,180–4,200 or a strong breakdown below 4,165.
📌 Outlook
Gold may retest support with mild downside, especially if U.S. yields continue rising.
However, weak economic data and stronger expectations of Fed rate cuts could trigger a rebound from support.
➡️ Current trend: Neutral – slightly bearish, waiting for reaction at support.
💡 Suggested Trading Strategy
🔻 SELL XAU/USD: 4,242 – 4,245
🎯 TP: 40 / 80 / 200 pips
❌ SL: ~4,248
🔺 BUY XAU/USD: 4,158 – 4,155
🎯 TP: 40 / 80 / 200 pips
❌ SL: ~4,152

Not Tradable but Investment is under radarxauusd is not tradable now..
Waiting for yellow line correction.
Buy in decline only... this is strategy
I will update after more price data...
Manage your risk

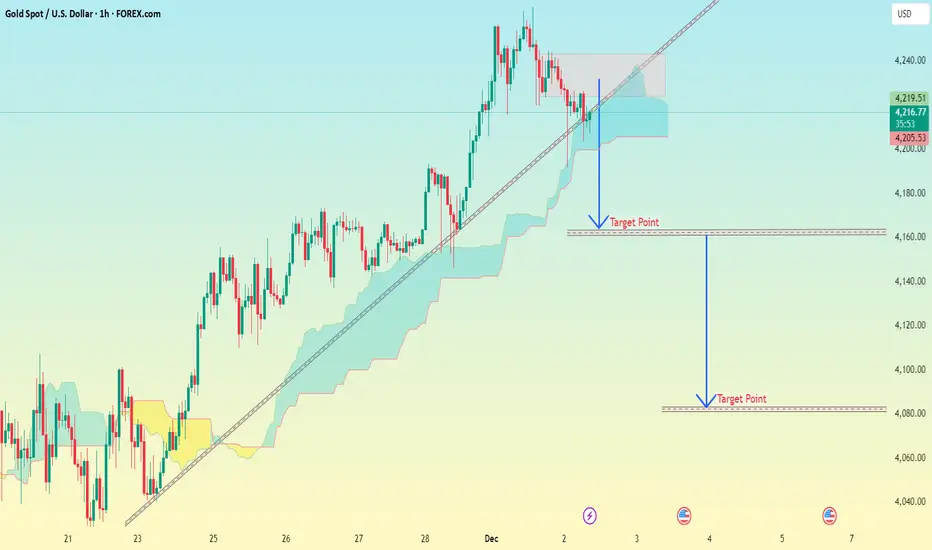
XAU/USD Bullish Setup Developing Toward 4226 and 4257The XAUUSD chart shows price stabilizing after a corrective move within the descending channel, with buyers defending the highlighted support zone. Candles are attempting to build momentum above the Ichimoku cloud, indicating early signs of a potential bullish shift. The structure suggests that if price maintains support near the 4200–4205 region, upside continuation becomes likely. A break and hold above the minor consolidation area could open the way for a progressive move toward the first target at 4226. Sustained strength above this level may attract further buying interest, driving price toward the second target at 4255. Overall, the market is showing signs of recovery as long as support remains intact.
If you found this XAUUSD analysis helpful, don’t forget to LIKE 👍 and COMMENT 💬!

Xauusd 1H chart Pattern..Here is a clean professional analysis with accurate targets based on the chart I'm shared (trendline break + cloud retest + liquidity zones):
---
📉 XAUUSD Analysis & Targets
Market Structure
Price broke the ascending trendline
Currently retesting the cloud support zone
Sellers are strong from 4235–4245 supply zone
Liquidity is resting below 4180 & 4160
---
🎯 Target Levels (Based on Analysis)
🔻 TP1: First Breakdown Target
4185 – 4178
Reason: First liquidity pocket + trendline retest.
---
🔻 TP2: Major Support Target
4165 – 4155
Reason: Imbalance fill + cloud lower band + horizontal demand.
---
🔻 TP3: Extended Drop Target
4120 – 4105
Reason: Large imbalance area + my lower drawn target zone.
---
🔻 TP4 (Deep Target / Final)
4095 – 4085
Reason: Strong historical demand + liquidity sweep zone.
---
📌 Summary
Target Level
TP1 4185–4178
TP2 4165–4155
TP3 4120–4105
TP4 4095–4085
SILVER Will Go Lower From Resistance! Sell!
Please, check our technical outlook for SILVER.
Time Frame: 4h
Current Trend: Bearish
Sentiment: Overbought (based on 7-period RSI)
Forecast: Bearish
The market is testing a major horizontal structure 5,852.3.
Taking into consideration the structure & trend analysis, I believe that the market will reach 5,592.7 level soon.
P.S
Overbought describes a period of time where there has been a significant and consistent upward move in price over a period of time without much pullback.
Like and subscribe and comment my ideas if you enjoy them!

Brent Crude bearish trend continuation capped at 6417The Brent Crude continues to display a bearish outlook, in line with the prevailing downward trend. Recent price action suggests a corrective pullback, potentially setting up for another move lower if resistance holds.
Key Level: 6417
This zone, previously a consolidation area, now acts as a significant resistance level.
Bearish Scenario (rejection at 6417):
A failed test and rejection at 6417 would likely resume the bearish momentum.
Downside targets include:
6235 – Initial support
6177 – Intermediate support
6120 – Longer-term support level
Bullish Scenario (breakout above 6417):
A confirmed breakout and daily close above 6417 would invalidate the bearish setup.
In that case, potential upside resistance levels are:
6464 – First resistance
6530 – Further upside target
Conclusion
Brent Crude remains under bearish pressure, with the 6417 level acting as a key inflection point. As long as price remains below this level, the bias favours further downside. Traders should watch for price confirmation around that level to assess the next move.
This communication is for informational purposes only and should not be viewed as any form of recommendation as to a particular course of action or as investment advice. It is not intended as an offer or solicitation for the purchase or sale of any financial instrument or as an official confirmation of any transaction. Opinions, estimates and assumptions expressed herein are made as of the date of this communication and are subject to change without notice. This communication has been prepared based upon information, including market prices, data and other information, believed to be reliable; however, Trade Nation does not warrant its completeness or accuracy. All market prices and market data contained in or attached to this communication are indicative and subject to change without notice.

WTI Crude downtrend continuation resistance at 6980The WTI Crude continues to display a bearish outlook, in line with the prevailing downward trend. Recent price action suggests a corrective pullback, potentially setting up for another move lower if resistance holds.
Key Level: 5980
This zone, previously a consolidation area, now acts as a significant resistance level.
Bearish Scenario (rejection at 5980):
A failed test and rejection at 5980 would likely resume the bearish momentum.
Downside targets include:
5796 – Initial support
5728 – Intermediate support
5667 – Longer-term support level
Bullish Scenario (breakout above 5980):
A confirmed breakout and daily close above 5980 would invalidate the bearish setup.
In that case, potential upside resistance levels are:
6025 – First resistance
6100 – Further upside target
Conclusion
WTI Crude remains under bearish pressure, with the 5980 level acting as a key inflection point. As long as price remains below this level, the bias favours further downside. Traders should watch for price confirmation around that level to assess the next move.
This communication is for informational purposes only and should not be viewed as any form of recommendation as to a particular course of action or as investment advice. It is not intended as an offer or solicitation for the purchase or sale of any financial instrument or as an official confirmation of any transaction. Opinions, estimates and assumptions expressed herein are made as of the date of this communication and are subject to change without notice. This communication has been prepared based upon information, including market prices, data and other information, believed to be reliable; however, Trade Nation does not warrant its completeness or accuracy. All market prices and market data contained in or attached to this communication are indicative and subject to change without notice.

Gold (XAUUSD) – Eyeing a Sweep Toward 4273–4281Gold continues to show intraday strength after holding above recent higher-low structure.
The current bullish leg appears corrective in nature, with price aiming toward the
4273–4281 supply zone highlighted on the chart.
From a fundamental perspective, demand for gold remains supported as markets weigh
the possibility of softer U.S. economic data and expectations of future Fed easing in 2026.
Risk-off flows have also kept buyers active on dips. As long as price holds its internal
bullish structure, a push into the overhead imbalance remains likely.
I’ll be watching how price reacts once it reaches the 4273–4281 zone — this area could
offer a reaction or potential short-term reversal depending on order flow.

Gold Potential UpsidesHey Traders, in today's trading session we are monitoring XAUUSD for a buying opportunity around 4,185 zone, Gold is trading in an uptrend and currently is in a correction phase in which it is approaching the trend at 4,185 support and resistance area.
Trade safe, Joe.
