UBER - Short set upBearish Divergence on 1H TF, planning to enter short on break of support and have my sell stop / entry at 68.65
Entry - 68.65
Stoploss - 69.71
TP-1 -67.59
TP-2 - 66.56
#Trading #Technical #Crypto #Stocks #commodities

easy long play on Apple mid-termnice candlestick pattern, apple 1M chart forms a sequence of three distinct candlesticks within the broader context of an uptrend.
Perfect with the drop of AI play by Apple, serious and simply AI, not like other AIs play for the fomo and to the moon shit.

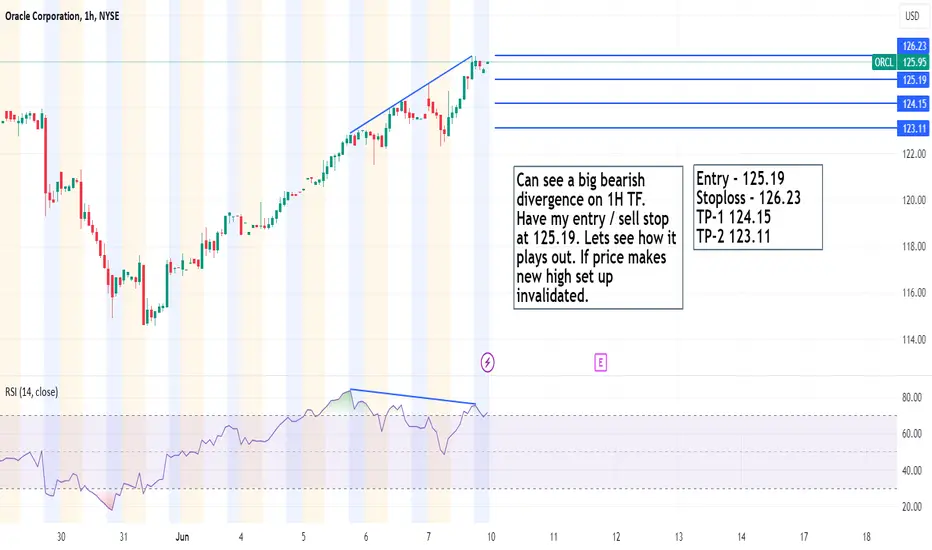
Oracle Corp - Short SetupCan see a big bearish divergence on 1H TF. Have my entry / sell stop at 125.19. Lets see how it plays out. If price makes new high set up invalidated.
Entry - 125.19
Stoploss - 126.23
TP-1 124.15
TP-2 123.11
GTLB High margin of safety Good resistance at these levels and with continued revenue growth looks like a good place to buy. 💰

Buy Abercrombie & FitchShort Term Trading Advice by Naranj Capital
Buy Abercrombie & Fitch
● Buy Range- 180 - 185
● Target- 200 - 205
● StopLoss- 170
● Potential Return- 8-11%
● Duration- 12-14 Trading Days

Is AMZN Ready to Break $200?Amazon.com Inc. (NASDAQ: AMZN) is demonstrating robust performance amidst a backdrop of market volatility. With its stock currently trading around $187.06 in pre-market action, Amazon is poised for significant movements. Let's dive into a detailed technical analysis to explore potential trading opportunities, leveraging indicators, candlestick patterns, and the latest financial news.
The daily candlestick chart for Amazon displays a notable bullish momentum. The latest candles are trading above key moving averages, including the 10, 20, 50, and 200-day Exponential Moving Averages (EMAs). This bullish engulfing pattern suggests a potential continuation of the upward trend.
The price is trading above the Ichimoku Cloud, indicating a strong bullish trend. The conversion line (blue) is above the base line (red), further confirming the upward momentum. The span A is above span B, reinforcing the bullish outlook. This setup is traditionally a signal to enter long positions.
RSI (14) The Relative Strength Index is at 59.70, indicating that the stock is in neutral territory but leaning towards overbought conditions.
MACD The Moving Average Convergence Divergence (MACD) is positive at 0.20, with the MACD line crossing above the signal line, suggesting a buy.
Stochastic Oscillator At 89.08, it shows the stock is approaching overbought levels but can still sustain upward momentum.
Awesome Oscillator Slightly negative at -0.17 but insignificant to alter the bullish stance significantly.
Amazon’s market capitalization stands at an impressive $1.95 trillion, with a Price to Earnings Ratio (P/E) of 51.76, highlighting investor confidence in its growth potential. The company’s revenue for 2023 is strong, and the forecast suggests continued growth, especially in the cloud computing segment, Amazon Web Services (AWS).
Expansion in AI and Cloud Amazon’s recent initiatives in AI and further expansion in cloud services are creating positive market sentiment. Reports of AWS securing significant new contracts could propel stock prices further.
Consumer Demand Despite broader economic concerns, Amazon’s dominance in e-commerce and its ability to adapt to consumer trends positions it well against competitors.
Amazon’s trading volume is substantial, with an average volume of 40.83 million over the past 30 days, indicating strong investor interest. The recent price action shows a clear breakout above the $185 resistance level, suggesting that the stock could test the $200 psychological level soon.
Resistance Levels (R1, R2, R3) $187.48, $198.50, and $216.33 respectively
Support Levels (S1, S2, S3) $169.64, $162.84, and $145.01 respectively
Trade Strategy and Price Targets
Long Position
Entry Point Consider entering a long position at the current price around $187.06.
Stop Loss Set a stop loss below the recent support level at $182.00 to manage downside risk.
Target Price First target at $200 (R1), and if the bullish momentum continues, look towards $216.33 (R3) as a secondary target.
Short Position
Entry Point Only consider shorting if the price breaks below the $180.67 pivot point.
Stop Loss Place a stop loss at $185.00.
Target Price Initial target at $169.64 (S1), and further downside potential towards $162.84 (S2) if the bearish trend intensifies.
Amazon's stock is currently exhibiting strong bullish signals, supported by technical indicators and positive market sentiment. With a potential breakout above $200, there are compelling opportunities for long positions. However, traders should remain vigilant for any signs of a trend reversal and manage risk through well-placed stop losses.

Buy KKR & Co.Short Term Trading Advice by Naranj Capital
Buy KKR & Co.
● Buy Range- 106 - 108
● Target- 115 - 116
● StopLoss- 101
● Potential Return- 6-7%
● Duration- 14-16 Trading Days

MSFT Possible buy ideaMicrosoft, technology services giant, is making a perfect long entry possibility on its weekly chart.
What to have on mind when watching the stock:
1. On Daily time frame, we had a perfect 50EMA retest. Stock managed to retake it and to even break above the smaller moving averages, the 10 and 21EMA.
2. This time frame is giving us a broad stop loss opportunity, once we enter the stock. To be precise, once the break of previous highs happen, my stop loss will be around the Daily 50EMA level, which is around $416.5 at the moment.
3. Back to weekly time frame and our entry point, my first entry would be once the price enters the Weekly channel, or it's previous high zone, sitting at around $430 price level. I will be monitoring the price and trading volume once this happens, I would like to see larger than usual trading volume.
4. My second entry and adding to the position, of course, if the break happens, will occur once the price crosses the $435.7 price level, which is just above the highest point on which the price of MSFT went.
Of course, this is just my opinion. I will try to give my best to update the idea as it develops. Thanks for liking and following me!

Fidelity National launches climate risk assessment modelFidelity National Information Services Inc., a renowned financial services and outsourcing solutions provider, recently unveiled a new product to address climate risk assessment. As businesses grapple with the increasing uncertainty brought about by global climate change, Fidelity is positioning itself as a key player in the market for analytical tools.
Fidelity National’s newly introduced service, named the Climate Risk Financial Modeler, operates on a Software-as-a-Service (SaaS) subscription basis and is designed to assess risks associated with the physical assets of businesses and non-profit organisations. This tool is tailored for financial professionals seeking innovative methods to manage risk throughout the economic lifecycle.
Exploring potential trading opportunities, let’s review the technical analysis of Fidelity National Information Services Inc. (NYSE: FIS):
On the Daily (D1) timeframe, the stock has established a resistance level at 78.55 USD and support at 73.40 USD. The stock has been in an uptrend since the end of October 2023. If a downtrend begins, a potential downside target might be set at 60.10 USD.
However, if the current uptrend maintains its momentum and the stock price surpasses the resistance at 78.55 USD, there could be an opportunity to buy with a short-term target of 85.15 USD. For a medium-term investment strategy, the stock price might rise to 94.00 USD if the positive momentum continues.
__
Ideas and other content presented on this page should not be considered as guidance for trading or an investment advice. RoboMarkets bears no responsibility for trading results based on trading opinions described in these analytical reviews.
The material presented and the information contained herein is for information purposes only and in no way should be considered as the provision of investment advice for the purposes of Investment Firms Law L. 87(I)/2017 of the Republic of Cyprus or any other form of personal advice or recommendation, which relates to certain types of transactions with certain types of financial instruments.
Risk Warning: CFDs are complex instruments and come with a high risk of losing money rapidly due to leverage. 69.88% of retail investor accounts lose money when trading CFDs with this provider. You should consider whether you understand how CFDs work and whether you can afford to take the high risk of losing your money.

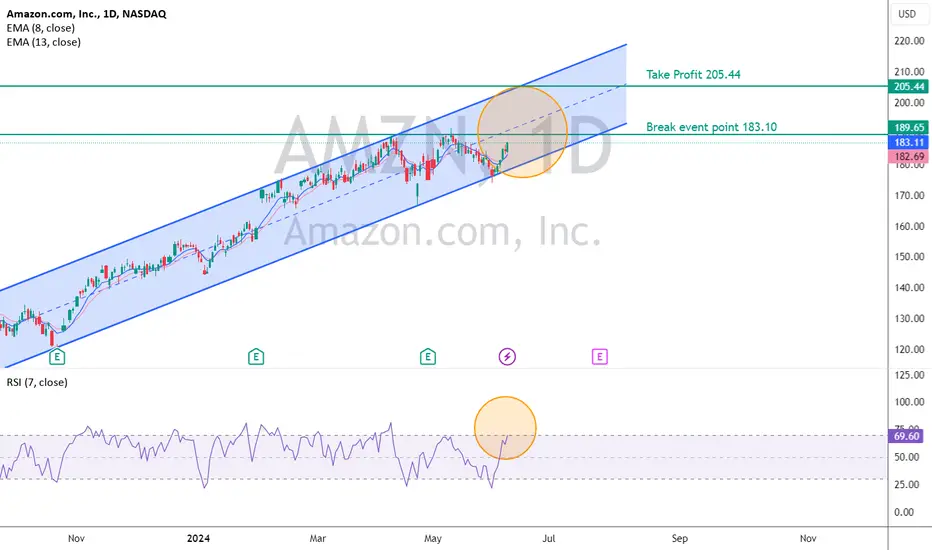
Resistance break event pointAccording to the idea of AMZN stock, the direction of the stock is upward, which can be analyzed from the perspective shown in the image to enter for profit at the Take Profit point.
"Investors should understand the nature of the product, return conditions, and risks before making investment decisions."
The limits of silicon have been reachedNASDAQ:AMD
The limits of silicon have been reached, and computing machines have hit their maximum potential for many decades. There have been no real achievements since 1984; that was the year when the ceiling was reached. The supposed development has ended. Ray tracing and all sorts of AI crap based on thrice-recycled garbage are no longer suitable for consumption.
Advancements in computing technology have stalled, and innovation seems to have plateaued. Despite the hype around new technologies like AI and ray tracing, these developments rely on rehashed concepts and fail to deliver groundbreaking results. The industry needs a fundamental shift to overcome these limitations and achieve true progress.

Are we ready for take off? Entry above 176This stock is showing a sign of strenght after long period of decline. I´m suggesting to enter long when the first 4H candle close above 176 and target 186 as a first step (partial close and set SL to BE) and then final target around 218. Don´t enter earlier, because I think stock market will pullback at the beginning of next week. Wish you good luck.

CRON, brewing a MASSIVE PRICE GROWTH soon! SEED NOW!NASDAQ:CRON (Cronos Group Inc)
SIGNAL ON!
Tri monthly data is suggesting a rare massive shift.
It is now showing a bull head signal on this extremely long term timeframe.
THIS IS EXTREMELY RARE.
LAST TIME IT HAPPENED WAS 3 YEARS AGO ON JANUARY 2021.
AND THIS IS ONLY THE THIRD TIME THIS HAPPENED
ON ITS 8-YEAR LISTING HISTORY.
SOMETHING IS DEFINITELY BREWING HERE.
AN 8.0 TARGET SEEMS TO BE THE INITIAL TARGET.
Spotted at 2.50
TAYOR.
Place safety always on your trade.
Not financial advice.

Lam research - Corrective range at the topNASDAQ:LRCX is looking at one more leg of a downside 3-wave correction and test the lower support at 798.98 level. We believe that the formation of a 5-wave larger degree broadening wedge is underway and if it form successfully , the stock will stage a grand rebound to the upside in the long-term

Monster Beverages - Bullish divergence in placeNASDAQ:MNST
Selling has been halted for Monster Beverages after bearish exhaustion was seen on 30th May. Thereafter, the stock saw a bullish divergence on the RSI, and volume has spiked. As such, we are entering buy at spot at 52.20 or waiting for a pullback to the 50.43 demand zone. Target could see beyond 60.00 in the midterm

Fedex - Looking for a long term buyNYSE:FDX is looking at a potential resumption of upside after strong buying pressure was seen at the 247.22 key support region—furthermore, the downside from 291.54 was a mere correction, we think it's likely to be a correction as no strong bearish pressure was seen. The bullish engulfing candle was seen on Monday with mid-term stochastic showing potential oversold crossover. Buy at the spot or at a lower support of 233.63

OTLY H&SFor OTLY I believe a continuation head and shoulders is forming with a neckline around 1.30, above this level I believe a resumption of the positive trend

NVIDIA Potential Resistance Breakout At $125.50 11.06.20244hr chart of NVIDIA:
- Potential resistance breakout at $125.50.
- If breakout holds:
- Target 1: $133.11.
- Target 2: $142.79 if $133.11 is broken.
- If breakout fails:
- Target 1: $119.58.
- Target 2: $114.79 if $119.58 is broken.
Apply Risk Management
Risk Warning: Trading in CFDs is highly speculative and carries a high level of risk. It is possible to lose all of your invested capital. These products may not be suitable for everyone, and you should ensure that you fully understand the risks taking into consideration your investment objectives, level of experience, personal circumstances as well as personal resources. Speculate only with funds that you can afford to lose. Seek independent advice if necessary. Please refer to our Risk Disclosure.
BDSwiss is a trading name of BDS Markets and BDS Ltd.
BDS Markets is a company incorporated under the laws of the Republic of Mauritius and is authorized and regulated by the Financial Services Commission of Mauritius ( FSC ) under license number C116016172, address: 6th Floor, Tower 1, Nexteracom Building 72201 Ebene.
BDS Ltd is authorized and regulated by the Financial Services Authority Seychelles (FSA) under license number SD047, address: Suite 3, Global Village, Jivan’s Complex, Mont Fleuri, Mahe, Seychelles. Payment transactions are managed by BDS Markets (Registration number: 143350)
Disclaimer

RCKT RCKT Try to get out of the wedge
IF it finds strength and volumes TP 28, otherwise it continues the descent

FCEL it must forcefully overcome the resistance in area 1, we hope that it finds strength and volume in the coming days

Let him cook. Let him cook.
Who wouldn't lend a hand to humble the billionaires who screw retail traders.

AMD CALL Bought AMD Call
Strike $180
Expiry 14 Jun
Entry $2.50
Expecting AMD to reach
1st Target $184
2nd Target $193
Analysis as below:
Weekly TF:
1. Uptrend -- Above SMA200
Day TF:
1. Structure -- Inverse Head and shoulder (broke out of neckline, now retesting)
2. RSI -- bullish divergence
4hr TF:
1. MA -- Price closed above EMA 25 (blue)
2. Fib R -- Price closed above 0.618 Fib R aka $158 (uptrend in tact)
3. Confirmation candle -- printed green body candle after bouncing off EMA 25 and 0.618.
4. RSI -- not overbought yet/no bearish divergence (More room for upside)
Remarks:
Price is currently testing the resistance of SMA100(purple) for the 5th time.
The frequency of price testing to break SMA100 becoming shorter (Weaker selling pressure)
If price is able to close above SMA50(green) and SMA100(purple), expect AMD to rally in no time.

