Bearish for now. The 6Hours chart has a different picture to show. It is showing two Hanging man/Cross doji candles. I am bearish until I see bullish signs again. Would you consider longing the SPY at this point ?
Not a financial advice and DYDR.
SPY trade ideas

SPY: Weak Market & Bearish Forecast
Balance of buyers and sellers on the SPY pair, that is best felt when all the timeframes are analyzed properly is shifting in favor of the sellers, therefore is it only natural that we go short on the pair.
❤️ Please, support our work with like & comment! ❤️


SP500 Entanglement of Macro Price ActionFib interconnectedness of 2 complete macro cycles
Linear coverage of the market derived from the structure:
Dot com bubble cycle ⌒ Low (march '94) ➡️ Peak '00 ➡️ Crisis bottom
Housing cycle ⌒ Low '02 ➡️ Peak '07 ➡️ Low March '09

Expired SPY Weekly outlook. 5th WK JAN 2024Expired SPY Weekly outlook. 5th WK JAN 2024
> BULLISH 📈 CORRECT
Closed Price: 487
Target Price: 490 | Strike Price: 491.47 JAN30 24'
Upper Range: 496
Lower Range: 483

SPY Update: 01/30/2024In my last post I stated, "The next primary line of resistance is the 1.618 extension @ $489.95. I expect some type of reaction there regardless of the strength it shows". When we hit that fib, we got some choppy price action but ultimately were able to push through it. The next line of resistance we look towards is the 1.786 @ $501.99. This would fare well with the phycological $500 price point. Not part of EWT, but something to think about.
Looking at MACD, this thing is still running out of gas on the micros and the macro-outlook. Many heavy weighted tickers are also coming to the ends of their respective wave 5's of varying degrees such as AMZN, AAPL, & META. These on their own should tell you this move higher is coming to an end soon. If the ED theory is correct, then we still need a B wave of 5 before making another new all-time high for the C wave of 5.
Should this not be an ED, which I don't foresee, then the target for the top would be between the 1.786-2.0. So, either way, this move higher is coming to an end soon regardless of where it is at in the count.

$SPY $SPX Trading Range for 1.31.24AMEX:SPY SP:SPX Trading Range for 1.31.24
All the levels discussed in tonight’s video.
Tomorrow we have the FOMC rate decision at 2pm so trade safe tomorrow, y’all
Look at how beautifully that 35EMA line has been support… if we break it and it turns to resistance I’d be looking to around 485

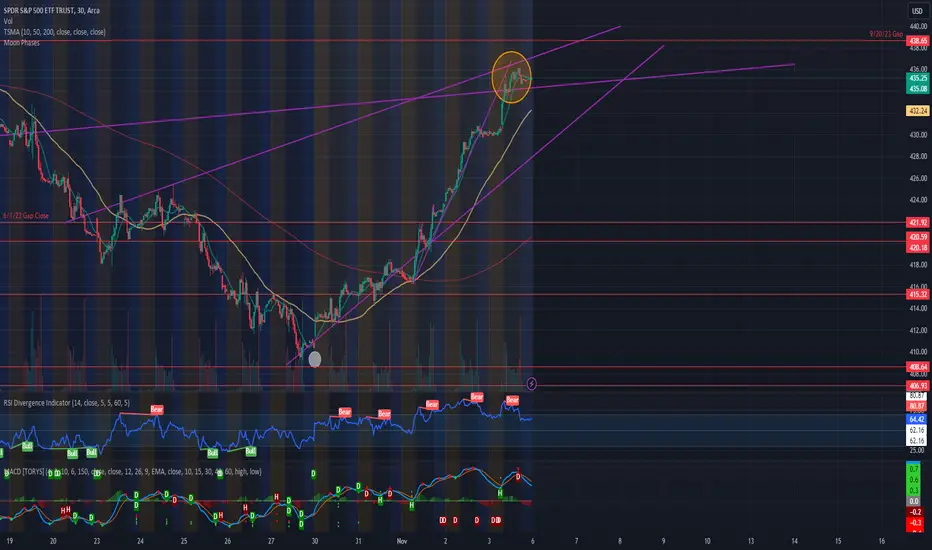
6% Rally leading to 11% pullback? Do exercise caution this next two weeks. If this is anything like last time, Nov. 13th is the next full moon, Nov. 14th is CPI at 8:30AM ... if we did not take a crap by then.... I will be assuming 11/14 will be the date that begins the "impending" 11% pullback ahead. Stay Nimble everyone!
$SPY January 31, 2024AMEX:SPY January 31, 2024
15 Minutes.
Shorts closed.
Looking for a fresh setup.
Elliott divergence continues. AMEX:SPY making new highs. I will take 2 rises.
485 to 491.47
487.84 to 491.47
As we can see in the chart AMEX:SPY has taken multiple times 100 average support in 15 minutes time frame.
So any pull back I expect to be in the range 487-488.5 levels only being 200 and 100 averages.
In the event of a pullback, it should take support around 486 levels being 200 support in 15 minutes and 9 days support daily.
Since my previous conra setup did not work out I will not take a position today. I will wait and watch for today's close.

FO or BO ?IF we are going to retest the BO-trendline the BO will be confirmed
Falling below trendline will go BEAR before trying to BO again

Spy severely overextendedSpy is due for a pullback soon. Depending how earnings go today through the end of the week I believe 476-478 is a good target zone.
I'll update this as it progresses.

SPY - Liquidity Analysis I observe a bullish configuration. There is a notable institutional accumulation of liquidity, which presents a strong potential for price extension beyond the 490 level, particularly considering the impending tech earnings announcements this week. My strategy will be to closely monitor the liquidity pools for an opportune entry point during a potential liquidity sweep. Nevertheless, should there be a breakdown from the ascending triangle pattern, I will approach it with caution. In such a scenario, I would be inclined to initiate short positions near the levels previously impacted by liquidity sweeps and where significant liquidity pools are located. Given the current market dynamics, this approach is aligned with prudent risk management.

We are now entering the stage of 28, Feeling That Bullish Sense?
We are now entering the stage of 1928 this is where people have lost their navigation and lost logic of how markets actually work.
The FREED will lower interest rates to solve debt interest allowing new capital to enter the market once again, why is this a problem?
Its a problem as the people who have been missing the 352 level up until today will re-enter the markets with high leverage to make up for the "recession side line losses"
I See this starting to happen once the 5,000 SPX level is broken and all recession jokers repeating monkey words gets a reality check.
By Level 6,000 this is where the extreme leverage will take place and full FOMO will be in full effect, the FRED by this point will try to re rise interest rates in a panic and limit market leverage (think about banning of short selling before 2009) this will logically fuel more people to take more loans and find more leverage to go long inflating the market near the 8,000 - 12,000 mark.
Be warned you can play this game with hopes the global central banks print enough capital to bail out the crash that will occur but to be honest? don't count on it. This is where they can let it all fall and push CBDC's and an entire new capitalist system.
Letting go of stock returns at the peak of 1929 will have a similar feeling, I'm sure most won't be able to do it like buying the stock market after a large correction, people trade with emotion this is why it happens.
Even though I'm very bullish on Bitcoin I suspect this is where it will have a 10-20 year sideways bear market like Gold had when this all goes down.

$SPY $SPX Trading Range for 1.30.24AMEX:SPY CBOE:SPX Trading Range for 1.30.24
All the levels discussed in tonight’s video
What a weird day… LOL

Continued bluffThe economy is “booming” yet unemployment and living costs have significantly risen. How long will the big 7 carry us until we see the turnaround into a bear market that has been in my sight since November 23’? It will reach for 430 levels within the next few months based on technical analysis. This retracement may take longer than a few months, depending on election factors that cannot be determined or factored into the equation at the moment. I am taking a bearish/consolidated outlook for the next few months as we cannot continue to ignore these highlighted historical indications. Enjoy the spike while it lasts, I intend to diversify into other foreign markets of sustainability at this time.

$SPY January 30 2024AMEX:SPY January 30 2024
15 Minutes
AMEX:SPY continues its uptrend with divergence. Broke the rectangle consolidation. 492.5 is crucial. There is divergence in the Elliott oscillator in all-time frames.
The expected pull back not happening.
The fact it is making HH and HL narrowly suggests it is a testing time for traders with rules-based entry exit.
My shorts have a stop loss at 493 levels.
So far the divergence traded does not seem to work.
I had a similar issue from June to July 2023 when SPY moved from 410 to 459 with divergence and pulled back to 433 levels quickly.
For the day holding 489.5 is important.
This has become one ego trade. At any cost, I will close today.

SPY 520 or bustWe are at the top of the bullish uptrend on SPY weekly. The only way is to go up or to face a correction. FOMC will be a factor as do rate cuts. Best to wait for the market to establish what it's going to do.

Expired SPY Weekly outlook. 4th WK JAN 2024 (JAN 22~26)Expired SPY Weekly outlook. 4th WK JAN 2024 (JAN 22~26)
> BULLISH 📈 CORRECT
Closed Price: 482.43
Target Price: 484.53
Upper Range: 491.20
Lower Range: 477.87

Active SPY Weekly outlook. 5th WK JAN 2024 (FREE SAMPLE)Active SPY Weekly outlook. (FREE SAMPLE)
5th WK JAN 2024
> BULLISH 📈
Closed Price: 487
Target Price: 490
Upper Range: 496
Lower Range: 483

$SPY $SPX $ES_F Trading Range for 1.29.24AMEX:SPY SP:SPX $ES_F Trading Range for 1.29.24
All the levels discussed in tonights video right here for you!! Tomorrow’s trading range looks fun.

$SPY January 29, 2024AMEX:SPY January 29, 2024
15 Minutes
SPY is continuing the sideways. At present the 9,21,50 and 100 averages have caught up with the price.
I am still holding the short position. Expecting the 200 to be touched and then a move. The 200 has moved from 475 to 482 last week.
The shorts are around 487 levels I am looking forward to closing around 484 levels with SL 489.5 close open bar. Not a great trade setup but something to keep me busy.
I am supported by Elliott oscillator divergence.
As seen in the chart SPY is hitting on top of box 488+ levels multiple times and is resisted.
At the moment I can see only a 2 to 3 $ move on either side depending on the breakout. And I am focusing on the short side.

Choose Your FighterWe're approaching not one, but two trendlines here. A rising wedge dating back to November 2023, and a trendline dating all the way back to October 2022.
New bull market incoming? A correction to the downside incoming? Time will tell. Hopefully this visual can be helpful to some.
Not financial advice, good luck to all :)

SPY SHORTThe market always does one of the two things, take out previous high/low, or seek to balance the imbalanced region . From this graph, the red dotted lines are previous years going back. As seen, the SPY went and took out last years all time high.
What we could see from now is price will intend to go further deep down to seek balance, now that it has taken out the high.
The fundamental aspect that will fuel this drive is next weeks federal meeting where we hope to see Powell increase the interest rate. This will start the chain reaction and set the trend for the course of the year. Subsequently, the DXY will look to rally and gain momentum from the delivery of the interest rates.
