SPY short trade setupWe have reached the top of the formation on the chart and is the area I have been looking at for retrace, so added a bit of short puts for a possible swing short next week.
SPY trade ideas

SPY 4hr updateWe broke through Zone 3 and the next wicked down to the previous supply zone (zone 3). I would consider this next candle as non confirmation to the upside due to the wick down. I would prefer to see a candle survive totally above the zone as confirmation. Full body with no wick would be A+. However a pull back is in store as we are over 70 on the rsi, but equally we are trading above the 13, 48, and 200 ema. Therefore my overall sentiment is bullish.

SPY Daily - Rising WedgeTreading lightly here as the SPY looks to be right at the end of a bearish rising wedge following a bearish ABCD Elliot Wave heading into a major week economically speaking. On Wednesday we have retail sales numbers, core CPI, and Core CPI YOY coming out, followed by jobless claims on Thursday. Will be watching closely, some support levels and RSI-based supply and demand zones to keep an eye on in the meantime, bearish and hedged- (Original Chart Attached Below)
- Rising Wedge following a bearish ABCD Elliot Wave
- Hidden Bearish Divergence on the RSI
- Sitting right on its 50-Day SMA
- Bearish ABCD Elliot Wave

SPY bearish outlookSPY (second red mark) looks like a repeat of the 1st one. Additionally the pitchfork lines also seem bearish.
Additional pitchfork lines also seem to confirm a bearish outlook:

When it comes to broadening wedges...AMEX:SPY Here we have a few broadening wedges. The last 2 were descending and SPY blasted off to new ath highs. Now were in a ascending wedge and sitting at 514. We have a few big name ERs that can put us back on the path to new aths but I think we are heading back to 480 by July based on the previous wedge behavior, and long support and resistance.

Spy may 6 Set up looks like it wants to fall/Puts. I think we would need a nice gap/push up Monday morning to fill another gap


Strategic Entry Points for SPY.SPDR S&P 500 ETF Trust (SPY) is showing signs of potential bullish momentum after a period of consolidation. Based on an in-depth examination of the technical indicators and recent price action, there are actionable insights that sophisticated traders might leverage.
The ETF has formed a notable (bullish engulfing pattern) on the daily chart, suggesting a strong reversal from the recent downtrend. This pattern, coupled with a break above the descending trendline, indicates increasing buying pressure. The ETF is currently testing a critical resistance level, and a decisive breakout above this point could confirm the continuation of the uptrend.
RSI (Relative Strength Index): The RSI is slightly above the mid-line at 55, suggesting a growing bullish momentum without being overbought.
MACD (Moving Average Convergence Divergence): The MACD line has crossed above the signal line and is trending upwards, which is traditionally seen as a bullish signal.
Volume: There has been a noticeable increase in volume accompanying recent bullish candles, indicating strong buyer interest.
Stochastic RSI: This oscillator is trending upwards but has not yet reached overbought levels, suggesting there is room for upward movement before the ETF becomes overextended.
SPY is currently positioned above several key moving averages, including the 10, 20, and 50-day MAs, which are now acting as support levels. This positioning underpins the bullish sentiment.
Support: The immediate support is found at the $506 level, with more robust support at $495, aligning with the 100-day moving average.
Resistance: Immediate resistance is observed around $518. Further resistance can be expected near the $530 level.
Long Position: Consider initiating a long position if SPY breaks and holds above the $518 resistance level. A successful hold would target a move towards the next resistance at $530. Set a stop loss just below the breakout level at $515 to mitigate risk.
Short Position: A short opportunity may arise if SPY fails to breach the $518 level and shows reversal patterns. In this scenario, a move back towards $506 could be targeted. Place a stop loss at $521 to limit potential losses.
If the bullish momentum continues with support from market fundamentals, SPY could potentially approach the $530 mark in the short term. A breach above this level could extend gains towards $540, guided by the momentum indicators and moving averages supporting upward movements.
The SPDR S&P 500 ETF Trust shows promising signs for both bullish and bearish traders, with defined levels for entry and exit based on current technical setups. Traders should closely monitor these levels, along with volume and price action, to align their strategies with the prevailing market conditions. As always, it is crucial to consider external market factors and news events that could impact market sentiment and price action.

SPY WEEKLY-MAY 6 2024Welcome to SPY weekly and I have clearly explained which levels to trade & what direction market can take.
If you have any questions feel free to DM
NOTE: AVOID TRADING SPY

Spy 4hr Major demand at the $500 level (zone 1). Pushed thru zone 2 now trading in zone 3. I expect some consolidation and a strong pullback to possibly back zone 2 before a continuation up to the upside.


SPY: Last week of AprilSeems like its going to be a short.
HA setup for a move to 500 inclusive of extended hours, with an equal bearish setup to 501 with extended hours toggled off.
Interestingly enough 500 is also PL2 on the prospective levels (in the chart above).
Sentiment for Monday is neutral to bearish. I have included some old tricks and models since this past week relying on one alone really gave me a run for my money haha.
Pinescript similar day analysis: Neutral (equal bullish and bearish days);
R Similar day analysis: Bearish
R Logistic Regression model: Bearish
R Z-Score Model: Bearish
So let's hope that its going to be bearish on Monday haha.
For the Week, half the models were unsure, the other half were questionable based on the cases. So let's leave it as neutral.
It doesn't matter too too much because there is a really nice HA setup which gives a TP of PL2 on the week. We also have a bearish reference target at around 507. Remember with those, we open above, we will generally circle back down and if we open below we will generally circle back up.
Let's hope SPY gives it up.
If we do snag these low targets, the question becomes, when do we reverse back up. The answer likely being at the low targets. Market is bullishly bearish with constant over-exaggerated bounces everywhere. You really can't do wrong longing unless you over-stay.
Those are my thoughts. Adopt a bullish bias if we end up snagging the reference target and holding it as support (because its right on the bearish condition). If that happens and we head back up, its looking like a bullish thesis is more correct.
Let's see what we get!

SPY Under Pressure! SELL!
My dear friends,
My technical analysis for SPY is below:
The market is trading on 511.28 pivot level.
Bias - Bearish
Technical Indicators: Both Super Trend & Pivot HL indicate a highly probable V continuation.
Target - 507.15
About Used Indicators:
A pivot point is a technical analysis indicator, or calculations, used to determine the overall trend of the market over different time frames.
———————————
WISH YOU ALL LUCK

SPY Trading Opportunity! SELL!
My dear subscribers,
This is my opinion on the SPY next move:
The instrument tests an important psychological level 508.23
Bias - Bearish
Technical Indicators: Supper Trend gives a precise Bearish signal, while Pivot Point HL predicts price changes and potential reversals in the market.
Target - 504.66
About Used Indicators:
On the subsequent day, trading above the pivot point is thought to indicate ongoing bullish sentiment, while trading below the pivot point indicates bearish sentiment.
———————————
WISH YOU ALL LUCK

Trading with RSI: The Bad, The Good and Even BetterIn this video I explain how to use RSI (Relative Strength Index) to make trading decisions. You'll learn how to properly use RSI oversold condition, combining low timeframe price action signals with high level context analysis.
Besides of explaining three different strategies (the bad, the good and even better) I'll do back-testing on historical data to demonstrate how those strategies translate into real trading results.
Disclaimer
I don't give trading or investing advice, just sharing my thoughts.

SPYjust idea for my self for spy , if broke will might go for 596 or 600 , other why we will see pull back around 476 and go up
that what i hop and i'm not sure :)
thank you for vist

$SPY daily trend breakoutAMEX:SPY has broken above the April trendline as it sits below monthly support/resistance levels.
Note : there is a new gap to fill below from fridays significant gap up at open.
Question : Can someone tell me if that is a bullish doji star?

SPY: Bears Will Push
The recent price action on the SPY pair was keeping me on the fence, however, my bias is slowly but surely changing into the bearish one and I think we will see the price go down.
❤️ Please, support our work with like & comment! ❤️

S&P bulls attempt to regain control but they are not there yetLast week, using oversold bounce, buyers attempted to regain control over the price. Their effort was somewhat successful, as they managed to establish both a higher low and a higher high on the daily chart. However, they failed to set a weekly low, which was a challenging task given the magnitude of the previous week's range. This indicates that bears still maintain control over the weekly (and monthly) timeframes, suggesting that we should expect to see more selling pressure in the short term.
The immediate objective for bulls is to test the price above last week's high ( 509.9 ) and to close the month within March's range. They must also protect the last higher low ( 497.5 ) or the last weekly low ( 495.5 ), or else their progress will be undone.
The short term outlook is mildly bearish.
Watch out for volatility on Wednesday as important economic data is released and FED announces decision over interest rate
Disclaimer
I don't give trading or investing advice, just sharing my thoughts.

risk profileyou can see risk profile change on bearish rotations of yields and the dollar with bottoming of bonds and market reacted as so today!

Level to watchWe are in the middle of a bulls rally. But still in bearish territory. The 510 level is going to be very intense to watch. If the bulls manage to break up and consolidates above 510 bears are dead. I'm not shorting anything yet. I'm just sitting and looking at my long positions.

Possible Wave E has ended this is the ALTThe chart posted is Low odds BUT must be looked at as the wave structure and the cycle s turn may 8th is nearing .I Am net long spy msft gld dia I have changed my positions and added this morning near the low in GLD I am also looking to buy BITCOIN I have target 56200 to 55900 but we may not get to it .

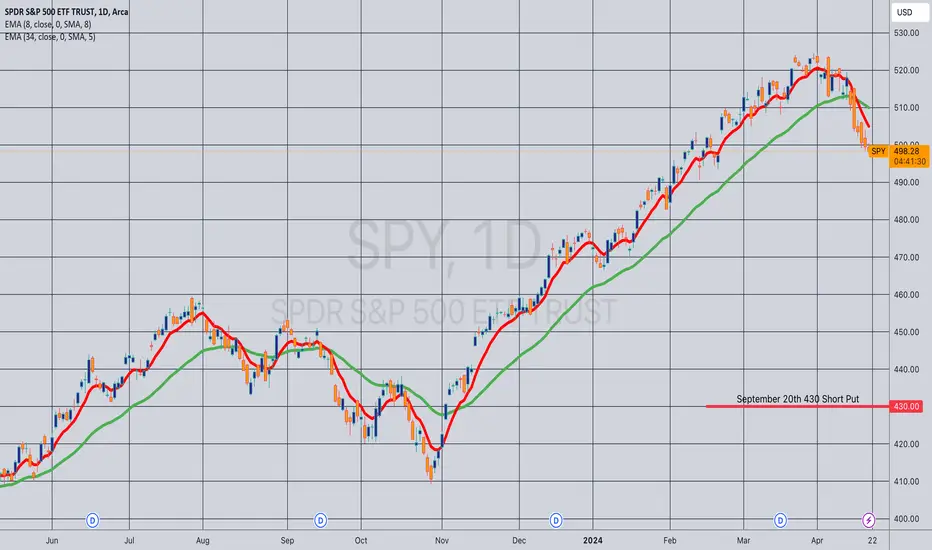
Opening (IRA): SPY September 20th 430 Short Put... for a 4.34 credit.
Comments: Targeting the <16 delta strike paying around 1% of the strike price in credit to emulate dollar cost averaging into S&P 500 ETF, adding at a strike better than what I currently have on.
As with my other broad market, will look to generally take profit at 50% max or -- if assigned -- sell call against at the strike price my short put was at.