$SPY Does it Need a Bigger Correction?I have zoomed out to larger timeframes on AMEX:SPY to come up with some larger / longer timeframes. Here is what I started with; the weekly chart (shown) then zoomed out to the Monthly Chart (not shown) to draw the February 2009 trendline. I came back to the weekly to find the March 2020 trend. I then looked that the latest run starting in October 2023. That trend line is almost parabolic and was unsustainable.
I am not making any prediction here, but it would be prudent to have a plan for a larger correction. I have horizontal lines near the top of the chart that were drawn using the daily chart and it is possible that one of them (or none) could be support areas. It is all to be determined. Keep an open mind. Corrections can happen in price or time or a combination of both.
I would like to point out that on any of the charts that I post I am only correct about 50% of the time. My posts are more about self-accountability than anything else. However, I do hope that you find some value in the technical aspect of the posts.
Thanks for looking.
SPY trade ideas

SPY My Opinion! BUY!
My dear friends,
My technical analysis for SPY is below:
The market is trading on 495.10 pivot level.
Bias - Bullish
Technical Indicators: Both Super Trend & Pivot HL indicate a highly probable Bullish continuation.
Target - 505.99
About Used Indicators:
A pivot point is a technical analysis indicator, or calculations, used to determine the overall trend of the market over different time frames.
———————————
WISH YOU ALL LUCK

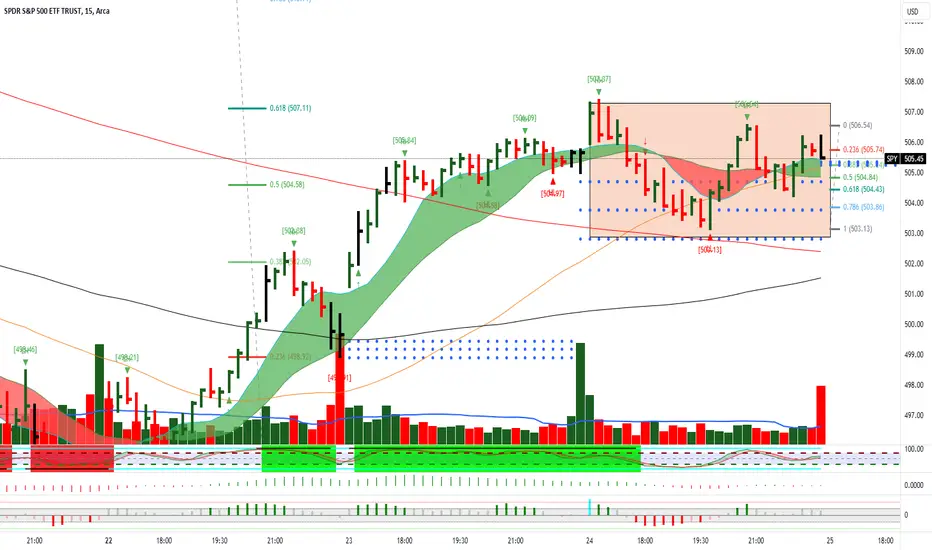
$SPY April 25, 2024AMEX:SPY April 25, 2024
15 Minutes.
As expected, AMEX:SPY managed to hold 502 levels.
Foe the day holding 504 levels I expect 507 to cross towards 510 levels as initial target.
If 504 is broken on downside I expect 501-502 as target. So, I feel not much worth shorting today.
Based on opening 15 minutes today should be a trending day one sided.
Moving averages have converged.
How ever I will go long only above 514-515 levels.
Ok, time to draw some pretty picturesWhy can't we just go higher from here? Everybody seems so negative -- and indeed I'm more neutral than bullish right now but $480 is just as possible as $530 and we really just have to wait out earnings season to see which way we get smacked first. I was bullish (then netflix happened) then bearish (then explosions over the weekend) then bullish (then people seem to be selling on any good news) so now bearish leaning again (in the short term). But the fact remains that there were rumors we were going to get another rate hike and so any rallying last thurs/fri faded downward, but though things haven't been great this week, I think it's fair to say most people aren't worried we'll get a rate hike in July anymore.
It's pretty terrible long term though -- we could actually succeed in a soft landing. But we could also crash. And equally likely but unknown until recently, we could just have stagflation for a while. Things are kind of weird right now and wall st seems nervous to get excited about anything. But I think for the common man, recession is off the table.
A lot of caution, please.

Early unconfirmed long position.In $SPYThe confluence at the lower lever and the 1 hour chart reacting at that level has me buy a very small low risk call option trade.

THIS IS A DUMB IDEASmall swing trade
(I am currently not trading futures, have in the past. Only due to my time zone - Market opens quite late for me like 1:30am).
*I am not in this trade but I think this is a likely outcome in this moment but it depends*
Purely fundamental

$SPY April 24, 2024AMEX:SPY April 24, 2024
15 Minutes.
SPY has managed to hold 493 levels.
50-day average in daily.
in 15 minutes forming HH HL pattern.
Moving averages are getting sorted out.
For the day holding 501-502 levels, for the rise 498.91 to 506.09 uptrend in intact.
So, on downside 500 is a crucial level to hold.
On upside resistance is around 509-510 levels as it is 61.8 retracement for the fall 519.47 to 493 levels.
As of now long only above 514-515 levels with target towards ATH.

$SPY trend retest into monthly resistance? AMEX:SPY 4 hr looking strong.
NASDAQ:MSFT , NASDAQ:GOOG , NASDAQ:GOOGL , NASDAQ:META all report this week (W-T)
Trend line converges with monthly resistance. We'll see.

SPY min upside 5150 and up to 5330 june 6thThe chart posted is that of the spy in which I posted back in March I have NOT changed the labeling as it was correct .We are at the end of wave A down and should see a rather sharp ABC rally back up to a min of 5150 and then a pullback followed by the last wave up I do think it can reach as high as 5330 this is the alt to my 5261. We are now one of the most over sold in a few years . Best of trades WAVETIMER

502.20 Put back to 292$Put at the top. Looking for a drawback down to 492$ support for continued Downtrend.


4/22 Weekly Index Outlook - JournalTraders,
Given:
SPX (SPY) is used as overall market index.
FED remains the primary determinant for overall market movement.
All major indices pulled back last week.
SPY failed to reach its 100DMA in the pull back.
QQQ overshot its 100DMA in the pull back.
GDP reports Thursday Pre Market.
PCE, Personal Income & Spending reports Friday Pre Market.
Iran / Israel situation has cooled
US Govt approves add'l Iranian Oil sanctions.
Noteworthy:
QQQ down ~8% peak-to-trough (P2T)
SPY down ~6% P2T
Expectations:
Earnings based movement for individual stocks.
Indices range Up / Down towards respective 100DMA pending additional insights into potential fed behaviors in June.
Instrument:
NA

LONG SPY 505 then SHORT 511Good Morning Grazers,
Little birdie is showing close to 20m puts expiring on Friday April 26th with strike 510 , by the same token the biggest $ on puts is 490. In addition there is some heavy concentration of both at level 505 which may be a 'hot' level this week so be mindful entering S or L at that level.
If you consider Friday the ERL of SPY we are heading for 510 which is curiously the 50% retrace.
We may get some tailwinds from earnings that will without a doubt solidify strong performance as Q1's are generally pleasant in the grand scheme of yearly cycle, re-openings and new launches of campaigns etc etc.
I foresee the gapper being filled to the upside so ride the wave high and then drop it like its hot at 511 just ensure your own conviction of when to take the short as to not take it prematurely.
Happy Grazing,

SPY BUY $492 ADD 488!SPY is getting oversold on the 4hour and 1 day charts, we are almost at the bottom of cloud support and Fibonacci support bounce targets are $511 and $517 before resuming downtrend.

$SPY rising wedge breakdown and gap fill Love it when a plan comes together.
Watching 492 this week as it is the 21ema on the weekly chart. Need to see where the weekly candle closes on Friday. A close below hints at more downward momentum. A close above would take confidence away from the bears as we head into May and await fed data.

S&P 500 ($SPY) Outlook Levels - 4/22-4/26Keep an eye on 493.50 tis week as that was an important support. If it gives then I would image some love for buyers will be found around that demand volume shelf in the high 480s.
If no love is found there then the 470s demand zone will likely be the target for now.

SpyI want to start off With DJI, NYA, IWM, XLF, And XLV. Those indexes and sectors are more cylicals and they led the slide this week.
DJI (Dow jones)
37,800 is previous resistance of the bullflag.. 37,800 will now be support. I think we dead cat here before eventually sliding to 37,000.
37,000 is crucial for bulls to hold, its the previous ATH set from 2021.. if we fall back below 37,000 that would mean that the breakout was a fake out and bulls are in trouble.
Already you Can see XLF and XLV have both pulled back inside previous ATH which is bearish
XLF
XLV
And more important than the Dow is NYA or NYSE.
Fell out of rising wedge last week and is also heading for the retest of previous ATH
The Fact that the sectors have rejected New ATH doesnt bode well for DJI amd NYA.
I think we will test those previous ATH late this week so that will spell a 2% drop from last weeks close.
But first! Look at your daily chart for NYA,XLF,XLV and DJI , now Place your bollingerbands on your chart; You see how extended it is? For this reason i think we will see a nuce dead cat bounce starting mid monday going into tuesday. The bounce should be finish by Wednesday!
QQQ
Daily chart.
Tested 50sma 6 straight times last week! This week im expecting a break of its 50.
I think we will trade between 436-442 unti TSM and NFLX earnings mid week.
Unlike Dow and NYA tech does have the oversold technicals that would make it a good dip buy. I like aapl to close gap at 179 this week and i think Amzn will retest 189 again but overall looks like it will be another mix week for tech .
My mid and long term target for QQQ are 425 and 407 which is previous ATH from 2021.
Im not shooting from the hip with my 407 target . The pattern is an ascending broadening wedge. The measured move goes like so
If you googl "Ascending broadening wedge" you'll see what i mean.
So yeah, 425 then finally 407, but first we have to break 433.
Spy
Qqq 425 and spy 497 are connected!
If the trend of retesting ATH breakout is true then that means Spy will most likely close gap at 482 when qqq goes for 407.. i dont think 482 would come in April but the move would make sense for a sell in may and go away.
As you know by now the last 6months of trading has been a major cup and handle move across indexes and sectors. Do you know what happens when the cup and handle is completed? I've traded Cup and handles before and let me tell you there is always a pullback or correction once pattern is completed; I think that is what is happening here.
Vix
So i usually like to use my indicators together to paint me a picture.. I dont like it when im bearish and the Vix looks like its about to dump . Looking at the Vix daily bollingerband, CCI and trendline tells me that the VIX will be pulling unless middle east war makes it go parabolic.. So i mentioned that its outside its Bbands, its also at 2yr trendline resistance and the daily CCI is too overextended.
Heres the vix with my CCI. I circled the last 2 times the CCI and vix got this high for reference and you can see that within a week or so a bearish reversal took place.
Going into to next week i expect spy to make a move back to 516 gap resistance before heading down to back to 50sma which would most likely move up to 510 by mid week.
Any break of 510 and 505 is next up. If spy pushes above 516 then 520 is next
As always, lets see what happens.. I'll do the tech sectors mid week... Hope you appreciate all this damn typing, my fingers hurts 😆

$SPY April 21, 2024AMEX:SPY April 21, 2024
15 Minutes.
As expected the downtrend continues.
Two issues.
It is coming to the lower parallel channel in the move.
And oscillator divergence.
I expect a retrace to 498-500 levels.
As I believe once 492-490 levels broke I will have a target of 495 which is 32% retracement for the larger move 409 to 524.
409 I have taken because for the trend change for this uptrend happened from the 348 low.
And in that move for the rise 348 to 459 AMEX:SPY retraced to 409 levels. From that low it went to 524 levels.
Hence I consider the large move from 409 to 524, 480 as a number to watch.

SPY Weekly/Monthly UpdateRecap:
SPY is currently in a corrective wave using price action on the higher timeframe. Corrective waves are completed after 3 legs (A, B, and C) … Each wave has 5, 3, and 5 legs per wave respectively. A (5 legs), B (3 legs), and C (3 legs). There are other specifics but I will not go into detail.
For now we are operating within wave A, soon to be wave B which is a correction within a corrective wave. lol once I will not go into.
The key price points throughout the entire correction are 492.69, 480.22, 466.84, and 453.45. The golden zone is between 453.45 and 466.84. Anything below that ....... yikes
The previous week on SPY closed near the first key price point (492.69). Price is also sitting at oversold levels in confluence with lots of demand. This week also signaled a break below the previous month’s low, a first since Sep 2023.
Trade Idea 1:
As long as price doesn’t capitulate to the downside, going into next week I expect price to begin setting up to make a push higher from this demand area with a target to the previous month’s low week. I am also watching for some form of price consolidation between 493.55 and 506.53 until price convincingly breaks either level, preferably 493.55.
In addition to looking to trade the retracement move to the upside, I would like for price to push below 493.55 briefly then reclaim the level the breaking above the lower time frame downtrend before playing the move upward.
Trade Idea 2:
If price does maintain the current downtrend and continue down I will look for a sell entry below 493.55 and 490 to target the next major level below.

Spy possible move on monday.Like shown on the chart. Spy can continue downtrend in 4 ways. Since rsi is oversold. Just be patient and wait for price action on each level. Whenever spy reaches those level on higher timeframe switch to 5 mins timeframe and wait for price to atleast break nearest demand zone for downtrend continuation.

SPY: Free Trading Signal
SPY
- Classic bullish formation
- Our team expects pullback
SUGGESTED TRADE:
Swing Trade
Long SPY
Entry - 495.10
Sl - 489.28
Tp - 504.96
Our Risk - 1%
Start protection of your profits from lower levels
❤️ Please, support our work with like & comment! ❤️

SPY=>Anyone buying the dip? 😆The bloodbath has started 🧛🩸
The bears are in full control and the buy the dippers crowd is getting hurt.
Are the last remaining bulls waiting for the next rally to sell?
Are you buying the dip?
Or are you selling the rally?

spy
My Nasdaq 3M view #spy #stockmarkets #StockMarket #stockMarket #trade #trader #technicalanalysis AMEX:SPY NYSE:ES #es1
