UVXY trade ideas

LONG UVXY UVXY short term long position, probably in and out in a day or two. entry ~10.73, take profit at MA ~ 11.8. This could be a day trade. Cheers.

short term long AGQForgot to share this. I was really busy yesterday. Gold/Silver short-term bottomed and bounced back. take profit on MA 43.5 and 44.5 hopefully. Stop-loss is shown on the graph. very likely silver will test yesterday's low one more time before the new bull cycle begins in late December.


VIX / SPY - Current Crash CoursesI see a formation that appear before each run up in the VIX.
I have highlighted it in pink.
Each of these other historical traces match the pink pattern (close up shot of it below), and are roughly scaled to that pattern. Maybe it will be a tell-tale as to the fate of the VIX and the SP500.

UVXY: PHASE 2...no indicators this time around
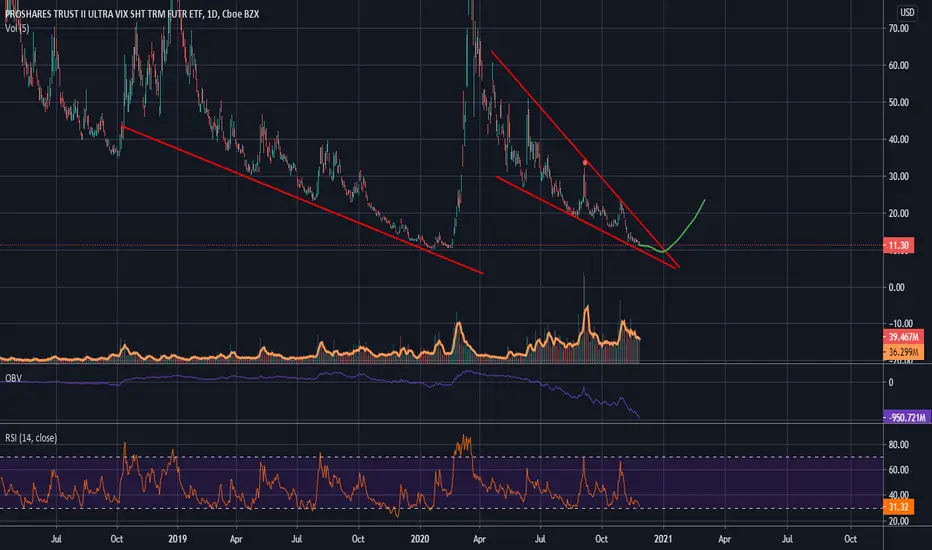
in fibonacci we trust
almost a perfect touch.....
almost
(:
trust the lines
GL!

still bagholding some UVXYExpecting to average down somewhere between 8 and 10 dollars may be higher. The stock market is very greedy right now. Everyone seems to have come back to some kind of new normal even though there are still so many red flags. Looks very sketchy and will definitely keep a solid UVXY hedge here
VIX - Turbulence ahead.A sell off on the S&P is expected sometime... as is the volatility that will rise with it.
Heres what it would look like if that process was underway now.
Good Luck!

$UVXY - NR Picks Nov 22Este índice busca ofrecer exposición a la volatilidad del mercado a través de los mercados de futuros que cotizan en bolsa y está diseñado para medir la volatilidad implícita del S&P 500 durante 30 días en el futuro. La tesis se sustenta en que podríamos observar algo de volatilidad para los últimos días de noviembre y consideramos que podría darse un impulso hasta los 15, manteniendo el canal de retroceso observado durante los últimos meses. Recordemos que los índices $SPY, $QQQ, $IWM, $DIA están muy cerca de sus ATH.

UVXY - Nearing all time Low'sBased on Chart. If Melt up continues I Predict 20% more downside for UVXY - with a SPX move down to Around 3200 should yield 80 - 120 % Return. Thinking about placing a 33,000 $ buy Monday. What are your thoughts

UVXY Cup and Handle Pattern FormedBased on if/when it breaks to the upside, the distance from the bottom of the cup to the breakout will determine how high it rises above the breakout.

Why I took all my money and put it in UVXY and HTZYeah, that's right. Brrrring it.
Well, the thing is, that I am not rich. But, I think I understand charts quite well.
I have been eying this one for a while. I even had written the buy zone.
Knowing my impatient self, I bought it earlier once. The second time around, the price plunged into the zone I was supposed to buy at.
Patience in trading is very important.
Lesson learned, I suppose? But FOMO is irresistible, I know.
I don't like gambling either. This bet seems like gambling but it's not. I am up right now, with an entry of 12.11.
ENTRY: 12.11
EXIT: 17.30 - December 2, 2020
Oh and HTZ? Yeah, of course, that's a quick little roulette gamble, that I am sure will pay off nicely too.
Anyway, I got a book coming out, assuming that my prediction is right or not called "Homeless in Africa," make sure to check it out.
For those more conservative to this idea, anything significant below the yellow line is a great exit point.
If you made money from this tip, hats off, that means I did too! Please tip the man with the idea. (I got many more don't worry.)

VIX - 2 scenarios I seehere are two forecasts for the vix.
Will the S&P stabilize for a bit, or continue selling off today?
I feel that these curves need to stretch out a bit more before the next big wave.... but then again, maybe more investors are getting fearful and starting to sell... that fear can really accelerate things - which just compresses these fractals.

[UVXY] End of 9M FW for UVXY... Let's See What HAPPENS B)OH man... lookin' out for some fireworks!
RSI charging toward new peak. VPT RSI still at the floor and bout to X spike signal.


UVXY: 'THE LOAD ZONE-PHASE 1'I'm still holding from my original pos.
adding a little every time below 13, once below 12: the 'load zone' enters phase 2 hahahah
meaning each entry will be about 25% bigger than previous
anytime (if we can get lucky enough) uvxy enters a sub 10$ range: phase 3 commences and I'm basically loading everything i own into a basket of long vol, some fixed equity (still think negative rates coming soon), and some hand picked div yielding consumer defensive stocks
I'm just liquidating some profits from the dip buys a week or two back to fund long vol pos right now
once again in no hurry to exit long positions until confirmation of a downtrend
I could see spy going to 372 380ish easy by EOY
china's new deal is NOT bullish for U.S. equities long run however.. not even a little bit
Once 'everyone' stops talking about an election, and 'everyone' starts talking about the U.S. economy again:
I'm almost certain that'll be when a long term secular trend will be put in
I'm officially a black swan trader....
GL!

UVXY support analysisRed lines are "recovered" support areas. Support is either a sideways consolidation of several days, or a local minimum. Next to each support line, there is a 3-tuple, whose indices have the meaning:
1. % loss (log return) from support to subsequent minimum
2. days until subsequent minimum
3. days until support was recovered, or touched, giving the buyer a chance to get out
Purple lines are "unrecovered support", meaning, support levels (i.e. sideways consolidations of several days or local minimums) that have not been subsequently touched.
The calculation is manual, not particularly rigorous, and incomplete. I will be updating the analysis.


VIX up to 19.9 with a 30% Gain?On the 4 hr chart you can clearly see we bottomed around 12.
Divergence clearly bottomed.
Stoch RSI bottomed and has made the turn up.
We're at the bottom of a descending channel with a clear volume resistance at 19.9
My Move:
Entry: 14.00 (or less depending on the 5 minute chart tomorrow)
Stop loss at: 12.73
Sell 1/3: 16.68 (change Stop loss to 4% trailing stop at this point)
Sell 1/3: 19.9 (change trailing stop to 2% at this point)
Target: 21.57 (top of channel)
Profit: 52.2% averaged
Risk/Reward: 1:5.73
As always, I don't ever recommend anyone trade UVXY unless you're ok losing a LOT of money.

11/09/2020 UVXY - update Hi All,
Tomorrow will be a very interesting market. We got strong hammer candle on VIX/full bearish red candle on the SPY.
The interpretation of the two candlesticks is simple. A lot of buying activity is happened on UVXY price around 12, thanks to @jgm0706 who called $12 as a bottom months ago.
On the other side, SPY, we have a full red candle without a wick at an all-time high. This can be perceived as longs started to realize their gains/buyers exhausted their momentum. Due to the huge red candle, I'm expecting inside green bar tomorrow, or Harami pattern, which would give confirmation that probability of S&P500 heading to the south is higher.
Candle formation on UVXY/SPY tomorrow will decide market trend for at least a week.

UVXY: INVESTINGinvesting.
little to no downside, to lower it goes to more I buy.
This is the definition of an anti bubble; and in the long run.. the odds are no doubt, in my favor.
MMT might just cross the 'point of no return' in the next year or two.
I was bullish on my last post on the equity market but after the recent run up in equities, I have completely changed my view point...
We might not even be close to a 'top' though, I am in no hurry to liquidate my long positions by no means whatsoever.. playing it on a day to day basis.
GL! and welcome to the casino!

[UVXY] 8M Falling Wedge Conclusion x 13th... The GREAT Spike! B)If it's gonna happen, it's gonna start happening this week.
We had a false breakout of this massive Bullish structure and rapid retrace, like a tide going out before the tsunami. This swing dip and spike Price action phenomenon is quite consistent.
Based on my other UVXY work, I'd peg low of this dip to $12.50 and first TP would be $20-$25:
Gonna let the bottom find itself and hop on as we break this structure.
We got RSI 1D uptrend and potential bottom here and VPT RSI 2H spike indicator cross this week.
