UVXY trade ideas

$UVXY 24 hours max! in and out 👁🗨*This is not financial advice, so trade at your own risks*
*My team digs deep and finds stocks that are expected to perform well based off multiple confluences*
*Experienced traders understand the uphill battle in timing the market, so instead my team focuses mainly on risk management
My team purchased shares of Inverse ETF $UVXY this afternoon. This set-up will challenge our 1-hour chart abilities.
Our first take profit is set at $18. Our take profit 2 at $20 may or may not get hit. We have also set an automatic stop-loss at $14.25.
ENTRY: $15.50
TAKE PROFIT 1: $18
TAKE PROFIT 2: $20
STOP LOSS: $14.25
If you want to see more, please like and follow us @SimplyShowMeTheMoney

UVXY Being Held Down By The 200 Day Simple Moving AverageWe have a Potential Bearish Dragon on the UVXY as it shows weakness near the 200 Day Moving Average if we can get some Follow-Through and Break down through the Dragon Trigger Line we can see it go back down to the levels of $12-$10


vix still getting waveshigh 19s are due if we can hold above high 18s. were headed for that same resistance and if we break the quad top it will close the gap at 20.05 . short targets are lower horizontals if we cant hold high 18s and the middle line is what i think would be a good pivot. TRAMA is flatlining, and VWMA is wobbly but if we start to see red crossing above blue and trending up together i would look to the upside. 21 still possible, though as is mid 16s. the daily bounce hasnt happened in semiconductors, big tech or spx.

Convergence of Price and Long and Short term 0 FibWe are in the home stretch of some sort of major event. I believe this is the clock to watch. When the price and those 0 Fibs marry it is game on. My guess is before July 18th, 2022. The birth pangs are already happening. Good luck. Not advice just observations from the belief that there are no coincidences.

TRAMA over VWMA and Stoch headed to overbought for this vix deriuvxy has seen a lot of choppy action for weeks but the trend has been upward. if we keep seeing TRAMA and VWMA rise together on the daily and double stochastics
signal remains bullish we should end the week higher as long as spy stays under 400
holding mid 18s uvxy would indicate were due for a trip back up to high 19s

island top or taking offif we hold the 18.50s and break upper 19s retracement will be good enough and well be over rising vwma and trama if we reject 19.75 and close below a significant low on the 5 minute then stiff overhead resistance means were in for low 18s. if we see that close into the upper 19s were headed over 21

UVXY SHORT 4H Short StrategyBacktesting results of shorting UVXY on a 4H chart using a combination of bollinger bands and ema trend candles.

still in the pop, or back to the doldrums?its clear that uvxy has stiff overgead resistance, but if that breaks we could see over $21 soon. prove the bear case and its moreso back to $16.

Keep an eye for the VIXUVXY shown here is an ETF of the VIX and it is leveraged, which means its dip under the current trend is insignificant and mostly due to beta slippage. The VIX itself is still trending up and volatility is increasing at an alarming rate. Buyers beware, the winds are changing in the bear's favor and a deepened correction in the major indexes is HIGHLY likely

volatility is picking up (UVXY)we are coming off the first weekly higher low at all time lows since the corona bounce. we havent had a major weekly bounce since then. id imagine if we do close this week somewhat lower, and trend down into next week its likely to send uvxy over 21. if SPX continues its daily bounce next week id imagine were headed back to all time lows UVXY 13 or less.

Timing UVXY PutsSo here we have an example of trading UVXY with ema-candles and volume-based opacity.
See linked Ideas for more information.

$UVXY buying the dip 👁🗨*This is not financial advice, so trade at your own risks*
*My team digs deep and finds stocks that are expected to perform well based off multiple confluences*
*Experienced traders understand the uphill battle in timing the market, so instead my team focuses mainly on risk management
Recap: Bitcoin and the US markets are losing steam after rallying for the majority of the month of March. We entered $UVXY on 3/25/22 at $14.25 per share. Our take profit was set at $18.
My team has decided to average down on $UVXY at $11.75 per share which now brings our share average to $13. We have also added a 2nd take profit at $21.
SHARE AVERAGE: $13
TAKE PROFIT 1: $18
TAKE PROFIT 2: $21
If you want to see more, please like and follow us @SimplyShowMeTheMoney

Volatility RisingGesundheit, Everyone!
… that sounded fun this morning :)
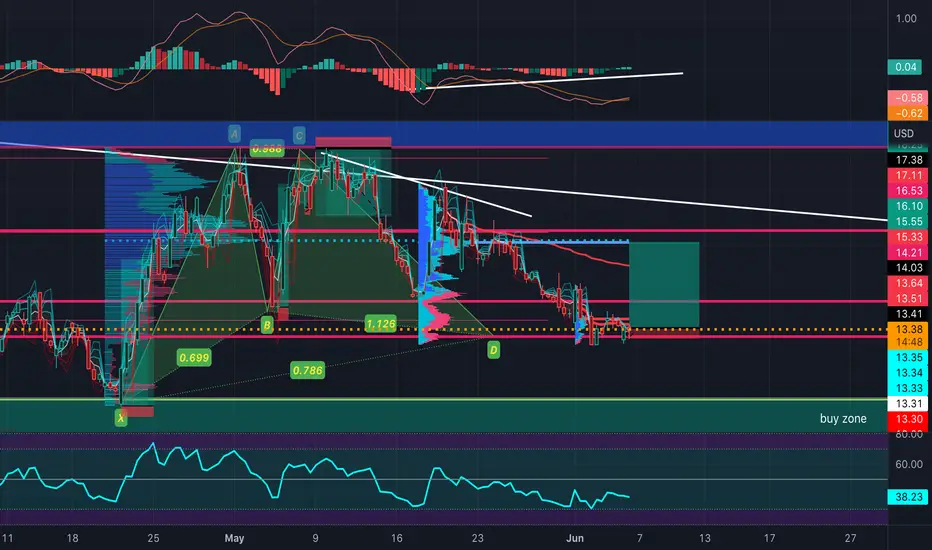
This most recent harmonic pattern in red, correlates to wave counts and indicators on the chart for our current position.
It is overplayed, and scaled and stretched (just a nudge) to better fit our current support (solid) and resistance (dotted) levels, and the most recent major movements (overlap area).
Whats this mean? Well, it is an inverse derivative of the SP500. It represents the spread between the 30 day future contract buys & sells. It goes up when the market makes big moves… and since we are pretty maxed out and rolling over the top, with a nice progressive increase in the VIX here, i would assume that means things are about to get real, as the market start cascading down the historic levels, that never got checked, due to inflationary practices, like stimulus money, and the the ponzu scheme o the federal reserve and central banks.
Karma will balance everything in the end. Here goes the balance of greed fueled capitalism! It’s gonna be a wild ride :)
Good luck, God Speed, Love & Light To All!


UVXY Doji 1H Strategy with both Long & Short PositionsAgain, I'm posting this mostly as an observation. (Inexperienced traders should note that UVXY only goes up during major crashes so, although this is marked as a "long", holding any bullish positions on UVXY is a short-hedge on your portfolio.)
Based on backtests, it appears that longing UVXY on Doji's are a fairly reliable candlestick pattern to trade on UVXY's 1 Hour charts...
Also, it appears that shorting UVXY on Hanging Man and closing the short on EngulfingBullish dramatically increases the profitability

UVXY Doji 1H Strategy I'm posting this mostly as an observation.
Based on backtests, it appears that Doji's are a fairly reliable candlestick pattern to trade on UVXY's 1 Hour charts...
Inexperienced traders should note that UVXY only goes up during major crashes so, although this is marked as a "long", holding any bullish positions on UVXY is a short-hedge on your portfolio.


looks like were forming a lower high (uvxy)the 15 minute seems like price want to fall back into the vwap channel and go for a touch of vwma

UVXY Monitor MA 50/100 Monday will be very important to see how UVXY responds. IF S/R flip occurs above the bullish side of the MA 50/100 then the market will continue to decline. IF resistance rejects UVXY Monday then we should expect gains and a return to the market. This is the first time for the MA 50/100 cross to become bullish since COVID dump, but it is a weak cross indicating that it could fall back down.
Notice the daily closed above the BB, this normally indicates a temporary high and will stall out to regain within the bands.
Watch for head and shoulders to form as well if there is a break higher.
Stocks have been pricing in MAY rate hike all week.
Let's see where this goes, Good Luck.
