XLY trade ideas


Short XLY (Long term 1 year)Long term trade here. Consumer spending in the US not likely to return. Higher borrowing costs with house hold debt near all time highs is not doing anyone any good.


XLY: A technical overview of top 3 weighted holdingsSummary: Comcast and Home Depot dragging down price. Amazon is keeping it from falling further


XLY/XLP Ratio - Murphy2009 Cross -> bullish (like Murphy described in his book)
2016 Cross -> bearish?

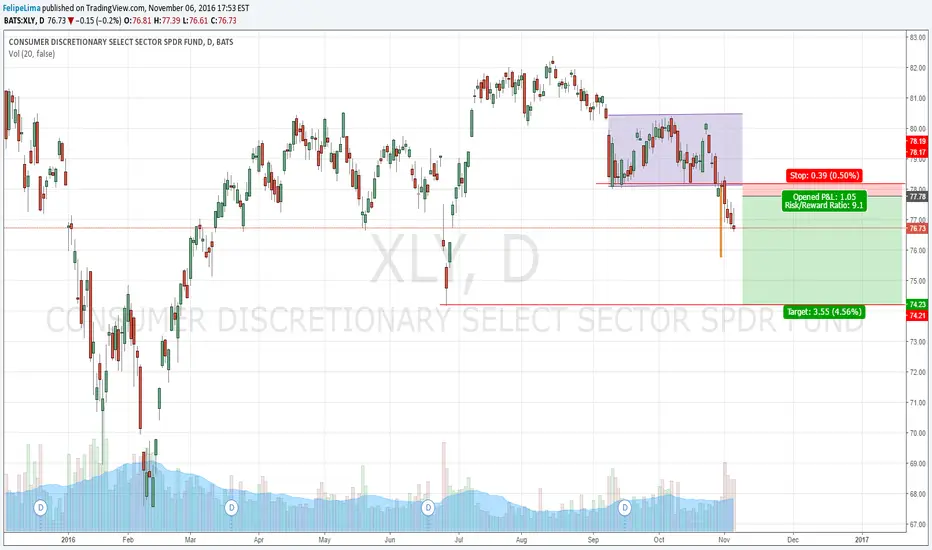
Testing strong daily resistance zone$XLY just hit a strong daily resistance zone after bouncing from the 200 days MA.
The Resistance Zone includes several trend lines that now collide into one 1$ wide Price Zone that should prevent $XLY from advancing higher.
79-80$ is the potential Sell Zone
Stop loss should be above 82$ and first target Zone is 77$ (200 days MA)
Below 77$, things can turn into a Free Fall mode.
Tomer, The MarketZone
Follow me on TradingView
Subscribe to my newsletters - goo.gl
Follow my blog - goo.gl
Subscribe to my Youtube channel - goo.gl

XLYWeekly chart of XLY since 2009 bottom. Looks to be forming possible H&S top with RSI bearishly diverging. May not confirm H&S, but not one to be long, IMO.
Also, note numerous high volume DOWN days with very few high volume UP days. (See box in lower right hand corner)

XLY going downWhen signs of an economic recovery appear, consumer discretionary stocks usually lead a stock market recovery. Consumer discretionary stocks tend to outperform the stock market during strong economies, but they generally underperform in weak economies. The stocks of of consumer discretionary companies tend to lead a general stock market decline at the beginning of a recession.

Staples seems getting strong again, against cyclicalAs you can see there is a Heand & Shoulders going on, and under the WMA 200
Is the rally near to end?


xly/spy enough is enough ?this one streched it self . . . very strong !!!
does trees grow up to the sky ?
neiher will stocks.

Neg. Weekly RSI divergence on the XLYLooking for a potential short in the XLY, as its main components AMZN, DIS, getting hit. AMZN showed a negative RSI divergence on the daily chart, the first time in a long long while. Probably won't initiate position until AMZN and DIS, NKE recovers a little.

Bounce expectedmany sectors at major support, unlikely that they dont hold. Should see a bounce in the market here after such a rapid sell off.

What would happen when XLY/XLP low is taken out?A brief recap:
XLY is consumer discretionary sector = investor shift to luxury but not necessary things = risk appetite increase
XLP is consumer staples sector = investor shift to more basic needs = risk appetite decrease (more security)
As a recent spat of rally, i have noticed that there is a sector rotation play into XLP. As a result, the ratio XLY/XLP is getting slightly smaller.
As observed from the previous two market top in 2008 and 2011, when the XLY/XLP major low (blue) was taken out on the downside, SPX (a representative of DJIA, DJTA, RUT & COMP) had either a major crash or correction.
XLY/XLP made another low back in Mid Oct 2014. Could the same scenario happen to SPX again if the red line crosses below the Mid Oct 2014 low?
P.S. Excluding 2011, when SPX kept on making higher high, XLY/XLP was making higher low. A divergence in the warning.

MACRO VIEW: XLY IN FIRM MACRO UPTRENDConsumer Discretionary SPDR ETF is looking good on both short term and long term basis.
On long term basis - XLY trades in both 5 and 10 year uptrend, as the price stands firmly above 1st upper standard deviations from both 5 and 10 year means It has tested its 5-year trend during the august selloff and held it successfully.
On short term basis - XLY shows no trends in particular, as the price is firmly within the 1st standard deviations from 1-year and quarterly means. It is a positive development, since nothing on short term basis stands in the way of long term trends.

XLY at important Fibonacci resistanceImpoirtant mulitple resistances of Fibonacci projections, time to sell and/or short XLY.

XLY $76.08: Consolidates within a 6-week rangeXLY has been consolidating within a 6-week range between the 77.13 YTD peak (March 23, 2015) and 74.23/24 (March 11/26, lows). While the 74.99 support (April 17, 2015 low) holds dips, further gains above 76.14 (10 day moving average) would open the 76.83 resistance (April 13, 2015) ahead of 77.13. However, a break below 74.99 would prolong the consolidation and retest the 74.23/24 range support area.
Outlook:
Short term: neutral
Long term: bullish


Confidence Ratio Going DownA great indicator to determine the confidence (ie. risk appetite) of investors/speculators is the XLY/XLP ratio. XLY is the ETF for consumer discretionary stocks whereas XLP is the ETF for constumer staples stocks. In times of confidence, XLY should perform better than XLP because there is belief that the economy is doing well and that people will spend cash on things that are not absolutely necessary.
The ratio has been tracking US equities indexes fairly well over the last years, but now we see major divergence. XLY/XLP is moving down and from a technical analysis standpoint it does not look like it is about to go rise back anytime soon.
Yet, at the same time, the S&P 500 has been hitting all-time highs. This performance seems like it is not supported by risk appetite - which it should!
So what should you do from here? Short this ratio? Short the S&P? That is all up to you. This is just another factor from a long list that supports the thesis that equities are overextended.
Good luck trading.

Consumer Discrete Select Sector SPDR Strong Trend may not lastThis is more of educational than opening trade, but if u want to you can do so. One of the few things that may make you believe recent rebound a possible new all time high as Nasdaq Composit did and probably SPX and DJI may also follow is the ability of the Consumer Discretionary SPDR (XLY) to hit a new high this week or today. The StochRSI is suggesting that we may be close to the peak than breakout upside although we have taken out both March high and July high and printed new high for this year, hard to go against the trend that seems only getting stronger. There is a good chance that 1.27 or at 68.62 being strong resistance, if this broken expect the price to face a real and stiff overhead resistance at and around 69.57 which is where one should get his/her gun read to trigger long waited short entry. If you like it follow us more to come.
