gas get ready for big wave 3 !!!winter is coming ...
gas wave 3 is coming ...
According to the analysis of Elliott waves, the gas is at the end of the correction waves of its second wave, and soon the third big gas wave will begin.
GX1! trade ideas

natural gas with 99-01 years superpositionNatural gas has formed structure alike his own model 99-01 years.
So i added it with the slightly different time offset.
Also we gain big cycle end and the minimum(which in 1.8-2.1 range) by the march-may of 2023 (started in February 16).
Maybe i'll add in comments big picture with the cycles overview as i see it.

✅NATGAS SWING SHORT🔥
✅NATGAS violated the rising support recently
And went down just as I predicted
In my previous analysis but the price
Went up in a bullish correction
To retest the resistance from where
We are already seeing a bearish reaction
So a bearish continuation is to be expected
SHORT🔥
✅Like and subscribe to never miss a new idea!✅

Oct 27,22-NG Winner AGAIN-700 pt profitThis week is a good week!! Last night I closed out my 5.5 Buy Order for another 700 point profit (officially 695 point profit) to close at 6.2 (officially 6.195).
Next up is my Buy Order at 6 which currently is in profit territory. The storage report is today so we shall see what happens. I might get out of my position with a small profit. Not sure. Then there is still my Buy Order at 7, where I was a little early (ok a LOT early) with my bullish prediction.
Should be an interesting finish to this year. Stay safe all and trade smart.
Heiko

Oct 26,22-NG Winner-700 points profit!NICE - So I just closed out my Buy Order from 5 and closed it out at 5.7 for a nice 700 point profit!!
Now I'll wait till price action rises into the 6's to close out my 5.5 Buy Order.
Congrats to all who followed my hunches :-) Enjoy your profits!
Stay Safe all.
Heiko

NATGAS Risky Short! Sell!
Hello,Traders!
NATGAS is retesting a broken horizontal level
So I am bearish biased
And I think that we are likely
To see a move down
Sell!
Like, comment and subscribe to boost your trading!
See other ideas below too!

Oct 26,22-NG-Nice Profits from yesterdays rallyMy Buy Order at 5 is in decent profits today after yesterdays bullish run. Price action sits around my next Buy Order at 5.5 today.
I will continue to monitor price action as there will be ups and down from now till Feb. I will close my Buy Orders at 700-800 point profits along the way to lock in my profits.
Stay safe.
Heiko

BUY NGRecently, the price of natural gas has been under pressure due to measures to reduce consumption and prices in Europe ahead of winter. Officials expect another supply crunch due to restricted access to Russian pipelines and a possible jump in demand for heating goods. Today, the price of natural gas NATGAS / USD is stable between the level of $5.81 and the level of $6.03 per million British thermal units. On another note. An inventory report from the US Department of Energy can determine if the floor can hold or not. Analysts expect a smaller increase in inventories of 103 billion cubic feet compared to the previous increase of 125 billion cubic feet, indicating an increase in purchases.
LNG exports to other countries and storage activity leading to colder months may be responsible for the slowdown in the increase in storage. However, a larger-than-expected increase could mean more downside for natural gas as this may indicate that demand remains weak.
On the gas crisis front following the ongoing Russo-Ukrainian war:
German Chancellor Olaf Scholz has warned that a proposal to cap gas prices at the EU level could backfire as the region seeks to offset significant supply cuts from Russia. “Price capping always involves the risk that producers will sell their gas elsewhere – and we Europeans will end up having less gas instead of more,” Schulz said Thursday in a speech to the German parliament in Berlin.
The German chancellor was speaking ahead of a two-day summit of European Union leaders in Brussels. The bloc's member states will discuss ways to keep energy prices under control and ensure security of supplies, as well as the recent situation in Russia's war in Ukraine. Rather than setting a price cap, Schulze supported the idea of cooperating closely with buyers such as Japan and South Korea to avoid competition for limited supplies, while also attracting like-minded producers. "I am convinced that countries like the United States, Canada or Norway, who stand with us in solidarity with Ukraine, have an interest that energy in Europe will not become too expensive," he said.
According to gas technical analysis: Natural gas price NATGAS/USD has retreated to the main area of interest shown on the longer-term time frames, and a break below could pave the way for a move to the next major support area at $3,635. Technical indicators favor a bounce, as the 100 SMA is above the 200 SMA to reflect bullish pressure. However, the gap between the indicators is narrowing to hint at a possible bearish crossover soon. The commodity is also trading below its two moving averages as an early indication of selling momentum.
If that materializes, the price of natural gas could drop below $5,585 and make its way to the next main floor. The stochastic has been indicating oversold conditions for some time, which means that sellers can use a breakout period and let the buyers take control. Similarly, the RSI is in the oversold territory to indicate exhaustion among the bears. A turn higher means that bullish momentum could pick up and take the commodity back to the next upside barrier around $8,000.

Oct 25,22-NG-FINALLY price is going up :-)In looking at the chart, you can see how price dropped quite a bit outside the Linear Regression Indicator but price is on it's way back up.
Yesterday was the first day in a long time of positive gains, hopefully going to finish the week off in green territory.
As previously discussed, I put another Buy Order in at 5, which is now in profit so that's good. Just waiting for price to continue skyrocketing.
FYI - price will probably NOT skyrocket up to 10 or anything, but will very slowly make it's way up there over the winter. So this could be a 4 month grind, so get your Big Boy Pants on and strap in for a crazy ride - between the War, Recession, Sky high interest rates and Bankruptcies (more to come over the next 6-12 months) it's going to be a crazy 2023!!
Stay safe!
Heiko

Daily NG analysisDaily NG analysis
Sell trade with target and stop loss as shown in the chart
The trend is down and we may see more drop in the coming period in the medium term
All the best, I hope for your participation in the analysis, and for any inquiries, please send in the comments.
He gave a signal from the strongest areas of entry, special recommendations, with a success rate of 95%, for any inquiry or request for analysis, contact me

Too fast, too furious for Natural Gas?After a sharp drop in August, Natural Gas futures is now sitting close to the long-term uptrend support which has marked key reversal points since June 2020. Our question is whether prices have fallen too fast and too soon?
We question “too furious” when we look at the RSI which currently points to oversold levels. Hitting a low close to 24, the last time RSI reached such an oversold level, in February 2017, prices rallied close to 35% over the next 2 months. We also note the formation of RSI divergence now, like the one we observed during the 2017 period. If history is any guide, from a technical perspective we can expect some upside for Natural Gas in the coming 2 months.
We question “too fast” as we are at the dawn of the seasonality trade. With demand for Natural gas used for heating generally rising as winter months are approaching, we can reflect on the seasonality behavior of Natural Gas prices over the past winters. A simple strategy of buying in the middle of October and waiting for the winter months gives a 70% win-rate when we look back at the past 10 years. Could we expect the same this winter?
On top of these, we think there are a few structural factors that might boost natural gas demand in the US over a longer-term horizon.
1) The recent announcement by the Biden administration that ruled out a ban or curbs on natural gas exports this winter, and Europe’s struggle with the energy crisis spell good news for Natural Gas’s demand.
2) Current Natural gas storage levels are also below the 5-year average as reported by the US EIA .
3) A move away from coal as agreed in the COP26 means alternative energy sources are bound to replace coal. With many coal-powered plants being refurbished to work with natural gas, we see structural demand rising as more of these plants come online.
Natural gas’s current technical levels point oversold to us, with the seasonality trade potentially on the cards and an overall supportive macro backdrop, we lean bullish on Natural gas. As Natural Gas is considered a highly volatile contract, we can use the Average True Range (ATR) to set our stops. In this case, we follow the rule of thumb to multiply the ART by 2, which sets our stop at roughly 4.550.
Entry at 5.200, stop at 4.550. Target at 6.400.
The charts above were generated using CME’s Real-Time data available on TradingView. Inspirante Trading Solutions is subscribed to both TradingView Premium and CME Real-time Market Data which allows us to identify trading set-ups in real-time and express our market opinions. If you have futures in your trading portfolio, you can check out on CME Group data plans available that suit your trading needs www.tradingview.com
Disclaimer:
The contents in this Idea are intended for information purpose only and do not constitute investment recommendation or advice. Nor are they used to promote any specific products or services. They serve as an integral part of a case study to demonstrate fundamental concepts in risk management under given market scenarios.

possible short positionafter a series of lower lows and lower highs the trend remains intact with a possible entry for a short position

OG1!10.24.22 OG1! Natural gas found the bottom and a reversal it should be along trade with a small stop. The market is framed last week, and then the market moved a little bit lower on Friday, and today It gapped higher. This appears to be a long trade with a small stop. We talked about deformations and the likelihood that the market should move higher from the entry, at least for a while.

Natural Gas, maybe the last long swing tradingnatural gas is risky and high volatile. A simply backtest on seasonality over the last years is not sufficient. But I note now an interesting technical convergence to a dynamic support since 2020 and Fibonacci Level (0.618) retracement of this last uptrend. Maybe it could be the last long swing trading if chart will confirm that

NATURALGASNATURAL GAS Target Done ✅😍
AS I share before
Gongratulations for everyone who take this large profits
don´t forget like and support.I will be gratful👨💻
Thank you🙏

Ultra Short Term and Mid Term view of NATURAL GAS NG UNGTickers: NG1!, UNG
Short term view: We are finding weak support at $4.90 level on NG, or $17.50 on UNG.
We are in overall BEAR BIAS MARKET (even with the short term uptrend in the larger equities and bond market) so we will retain the retracement from the SELLERS perspective.
We find a strong case to take profit at $5.20 (NG1!) or $18.15 (UNG)
TP1: $5.20 (NG1!) / $18.15 (UNG)
TP2: $5.35 (NG1!) / $18.80 (UNG)
There is a possibility if the market exuberance continues, we can consider a mid-term view of NG
MIDTERM VIEW :
SHORT TERM VIEW:

NG - A Sad DayThe past set of trading days has been horrendous for the value of natural gas. I posted an earlier idea that suggested natural gas would rally before bowing to the overall negative trend. It opted to instead decline further.
Right now we are at the key $5 level. If you go back on the chart (it hasn't been to this level for a while,) this level serves as major psychological resistance.
At this point, it looks like a "falling knife" where there is absolutely no visible upside. You may want to wait for some sort of reversal pattern before going long, but it could happen here.
If you want to go short, you may want to wait for some sort of pullback as well. Breaking through this support level of $5 would also work.
If it does bottom here, you can expect further upside as it will look somewhat like a double bottom pattern with the $5.5 earlier.
These levels are also starting to get back to more "natural" prices for natural gas.
If you think that the geopolitical mess or upcoming winter will be especially bad, this would be a generally good place to accumulate it.
If not, wait until unnaturally low prices to buy. For instance, around 2020 it hit $1.85. Two years later, it briefly touched $10. Now, it is in the middle of that range.
Personally, it looks to me like a late 2005 pattern where it spiked, came down, and then came back up and made a head and shoulders pattern. Back then, it came back to where it had been immediately prior to the spike, which was about $6. You can probably expect about $3 or $4 if this is any sort of guide.
Overall, you should be able to finally catch some sort of profit going long. This sort of point where everyone has given up can offer a great (though it may be a short-term) opportunity.

Natural Gas: bullish reversal soon?We have a bullish reversal in the weekly and daily RSI. There is a possible expanding triangle in the daily chart suggestion on more wave up. Current price is at a possible resistance--support level.
Watch for price action to support this idea this week.
If confirmed I personally will be using UNG ( 1 x natural gas) and EQT (major USA gas producer).
As always: process your way as everyone's analysis is wrong as times.
Have a great week. Feedback always welcome.

what the market says we have 2 ways
if close above the resistance 7.23 will go heigher
if we get rejection in that area we will have a big move into down and we look for short

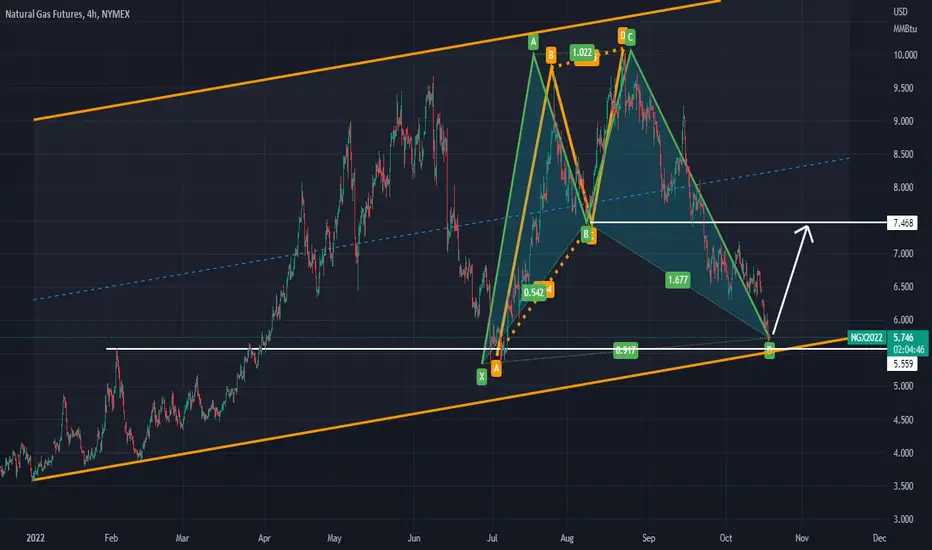
looking for bullish cypher set upPrevious Resistances of $5.559 acting as support for this current D leg.. I initially spotted the ABCD pattern in orange, then I looked for the Bullish Cypher on D leg to kick off. The AD Will confirm
Natural Gas / NG - It's Officially a Bear. Now, Hold My BeerThis post is a continuation of a previous post, which is based on a longer-term analysis:
Natural Gas / NG - What, Truly, Is a Bull?
With Wednesday-Friday and Monday morning's long-awaited dump into the fabled double bottom around $7.4, natural gas can only be considered to have formally shifted into a bearish market structure, based on both the 4H and Daily candles.
Note that the dump also breached range equilibrium.
What this means, is that it's finally time to look for a 45-day short play on natural gas. Remember, Freeport is supposed to re-open for export to Europe in mid-November, so in principle you'd want to see the downside manipulation occur before then.
However, all this time, big firms have been shipping U.S. natural gas via boat to Europe, and making more than $100 million a shipment in the process . Demand has been so enormous that there aren't enough ships on the planet available to meet it.
So it's not that U.S. Henry Hub pricing hasn't reflected the demand problem caused by Europe shooting itself in the knees trying to spite Putin and Russia so it can fit in with cool kids in the Globalist Bloc. It has.
It's just that the reality is, no matter the news and how it's framed, an energy crisis is coming to North America too.
You just won't see it until inflation starts to dip. Energy prices have to come down for inflation to dip. Once inflation dips, it will rip again, because it hasn't topped yet. Anyone who says inflation has peaked obviously can't read The Diagram, and nobody who is unable to read The Diagram is worthy of being a Doctor.
Regarding price action, once something as turbulent as natural gas dumps, and dumps a lot, and takes out key pivots, you have to be careful. At present the market makers are still employing these patterns where they seek and destroy to the downside and then quickly seek and destroy the upside.
It's very hard to catch a truly trending market at the moment, and so you have to employ a surgical strike style of trading and positioning rather than trying to get long or get short and rack up the Sklansky Bucks comfortably.
For example, the stock indexes look like they're going to bounce, and probably hard, before the next big leg down, regardless of what comes out of Wednesday's FOMC:
SPX500 / ES - It's Still a Bull. Now, Good Luck Riding It
With natural gas, what I'm really looking for here to position puts for November is a bounce into the $8.9 range. The problem is, the natural gas market makers are not so polite. They don't want you along for their ride. It's their ride, and if you're good enough to figure it out, you can make money. But if you can't, they will buck you off and you can watch from the sidelines.
They're a lot like angry cowboys, and so there is a possibility that is far from negligible that a number like $9.6 prints again before we see the next move down.
Or at least a number that starts with $9.
Regardless, in my opinion, once this bear is finished growling and knocking over trees, we will actually begin to see trending markets again. They won't trend for all that long, but you won't get bounces this time. It'll just landslide or gap down to where it wants to go and collect all the badly positioned longs or the longs who somehow never took profit during a run to $10.
WTI Oil, likewise, is in the same boat.
WTI Crude / CL - An Intervention: Saving Blind Bulls
Although its price pattern is more notable in that it once again traded back to the $81 gap and bounced again. If it runs the $91 double top it left behind and keeps going up, it might just be a bull run again. But if it just crushes $91 and starts to fall, you can surely expect numbers like $69 and $50 are en route, no matter what the fundamentals say about global demand.
What you're ultimately looking at with the positioning of the markets, whether it be copper, soybeans, stocks, is you're looking at first some bouncing and then what is likely a market-wide sell off with some days of panic that is simultaneously subdued and overexaggerated.
All of which is designed to have you sell low and then buy back higher with half your account left intact.
Consider that last week's CPI dump took 200 points from the SPX in a few hours, but only raised the VIX by like 3 points. VIX 28 is now a ceiling. VIX 40-42 will be where you find the bottoms. VIX 72 will come when the markets truly start to head to the downside.
After the global avalanche is finished, you'll likely see the Nasdaq be extremely strong for a few months. SPX will be okay, but will be drug down by energy companies, which won't do particularly well because they'll be drug down by natural gas and WTI accumulating at low prices. Dow will probably be better than SPX but worse than Nasdaq on account of its defense contractors likewise accumulating at low prices.
Once retail is done gorging themselves stupid on $30 SNAP and $45 BBBY and $198 AAPL, reality will unfold. Stocks will crash, hard.
WTI and Natural Gas and other commodities (Except for silver and gold. Seriously. Quit being a moonboy on ancap stuff. It'll rot your teeth.) will make major new highs and energy companies and defense contractors will become the safe haven in the markets.
When those days unfold, you can expect major geopolitical turbulence, which can include as much as the collapse of the Chinese Communist Party. You can also see significant natural and manmade disasters unfold. It won't be a pleasant time. But you should know that what unfolds will appear chaotic but actually be orderly.
Everything unfolding in the world is orderly and well arranged. This world will not be destroyed, although there will be significant hardship for many regions, and few will find the outcome comfortable.
But for now, you can focus on trying to make money. You have the difficult task of trying to find a time to short natural gas inside of a 15% possible range. You can short $8.9, but they really might take that $9.3 pivot. If you wait for the $9.3 pivot, you might not get filled and miss the move.
This kind of move back up is also designed to dump the ETFs, many of which trade on 2x leverage (10% natural gas move = 20% ETF dump), so big pockets can get fat long for the real dump.
It's very annoying. They're really very annoying about how they do things. It's a constant gut check and a series of difficult and suboptimal circumstances, because time is an excellent weapon and they use it very well.
You should know that all the decisions you face when trading and all the loss and gain you come across are actually opportunities to cultivate your mind and your heart. They're chances to improve.
Every thought and feeling you have while doing this is you forging yourself like quicksilver being refined inside of a crucible powered by burning hydrogen.
Everything depends on how you improve your heart and employ your rationality. Fear and greed are your greatest enemies.

Natural Gas will rally, at least a little bit! 5-15% min.Economic Reasons:
- Natural Gas Nord Stream Sabotage
- Hurricane heading to US
Reasons for a trend reversal:
- Price is heading for a macro uptrend
- Key zone of support and liquidity
- 0.786 retracement from Aug. highs and Sept. lows ($6.33)
- Almost over sold on RSI and MACD on the daily chart. (it is over sold on lower timeframes)
- Bullish divergence on the RSI and MACD for the 4 hr. chart.
Take Profits:
$7.12 (Highest Probability) -- 12% profit
$7.45 -- 17.6% Profit
$8.11 -- 27.6% Profit
$8.60 (Most Likely Top) -- 36% Profit
$9.22 -- 46% Profit
Bearish after rally:
- Completion of the right shoulder of a head and shoulders pattern.
- Break neckline and return to $3.5-4.5's
