AVGO CRACKS! CAUTION!🚨Big head and shoulders pattern at the top, which is significant.
Gap about to be filled, simultaneously breaking neckline.
Great risk-reward setup at a key area.
Caution for Bulls!
THANK YOU for getting me to 5,000 followers! 🙏🔥
Let’s keep climbing.
If you enjoy the work:
👉 Drop a solid comme
Key facts today
Next report date
—
Report period
—
EPS estimate
—
Revenue estimate
—
4.91 USD
23.13 B USD
63.89 B USD
4.65 B
About Broadcom Inc.
Sector
Industry
CEO
Hock E. Tan
Website
Headquarters
Palo Alto
Founded
1961
IPO date
Aug 6, 2009
Identifiers
3
ISIN US11135F1012
Broadcom Inc. is a global technology company, which designs, develops, and supplies semiconductors and infrastructure software solutions. It operates through the Semiconductor Solutions and Infrastructure Software segments. The Semiconductor Solutions segment refers to product lines and intellectual property licensing. The Infrastructure Software segment relates to mainframe, distributed and cyber security solutions, and fibre channel storage area networking business. The company was founded in 1961 and is headquartered in Palo Alto, CA.
Related stocks

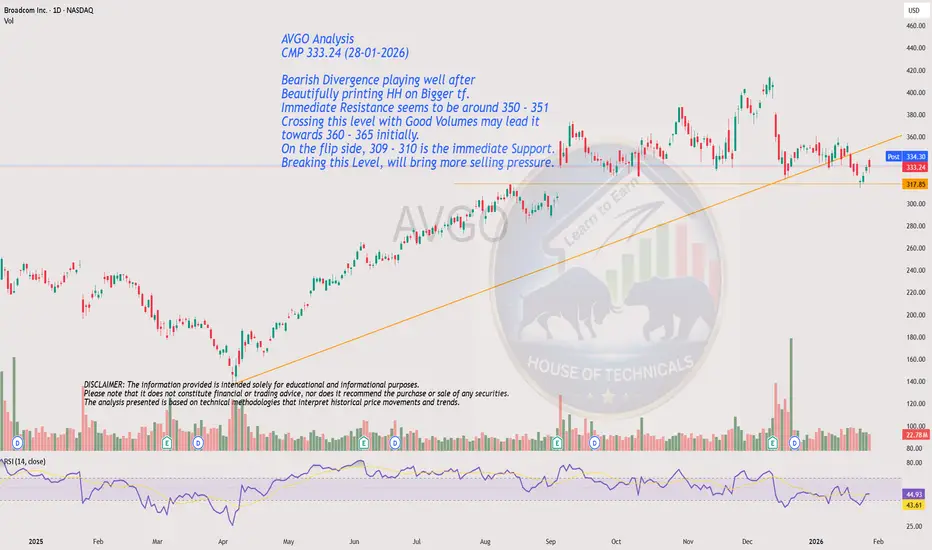
Beautifully printing HH on Bigger tf.AVGO Analysis
CMP 333.24 (28-01-2026)
Bearish Divergence playing well after
Beautifully printing HH on Bigger tf.
Immediate Resistance seems to be around 350 - 351
Crossing this level with Good Volumes may lead it
towards 360 - 365 initially.
On the flip side, 309 - 310 is the immediate Support.

AVGO - 26 Jan 2026 (Head and Shoulder Breakdown)This analysis is purely for education purposes. This is not a Buy or Sell Tip. Please consult your Financial advisor before taking any trades.
- Currently, AVGO has broken the Head and Shoulder neckline.
- Stock could also take Support at the lower end of the Gap and bounce back. In this case, the

AVGO- Bearish outlook following the dumpAVGO
-
Bearish outlook following the dump!
Wait for the key level to break out, together with supply confirmation.
.
US STOCKS- WALL STREET DREAM- LET'S THE MARKET SPEAK!

Broadcom: New Target Zone!The recent sell-off in Broadcom prompted us to refine the ongoing magenta wave (2) with a more detailed substructure and mark a new green Target Zone between $312.17 and $290.60. We expect the low of the subordinate turquoise wave B in this price range, after which the subsequent wave C should compl

AVGO – Breakdown Below HVL🔶 AVGO – Breakdown Below HVL, Negative GEX Targets Gap Fill 🔶
AVGO has cleanly broken below the High Volatility Level (HVL) , which was previously holding around 330 . This breakdown marks a clear regime shift , pushing the market into a 🔴 negative GEX environment where downside sensitivity

AVGO Threw a Party and Forgot the Guests 🚀 AVGO Threw a Party and Forgot the Guests 🚨
Hello team,
We are going to dive into one of the deepest and most counterintuitive secrets of technical analysis.
The sacred relationship between price and volume.
This connection is not just a metric, it is the voice of the market. And sometimes

On the NecklineI thought AVGO already broke through the neckline this morning, but now it's looking like we are right on it, depending on how you draw it. I think we're on it though.
AVGO has been extraordinarily weak, as far as Mag7 go.
META, MSFT, AAPL, also very weak.
I'm not buying puts on this currently, bu

AI Semis: Momentum vs. Mean Reversion, What Wins in 2026?Looking at this relative performance chart of AI / semiconductor stocks over the past year.
INTC and AMD massively outperformed, while other names in the space (AVGO, NVDA, QCOM, MRVL) lagged or moved much more slowly.
Now I’m genuinely debating the next move for a 12 month trade:
Does it make se

See all ideas
Summarizing what the indicators are suggesting.
Neutral
SellBuy
Strong sellStrong buy
Strong sellSellNeutralBuyStrong buy
Neutral
SellBuy
Strong sellStrong buy
Strong sellSellNeutralBuyStrong buy
Neutral
SellBuy
Strong sellStrong buy
Strong sellSellNeutralBuyStrong buy
An aggregate view of professional's ratings.
Neutral
SellBuy
Strong sellStrong buy
Strong sellSellNeutralBuyStrong buy
Neutral
SellBuy
Strong sellStrong buy
Strong sellSellNeutralBuyStrong buy
Neutral
SellBuy
Strong sellStrong buy
Strong sellSellNeutralBuyStrong buy
Displays a symbol's price movements over previous years to identify recurring trends.
Frequently Asked Questions
The current price of AVGO is 308.05 USD — it has decreased by −3.26% in the past 24 hours. Watch Broadcom Inc. stock price performance more closely on the chart.
Depending on the exchange, the stock ticker may vary. For instance, on NASDAQ exchange Broadcom Inc. stocks are traded under the ticker AVGO.
AVGO stock has fallen by −2.86% compared to the previous week, the month change is a −9.20% fall, over the last year Broadcom Inc. has showed a 40.44% increase.
We've gathered analysts' opinions on Broadcom Inc. future price: according to them, AVGO price has a max estimate of 539.00 USD and a min estimate of 370.00 USD. Watch AVGO chart and read a more detailed Broadcom Inc. stock forecast: see what analysts think of Broadcom Inc. and suggest that you do with its stocks.
AVGO reached its all-time high on Dec 10, 2025 with the price of 414.61 USD, and its all-time low was 1.43 USD and was reached on Nov 4, 2009. View more price dynamics on AVGO chart.
See other stocks reaching their highest and lowest prices.
See other stocks reaching their highest and lowest prices.
AVGO stock is 8.48% volatile and has beta coefficient of 2.22. Track Broadcom Inc. stock price on the chart and check out the list of the most volatile stocks — is Broadcom Inc. there?
Today Broadcom Inc. has the market capitalization of 1.52 T, it has increased by 3.34% over the last week.
Yes, you can track Broadcom Inc. financials in yearly and quarterly reports right on TradingView.
Broadcom Inc. is going to release the next earnings report on Mar 4, 2026. Keep track of upcoming events with our Earnings Calendar.
AVGO earnings for the last quarter are 1.95 USD per share, whereas the estimation was 1.87 USD resulting in a 4.43% surprise. The estimated earnings for the next quarter are 2.02 USD per share. See more details about Broadcom Inc. earnings.
Broadcom Inc. revenue for the last quarter amounts to 18.02 B USD, despite the estimated figure of 17.47 B USD. In the next quarter, revenue is expected to reach 19.21 B USD.
AVGO net income for the last quarter is 8.52 B USD, while the quarter before that showed 4.14 B USD of net income which accounts for 105.75% change. Track more Broadcom Inc. financial stats to get the full picture.
Yes, AVGO dividends are paid quarterly. The last dividend per share was 0.65 USD. As of today, Dividend Yield (TTM)% is 0.76%. Tracking Broadcom Inc. dividends might help you take more informed decisions.
Broadcom Inc. dividend yield was 0.64% in 2025, and payout ratio reached 49.52%. The year before the numbers were 1.25% and 170.61% correspondingly. See high-dividend stocks and find more opportunities for your portfolio.
As of Feb 5, 2026, the company has 33 K employees. See our rating of the largest employees — is Broadcom Inc. on this list?
EBITDA measures a company's operating performance, its growth signifies an improvement in the efficiency of a company. Broadcom Inc. EBITDA is 34.93 B USD, and current EBITDA margin is 54.67%. See more stats in Broadcom Inc. financial statements.
Like other stocks, AVGO shares are traded on stock exchanges, e.g. Nasdaq, Nyse, Euronext, and the easiest way to buy them is through an online stock broker. To do this, you need to open an account and follow a broker's procedures, then start trading. You can trade Broadcom Inc. stock right from TradingView charts — choose your broker and connect to your account.
Investing in stocks requires a comprehensive research: you should carefully study all the available data, e.g. company's financials, related news, and its technical analysis. So Broadcom Inc. technincal analysis shows the sell today, and its 1 week rating is sell. Since market conditions are prone to changes, it's worth looking a bit further into the future — according to the 1 month rating Broadcom Inc. stock shows the buy signal. See more of Broadcom Inc. technicals for a more comprehensive analysis.
If you're still not sure, try looking for inspiration in our curated watchlists.
If you're still not sure, try looking for inspiration in our curated watchlists.