BNB 3 months accumulation about to breakout BNB / USDT
BNB showed stability against BTC moves and printed Long accumulation in ascending triangle pattern since last march
A breakout is expected soon !
Incase of successful breakout we can see strong bullish wave
Keep an eye
BNBBEARUSDT trade ideas

Long signal for BNB/USDTThis technical analysis is based on the daily chart of BINANCE:BNBUSDT on the Binance exchange. In this analysis, a price channel is drawn, and support and resistance levels are evaluated.
Price Channel Analysis:
The price is currently within a price channel ranging from 556.3 to 676.1 USDT.
The suggested entry point is around 588.5 USDT.
Entry and Exit Points:
Entry: 588.5 USDT
Take Profit: 676.1 USDT
Stop Loss: 556.3 USDT
Conclusion:
This analysis suggests that by adhering to the specified take profit and stop loss levels, a successful trade can be achieved. The Reward/Risk Ratio for this trade is approximately 2.74, indicating a highly favorable risk-to-reward scenario. To manage risk effectively, it is recommended to strictly follow the stop loss level.

BNBBNB is looking Bullish is making HH and HL in 1hour. Should be enter as i make the trading plan for it.
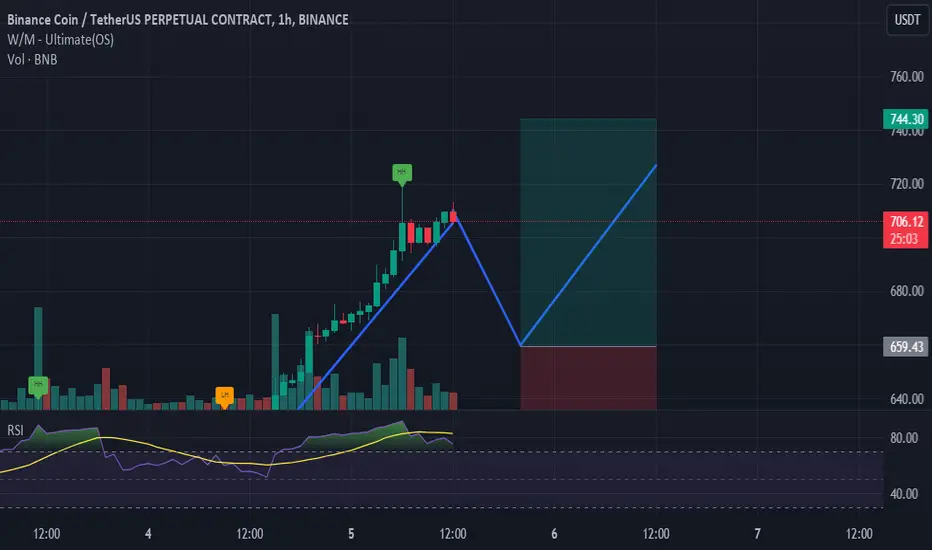
bmwIt is always interesting to break out of some patterns.
Like getting out of the blue pattern that had 150% growth.
Two small yellow and green flag patterns are also visible.
The last green pattern is a beautiful pattern and it must be able to cross the red resistance area and ceiling to be completed.
So wait and watch for now

BNBUSDT UPDATE #BNBUSDT
UPDATE
Hey dear traders hope you are enjoying trading and analysis with our team. we are here to discuss about BNBUSDT
Finally Hits our target ✅

BNB (Y24.P2.Video1).Breakout trade and what nextHi Traders,
Here are my thoughts on this level and what to watch out for in terms with fibonacci levels as well as structure and liquidity.
Please give me a like and share,
Regards,
S.SAri

Lingrid | BNBUSDT Ready for All-Time Highs? The price perfectly fulfilled my last idea. BINANCE:BNBUSDT has been consistently making higher highs on the 4H chart, and the market is currently testing its previous high. This development is significant, as the price has recently broken out of a triangle formation, a trend continuation pattern, and closed above it. The current price action is unfolding right below the previous resistance level on the weekly timeframe. If the price manages to break through this level, it's likely to propel BNB to new all-time highs. Furthermore, the weekly chart reveals an inside bar formation, which indicates that the market was heavily squeezed before the extension, and we're now seeing the price surge towards new extensions. My goal is resistance zone at 650
Traders, if you liked this idea or if you have your own opinion about it, write in the comments. I will be glad 👩💻

#BNB/USDT UPDATE !!Hello friends, welcome to this BNB/USDT update from Crypto Sanders.
Certainly! Here's an update based on the recent movements and potential outlook for BNB (Binance Coin):
Resistance: The key resistance area to watch is around $610.
BNB recently bounced from the support level provided by the yellow moving average line.
The price is now approaching the critical resistance level of $610.
If BNB breaks above $610, it could signal the start of a new rally.
Traders should monitor the price action around this resistance level closely.
I have tried to bring the best possible results in this chart.
If you like it, hit the like button and share your charts in the comments section.
Thank you.

Start the crypto market with BNB?
BNBUSDT :
If it breaks the range of 630 and the candle closes above it
And the pullback is done, we can expect the specified range to move
But keep in mind that this is the first and short-term target
And if the price breaks our red trend line and crosses it
Then it will move up to the blue trend line.
You can open your position right now
And set your stop below 489
Another stop can be 554.
But keep in mind that the price may hit your stop in this area and move up.
So, if you want to open your position at the same price, the safe zone is 489.
If you want to wait, the price will cross 630 and complete the pullback
Stop point 558 is suitable.

$BNBUSDT-Formed Symmetrical TriangleDear Traders,
We are convening a discussion focused on #BNBUSDT
The Symmetrical Triangle Pattern is Formed
In Case of Successful Breakout, Expecting a Bullish Move of 20% 🚀
Regards: AnnaTradeCharts
#Bitcoin #Crypto #Ethereum #Cryptocurrency #CryptoTrading #BTCUSDT #ETHUSDT #ALTCONS #USDT CRYPTOCAP:BTC CRYPTOCAP:ETH CRYPTOCAP:USDT CRYPTOCAP:PEPE CRYPTOCAP:DOGE NASDAQ:ALT

BNB looks bullishConsidering the HLs on the chart and the bullish mCH on the chart and the breaking of the trigger line, we can have a bullish view on BNB.
If there is a pullback on the green range, we will look for buy/long positions.
The target is clear on the chart
Closing a daily candle above the invalidation level will violate the analysis
For risk management, please don't forget stop loss and capital management
When we reach the first target, save some profit and then change the stop to entry
Comment if you have any questions
Thank You

Long BNBUSDT, 8HLong BNBUSDT, 8H
entry 589.0 - 575.9
sl 536.7
tp scalp 641.3
tp1 691.8 (ath) - 715.3
tp2 798.2
move sl to entry after price reach 641.3 ; price shouldn't retest entry again.
BINANCE:BNBUSDT BINANCE:BNBUSDT.P BINANCE:BNBUSD

BNB(BINANCE COIN) is ready to go up
* 1D
BNB seems to be undergoing ascending triangles and triangular convergence.
It's currently attempting to break through the downtrend line at the top of the Ascending triangle and should be supported for further upside.
I think it's about to break through.
Let's see

BNBUSDT IDEAHello Traders Hope You Are Enjoying Our Analysis. Today We Will Discuss About BNB
(Update)
Running In +10% Profit So Far☑️
Moving Exactly As We Expected & Still Moving Towards The Target✍️

BNB trade set up ideaWeekly time frame analysis
BINANCE:BNBUSDT was one of the best performers of the last bull run.
BNB retained its value relatively well ("only" -70% from ATH) during the bear market and formed a clear support zone around the 200$ mark from which it seems to currently be bouncing back to initiate the next impulse.
The Bollinger bands are very contracted and flat, announcing a strong potential move.
Daily time frame
After a steep decline in June 2023, BNB is constructing a reversal Head and Shoulders pattern on a strong multi-year support zone. Volumes confirm the psychological construct of this trend reversal pattern.
Strategy
Buying on a daily close above 235$
Objective 1: Head and Shoulders neckline at 261$ (+12%)
Objective 2: Top of the range at 336$ (+45%)
Objective 3: ATH at 665$ (+190%)
Invalidation
Mental Stop: below the shoulder at 220$
If prices retrace to this level we will wait for the daily closing price then set a Stop loss ¼ or Risk below the daily close price.
Risk = Distance between Mental stop and entry point.

BNBUSDT BULLISH BREAKOUT 💰 CRYPTOCAP:BNB is trying to fix above the Monthly Supply Zone💁♂️
Even if it's a correction case I am not looking for #BNB to go below Monthly Supply Zone
📈Our Mid-Term Target: 908$
BINANCE:BNBUSDT
LEAVE LIKE AND COMMENT FOR SUCH MORE UPDATE ☺
#CRYTOEASE

How many percent can BNB currency grow?BNB currency has a record of 800% and 10,000% growth in the upward movement

BNBUSDT IDEAHello Traders Hope You Are Enjoying Our Analysis. Today We Will Discuss About BNB
(Analysis)
The Ascending Triangle Has Confirmed Breakout On 1D Timeframe☑️
Expecting Massive Bullish Wave✍️

BNBUSDT.1DAnalyzing the daily chart for Binance Coin (BNB) against USDT, we observe a significant price consolidation over the recent months. As of the latest data point, BNB is trading at $629.7. The chart is marked with several key resistance (R1, R2) and support (S1, S2, S3) levels.
Resistance Levels: R1 at $649.1 and R2 at $724.8. These levels have served as strong psychological barriers where price has faced selling pressure. The break above R1 recently suggests a bullish sentiment that may attempt to test the R2 level if this momentum continues.
Support Levels: S1 at $498.2, S2 at $398.5, and S3 below that which isn't clearly shown in the chart. The support levels indicate where buying interest has historically been strong enough to prevent further declines. Notably, the price hasn't tested S1 recently, indicating current market strength.
Technical Indicators:
RSI (Relative Strength Index) is at 56, which is moderately bullish and suggests there's room for upward movement before the asset becomes overbought.
MACD (Moving Average Convergence Divergence) is showing a bullish crossover, which supports the upward price momentum observed.
Price Action: The presence of bullish candlesticks breaking above R1, coupled with increasing trade volume, indicates an accumulation phase possibly by institutional investors, signaling strength.
Conclusion: The technical analysis suggests a bullish outlook for BNB in the short term, provided it sustains above R1. Traders might look for entry points on small retracements towards R1, setting stop losses just below this level to manage risk. The next target would be R2, with a possible breakout leading to higher highs. However, any reversal and break below R1 would require reevaluating this bullish scenario. Always consider market news and broader economic indicators which might influence market sentiment and cause sudden shifts in price trends.

BNBUSD 1DBNB ~ Updated
#BNB The retest of the support line of this pattern has been successful.
Rocket Takes Off Soon

BNBUSDT #001 ( Keep your Eyes on bullish Rally $$$ ) Hello dear traders.
Good days .
On daily Gann Square first Gann Arc resistance is broken and passed.
With support from lower Gann Fan line, is about to broken 2nd Gann Arc resistance and start 3rd Bullish leg of Elliot wave .
BNBUSDT is at Time reversal zone and expected from this position start bullish rally.
Chart updated and route plotted with help of Gann Square and Gann Box.
Good luck and safe trades.
Thanks for your support and comments

BNB/USDT ANALYSIShigher lows with bullish momentum candle toke last swing so wait for next day candle to confirm the continuation of upward move

Trading opportunity. What to buy?In the crypto market, the largest assets are currently experiencing similar situations.
On the charts, we can see that six assets have formed sideways trends. Prices for all six assets are currently at the bottom of these sideways trends. For four assets, the price temporarily dropped below the lower boundary of the sideways trend, where liquidity from sellers was collected, but then returned to the sideways trend. The prices of five assets, excluding BNB, are in zones where it makes sense to consider buying. The most interesting potential is with DOGE and AVAX.
One possible strategy to consider is buying four assets that you like the most.
