BNB is going downIs BNB to the $500 ? BNB is down to the $500. because of there has some imbalances and H4 OB and more liquidities. So that's why I'm telling that. But still trading risk is your responsible.
BNBUSDT trade ideas

BNB: Pullback in UptrendTrade setup : Price is in an Uptrend. It briefly broke above $600, however, it got very overbought (RSI > 80!) and was rejected at that resistance on some profit taking. Now we look for the right entry opportunity in Uptrend.
We wait for price to either 1) break back above $600 to signal continuation of uptrend, with +10% upside potential to $670 next, or 2) pull back near $500 support for another swing trade entry in Uptrend with +20% upside potential back to $600.
Trend : Uptrend across all time horizons (Short- Medium- and Long-Term).
Momentum is Bullish but inflecting. MACD Line is above MACD Signal Line and RSI is above 55 but momentum may have peaked since MACD Histogram bars are declining, which suggests that momentum is weakening.
Support and Resistance : Nearest Support Zone is $500 (previous resistance), then $400. The nearest Resistance Zone is $600, then $670.

BNB falling wedge pattern. Time to wait for the green candleTake a stop loss at 540 and buy now, or wait for a green candle for the next move above 560.

Live tradingview watchlists for binance spot, margin and futuresIf you want the most recent binance pairs to import into tradingview you can head over to satval.com and click on the list of your choice.
Then click on the watchlist icon (top right), click on the three horizontal dots (menu) and click import list. Then upload the text file that you just downloaded from satval.com.
The satval.com list is up to date, pulled live from binance when you download it. So visit up on a weekly basis and update your watchlists.
Give me a like if you like. You can also check out and help test our tradingview to discord alert notes.

Smart Buy Limits in BNBUSDT for Personal Trading SuccessElevate your trading experience with personalized buy long-limit orders in BNBUSDT on Binance, tailored to your unique investment goals and risk appetite. As your dedicated account manager, I provide exclusive access to expert signals and strategic insights, guiding you through the dynamic world of crypto trading with precision and confidence.
Experience the benefits of custom-tailored trading strategies, meticulously crafted to optimize your entry points and maximize profit potential. From setting up your long-limit orders to implementing advanced trade management techniques, I'll work closely with you to navigate market fluctuations and capitalize on lucrative opportunities.
Join my exclusive network of traders and gain access to a wealth of knowledge and resources designed to empower you on your trading journey. With personalized guidance and expert account management, you'll have the support you need to achieve your financial goals and unlock unparalleled success in the crypto market. Take the first step towards trading mastery today!


Double top on 4hr TFI'm just sharing what I'm seeing and I can be wrong but I'm seeing a double top top on 4 hr TF which is indicates to me that it will be bearish in Future.

Cryptolean Binancecoin BNB UpdateYesterday Binancecoin could not close above $529.
Today, a bullish Bitcoin Dominance put pressure on the Satoshi value of BNB and we saw an intraday pullback to $505.
A daily candle closure above $529 will increase a probability of a continuation of a bullish move up towards $586 and higher towards $600.
An inability to sustain could lead to a re-test of $505 and a dip lower to the key daily support zone at $455-$477.
Intraday Chart
The BNBUSD intraday chart is taking a pause and consolidating.
It is trading in the bullish territory through.
A re-test of the key intraday support at $507 and a bullish rejection will push #Binancecoin price towards $544.
A bullish break-out of $544 will result in a bullish rally towards $588-$620.
A bearish break-out of $507 will lead to a dip towards $472 support and, possibly lower, to $438. .
IMPORTANT: The BNBUSD chart is holding strong and consolidating in a narrow range which is totally normal after last days bullish extension.Once Satoshi price in BNBBTC chart will find a support and reverse, the Dollar price in BNBUSD chart will extend higher.
Like once read.
Thank you!

BNB Price Prediction Last Few Days BNB Close their Price near 635 usdt and Around. Current Price is 591 USDT. EMA 200 line is Very Close to the price Line. Histagram is Signal Red. Price Will be Move Around 550 to 650 USDT.


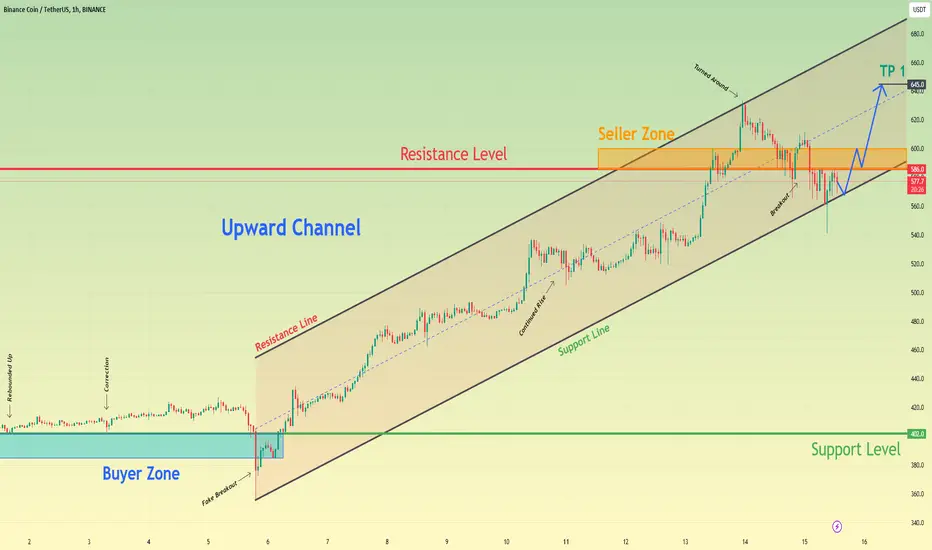
Binance Coin can break resistance level, and continue to growHello traders, I want share with you my opinion about Binance Coin. Observing the chart, we can see that the price some time ago rebounded from the support level, which coincided with the buyer zone and started to grow, but soon price made a correction to this level, after which BNB continued to move up. Soon, the price turned around and made a fake breakout of the 402 level and then it turned around and started to grow in an upward channel, where BNB soon broke the 402 level one more time and then continued to grow. In the channel, the price rose to the resistance level, which coincided with the seller zone and even broke this level, after which it reached the resistance line of the channel, thereby exiting from the seller zone also. But soon, BNB turned around from this line and in a short time declined to support line of upward channel, breaking the 586 level. At the moment, Binance Coin trades near this line, and in my opinion, BNB can rebound up from the support line to the seller zone, thereby breaking the resistance level. After this, Binance Coin can make a retest and then continue to grow in an upward channel, therefore I set my target at the 645 level. Please share this idea with your friends and click Boost 🚀
BNB | Binance will not allow her own token to fail.Actually, I have done a previous analysis of the BNB chart when we were trading around the 230 area.
On that day, I wrote verbatim that we are at a crossroads, and I wondered a legitimate question: Is it too big to fail, or is too weak to survive.
Over time, we discovered that it was too big to fail.
Now we are facing a new crossroads. Will Binance continue to support its own token, or will it allow selling bears to skin BNB alive.
Recently, we noticed that its support for its own token is derived through the introduction of new projects in it's own launchapd.
Regardless of my vision of these projects and the extent of their importance or the addition they may provide to the industry, the reality imposed on us is that Binance’s introduction of these projects supports its own currency very significantly.
In all cases, and far from any side disputes, I expect further rises in the BNB price, but due to the instability conditions expected to occur during the coming days, especially with the news circulating about Bitcoin, I strongly suggest to DCA your entry at least twice.
Here is the final setup info
Entry 1 : 303
Entry 2 : 277.78
Average entry : 290.39
Stop : 254.1
TP1 : 337.5
TP2 : 370.7
Final setup target : 455
Goodluck.

The key is whether the reported price (ATH) can be renewedHello traders!
If you "Follow" us, you can always get new information quickly.
Please also click “Boost”.
Have a good day.
-------------------------------------
(BNBUSDT 1M chart)
It has risen above 533.9 and continues to rise to renew the new high (ATH).
Accordingly, the key is whether it can rise above 1 (730.5).
If not, and it falls, you should check if it is supported around 533.9.
(1W chart)
I believe that the 573.0-649.5 section corresponds to the psychological volume profile section.
Accordingly, the key is whether the price can be maintained by rising above 649.5.
(1D chart)
If the price maintains above 573.0-649.5, it is expected to rise above 730.5.
If it falls,
1st: 522.0
2nd: 427.2
You need to check if you receive support near the 1st and 2nd levels above.
If the price holds above Fibonacci 1 (730.5), the next target is expected to be 1.618 (1057.2).
It may swing up and down to rise to around 1057.2, but I think it is highly likely that it will eventually touch it.
BNB is one of the coins whose circulation volume is reduced through periodic buybacks.
Therefore, I think it is a coin that can be used for mid- to long-term investment.
These mid- to long-term investment coins can be purchased at a low price and held as is.
However, if possible, when a large upward trend appears to be coming to an end, I think it is a good idea to increase the number of coins corresponding to profit by selling only an amount equivalent to the purchase principal.
If you sell the amount of the purchase principal, the average purchase price of the remaining coins is 0, so there is no risk of long-term holding.
Therefore, purchase principal * 1.1 = amount to sell
(Example) If you multiply the purchase principal by 1.1, you will sell 10% more of the purchase principal.
As above, it is recommended to multiply it by about 1.1 and cash out more than the purchase principal.
Have a good time.
thank you
--------------------------------------------------
- The big picture
The full-fledged upward trend is expected to begin when the price rises above 29K.
This is the section expected to be touched in the next bull market, 81K-95K.
#BTCUSD 12M
1st: 44234.54
2nd: 61383.23
3rd: 89126.41
101875.70-106275.10 (when overshooting)
4th: 13401.28
151166.97-157451.83 (when overshooting)
5th: 178910.15
These are points that are likely to encounter resistance in the future.
We need to see if we can break through these points upward.
Since it is thought that a new trend can be created in the overshooting area, you should check the movement when this area is touched.
If the general upward trend continues until 2025, it is expected to rise to around 57014.33 and then create a pull back pattern.
1st: 43833.05
2nd: 32992.55
-----------------

$BNB: $720 United States dollars for BNBBinance is one of the exchanges with the most amount of volume. Bull market, volume, $BNB. Those are the only words you need to see.

BNB UPdateBNB - Target = 580 (was given long time ago) got hit! Finally.
Congrats!
Now 640 area is ahead.
Good Luck!

BNB - Maybe is a good play!Attention: This is a mid-term technical analysis.
Support area: 183 to 209 Dollars
First resistance: 270 Dollars
First target: 300 to 305 Dollars
Good luck!

BNBUSDT | ABC Pattern - Pullback Entry & Target Mega BullflagA bullish scenario for long-term view after a confirmed descending triangle breakout with a potential pullback entry position targeting ABC pattern at 100% - 161.8% Fib extension upper resistance of the mega bull flag.
S1/S2: pullback descending triangle support / ema20w zone
T1: 100% fib extension +50%
T2: 161.8% +90%
Indicator: RSI week - tapping into OB area with no sign of bearish divergence.

HelenP. I BNB can rebound up from trend line and then fallHi folks today I'm prepared for you Binance Coin analytics. Some time ago price reached the support zone, which coincided with support 2, and soon broke this level, but later BNB fell back. After this, the price broke support 2 again and then rose a little higher, but soon the price turned around and made an impulse down to the trend line, breaking support 2 one more time. When the price fell to the trend line, it turned around and at once started to move up and soon reached support 2 and broke it again. Next, the price continued to move up to support 1, which coincided with one more support zone. And when BNB reached this level, the price broke it and entered to the support zone, but soon BNB made the correction below. After correction, BNB some time traded below support 1 and later finally broke it again and even rose higher than the support zone, but a not long time ago price fell back. At the moment, BNB trades near support 1, which coincided with the trend line inside the support zone and I expect that Binance Coin will rebound up from the trend line and then fall lower than this line and support 1, thereby breaking them. That's why I set my target at the 500 level. If you like my analytics you may support me with your like/comment ❤️

Binance Coin(BNB): Further Push or Correction?Binance Coin has been flying here for some time now, making higher high zones.
As of now, we see some sideways movement where we might see some potential grabs happen.
What do you think? We will see a breakout from zone A or breakdown towards B, C, and D zones.
Swallow Team

BNB Binance Coin Potential Retracement SoonIf you haven`t sold BNB on the triple top:
Then using the Fibonacci Retracement tool, I believe there will be a new buy opportunity in the $394 - $420 range!

BNB price is preparing for a strong growth soon ?The year 2023 was not the best for Binance and CZ, if we analyze the news background, lawsuits, fines, etc.
But everything seems to have "calmed down and stabilized"
The other day, there was another burning of BNB worth more than $600 million. Now, 154 million of the 200 million coins that were in circulation at the beginning are in circulation. Almost half of the planned amount was burned (ultimately, only 100 million BNB should remain in circulation).
It seems to us that a good "window of opportunity" is now opening up to drive the BNBUSDT price to the range of $520-540.
There you can sell a little BNB to cover the "expenses" of the past year)
_____________________
Did you like our analysis? Leave a comment, like, and follow to get more

BNB/USDT 4HInterval Support and ResistanceHello everyone, let's look at the 4H BNB to USDT chart as we can see that the price has broken out of the local uptrend line.
Let's start by setting goals for the near future that we can include:
T1 = $575
T2 = $618
T3 = $649
AND
T4 = $689
Now let's move on to the stop-loss in case of further market declines:
SL1 = $512
SL2 = $484 - $469
AND
SL3 = $425
Looking at the RSI indicator, we can see that we have again approached the downward trend line and there is still a lot of room for recovery, while the STOCH indicator, despite the current rebound, also has a lot of room for recovery.

BNB Bullish Breakout happening nowAn inverse head and shoulders breaking above the 260$ resistance. We are most likely going to 300 and then 330-340.
There is also a massive amount of bullish divergence on the MaCD.
The stoploss is strategically placed below the neckline and key support level.
