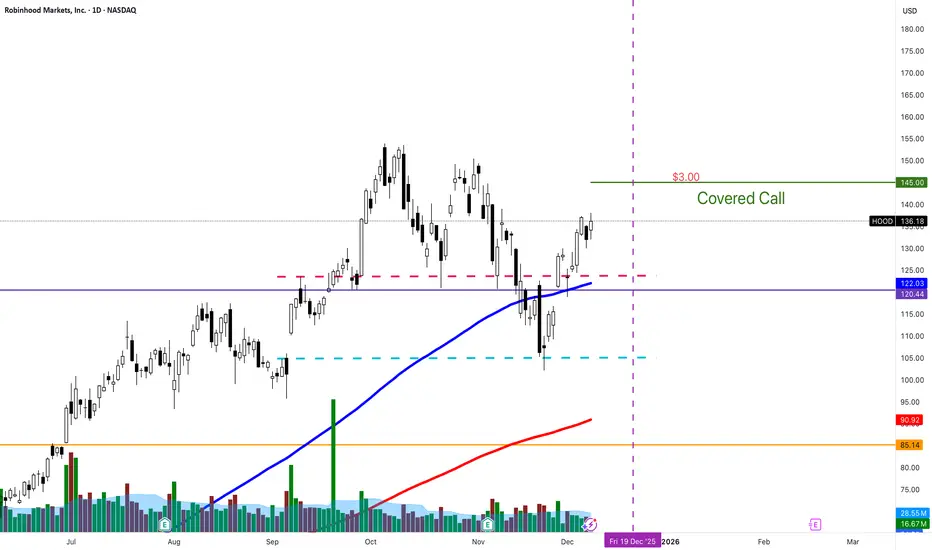
HOOD covered callsI'm in shares. WHO Doesn't love HOOD and use the app/platform all the time?! I love that HOOD is above the 100 sma. I love that its had a pull back. And I have no issue holding it for a while and eventually selling it higher. :-)
Next report date
—
Report period
—
EPS estimate
—
Revenue estimate
—
2.48 USD
1.41 B USD
2.98 B USD
759.10 M
About Robinhood Markets, Inc.
Sector
Industry
CEO
Vladimir Tenev
Website
Headquarters
Menlo Park
Founded
2013
Identifiers
3
ISINUS7707001027
Robinhood Markets, Inc is a financial services platform, which engages in the provision of retail brokerage and offers trading in U.S. listed stocks and Exchange Traded Funds, related options, and cryptocurrency trading, as well as cash management, which includes debit cards services. The company was founded by Vladimir Tenev and Baiju Prafulkumar Bhatt in 2013 and is headquartered in Menlo Park, CA.
Related stocks
HOOD Trend Shift Warning: Bearish Signals EmergeHOOD Weekly Signal | 2025-12-08
Instrument: HOOD
Direction: PUT (Short Bias)
Strike Price: 135.00
Expiry: 2025-12-12 (4 days)
Entry Range: $1.85 – $2.15
Target 1: $3.00
Target 2: $4.00
Stop Loss: $1.20
Position Size: 1.5% of portfolio
Confidence: 58%
Risk Level: HIGH (Speculative)
Model Notes:
Kat

Robinhood pretends to chill, but the chart exposes its ambitionsRobinhood pretends to wander, but the chart already knows its destination
HOOD closed at 123.08 on the daily chart and is moving toward the buy zone 116.54–120.86, aligned with the ma100, which forms a strong demand area. As long as price stays above the intermediate support near 120.00, the bul

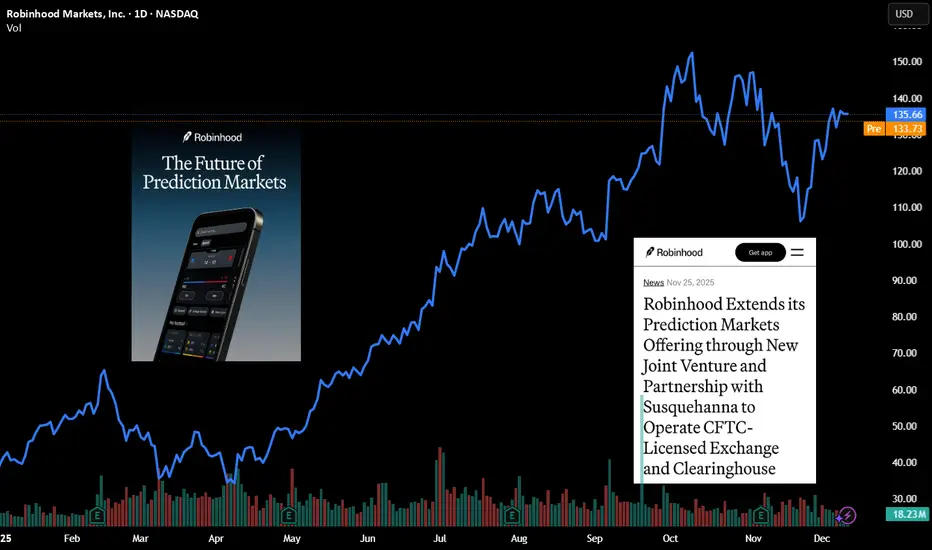
Robinhood: "Event Contracts" Become a New Growth EngineRobinhood Markets ( NASDAQ:HOOD ) reported November monthly metrics yesterday. Data shows lower trading volumes across all asset classes except for the newer events stream.
Equity trading volume of $201.5B in November is 37% lower from October but up 37% Y/Y.
Options contracts totaled $193.2M
HOOD - Speculative Cup and HandleUsing bars patterns to plot a handle to the current massive cup looking structure on HOOD
I think price will hit the horizontal white line again before it continues to rise again
Daily timeframe

HOOD Katy AI Insight | Short-Term Bullish MomentumHOOD QuantSignals Katy 1M Prediction 2025-12-10
🚀 QuantSignals Katy AI Stock Analysis
Analyzed 1 stock(s): HOOD
📈 HOOD Analysis
Current Price: $134.25
Final Prediction: $135.49 (+0.93%)
30min Target: $136.82 (+1.92%)
Trend: BULLISH
Confidence: 56.2%
Volatility: 17.0%
🎯 TRADE SIGNAL:
Direction: L

HOOD: Bullish AI vs. Bearish Flow – Contrarian OpportunityHOOD Weekly Signal Summary
Instrument: HOOD
Direction: BUY PUTS (contrarian to AI call prediction)
Confidence: 60–65%
Expiry: 2025-12-19 (7 days)
Strike Focus: $112.00 / $120.00
Entry Range: $4.45–$10.12 (depends on strike)
Target 1: $6.70–$16.19 (50–60% gain)
Target 2: $8.90–$22.27 (100–120

$HOOD PUT SaleBullish on HOOD, I would be buying shares at this level, however I want to see if able to get a better price below by selling a very close PUT

HOOD Weekly Options Strategy — Bearish Edge Despite LLM Call Adv📈 HOOD Trading Info — Weekly Signal (2025-12-09)
BUY PUTS
Confidence: 58% (Low Conviction)
Risk Level: High — Katy/LLM conflict detected
🔢 Options Setup
Strike: $126.00
Expiry: 2025-12-12 (3 days)
Entry Range: $0.41 – $0.53 (Use exact bid/ask)
Target 1: $0.82 (100% gain)
Target 2: $1.23 (200%
Put Sale $HOODI would like to own HOOD at a lower price. Selling a PUT at my wished entry price, expiring this Friday

See all ideas
An aggregate view of professional's ratings.
Neutral
SellBuy
Strong sellStrong buy
Strong sellSellNeutralBuyStrong buy
Neutral
SellBuy
Strong sellStrong buy
Strong sellSellNeutralBuyStrong buy
Neutral
SellBuy
Strong sellStrong buy
Strong sellSellNeutralBuyStrong buy
Displays a symbol's price movements over previous years to identify recurring trends.
Curated watchlists where HOOD is featured.


Frequently Asked Questions
Depending on the exchange, the stock ticker may vary. For instance, on BOATS exchange Robinhood Markets, Inc. stocks are traded under the ticker HOOD.
We've gathered analysts' opinions on Robinhood Markets, Inc. future price: according to them, HOOD price has a max estimate of 180.00 USD and a min estimate of 92.00 USD. Watch HOOD chart and read a more detailed Robinhood Markets, Inc. stock forecast: see what analysts think of Robinhood Markets, Inc. and suggest that you do with its stocks.
HOOD reached its all-time high on Oct 6, 2025 with the price of 154.17 USD, and its all-time low was 7.28 USD and was reached on Jun 21, 2022. View more price dynamics on HOOD chart.
See other stocks reaching their highest and lowest prices.
See other stocks reaching their highest and lowest prices.
Yes, you can track Robinhood Markets, Inc. financials in yearly and quarterly reports right on TradingView.
Robinhood Markets, Inc. is going to release the next earnings report on Feb 18, 2026. Keep track of upcoming events with our Earnings Calendar.
HOOD earnings for the last quarter are 0.61 USD per share, whereas the estimation was 0.54 USD resulting in a 13.36% surprise. The estimated earnings for the next quarter are 0.59 USD per share. See more details about Robinhood Markets, Inc. earnings.
Robinhood Markets, Inc. revenue for the last quarter amounts to 1.27 B USD, despite the estimated figure of 1.21 B USD. In the next quarter, revenue is expected to reach 1.34 B USD.
HOOD net income for the last quarter is 556.00 M USD, while the quarter before that showed 386.00 M USD of net income which accounts for 44.04% change. Track more Robinhood Markets, Inc. financial stats to get the full picture.
No, HOOD doesn't pay any dividends to its shareholders. But don't worry, we've prepared a list of high-dividend stocks for you.
As of Dec 19, 2025, the company has 2.3 K employees. See our rating of the largest employees — is Robinhood Markets, Inc. on this list?
EBITDA measures a company's operating performance, its growth signifies an improvement in the efficiency of a company. Robinhood Markets, Inc. EBITDA is 2.11 B USD, and current EBITDA margin is 38.82%. See more stats in Robinhood Markets, Inc. financial statements.
Like other stocks, HOOD shares are traded on stock exchanges, e.g. Nasdaq, Nyse, Euronext, and the easiest way to buy them is through an online stock broker. To do this, you need to open an account and follow a broker's procedures, then start trading. You can trade Robinhood Markets, Inc. stock right from TradingView charts — choose your broker and connect to your account.