BTCUSDT roadmapBTC roadmap for next months looks not really nice.. We might see a new High and/or Go down from here to the Origin. Next bullrun might take long time.
BTCUST trade ideas

BITCOIN 4HOUR CHART UPDATE !!Hello friends, welcome to this BITCOIN update from Crypto Sanders.
It looks like BTC is ready to accelerate higher, possibly approaching $65200. Today offers excellent trading opportunities, especially for long positions. Stay tuned for more updates as the situation unfolds. Thank you for your attention, and we will keep you updated on any developments.
I have tried to bring the best possible results in this chart.
If you like it, hit the like button and share your charts in the comments section.
Thank you.


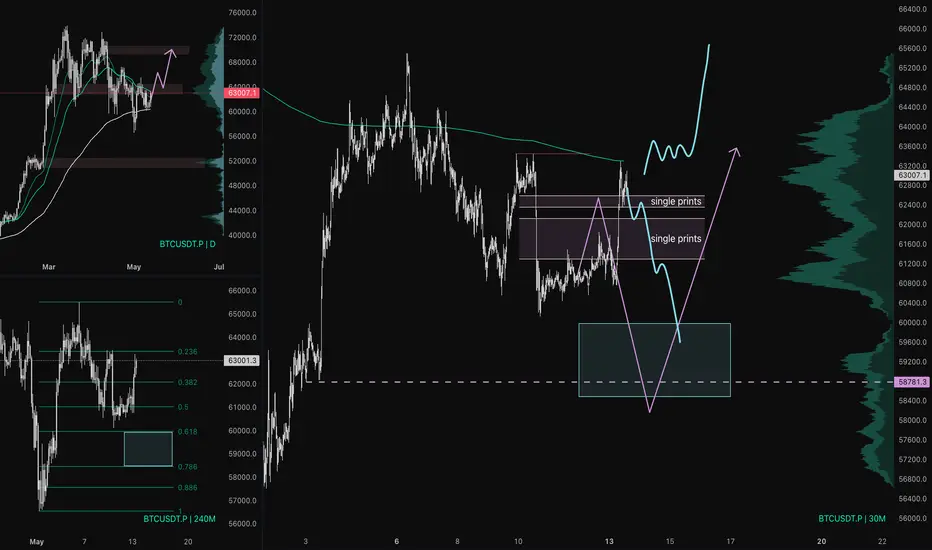
BTC: Monday updateStill compressing between our EMAs and under main resistance level.
We reverse-barted the Friday move, but got stopped by H4 EMA 200. In this move all the single prints from Friday got filled, as we anticipated.
We have some equal highs on the binance perp pair, but on almost every other exchange and pair they got swept, so I'm not giving those a lot of importance.
If we reject here, I'm still looking for a 60k sweep to long.
If we reclaim H4 EMA 200, chances are we're seeing a squeeze into the 70k orderblock
Bitcoin made change of characterAs long as the support of the green color is kept, this move is definite in my opinion☺️

I'm going to break the "Bitcoin"Hello friends, nice to meet you. Here's an amazing Bitcoin chart perspective today
I always support your successful investment.
I hope you do well with safe risk management.
Go for it!
Lowering the highs, the wave is moving in a downward trend.
If you succeed in retesting after breaking the red downward trend line upward, you can think of it as open to 80.4K as a medium wave.
Here we go!!
Now we need to find a moment of rebound. We need to position ourselves in a position where we have good cost-effectiveness and profit-loss ratio so that we have a shorter loss range and a larger loss day.
At the current position, on an hour-long basis, I think the upward divergence is emerging, which is the first condition for a rebound.
The thing to watch out for in the upward divergence shown in the chart above is the push of the candle or the tail end of the candle
In terms of small waves, it showed a form of raising the low point, but if the retest is successful after breaking the blue short-term upward trend line and closing the bell due to the power of the current sell-off, it should be seen that it can reach 57K once again.
Summary:
■60810 The rebound must be achieved after overcoming the price to raise the low point in the sofa statue.
■1 hour-long RSI and upward divergence appeared.
■ If you succeed in retesting after breaking the red downward trend line of the 4-hour rod, it will be open to 80.4K on a medium wave basis.
Bonus Chart
The chart below is my most reliable long-term trend line.
If the adjustment deepens, it could go down to the blue thick upward trend line (56.2K to 56.4K)
Thank you :)

btc → stil need to touch the lower levelhello guys...
I think the main trend still is bearish due to the last move!
the 50% of the last downward movement seems an interesting area to get a short position until the price touches the 59k area!
___________________________
✓✓✓ always do your research.
❒❒❒ If you have any questions, you can write them in the comments below, and I will answer them.
❤︎ ❤︎ ❤︎And please don't forget to support this idea with your likes and comment

Upward trade it looks like upward trade now to cover FVG and also retraced from 0786 to wards negative 0618 level . im in long with tight stoploss


BUY BITCOIN 14/05 🚀After surging by around 16% at the start of the month, Bitcoin has been retracing since the beginning of the week.
A very nice setup has been taking shape since May 6.
I told you about it last Thursday, but it's still going strong, especially as a range is now up for grabs! (grey zone)
A CHoCH was created at $64714, which made me go long.
The price is now correcting towards its OTE zone, where there's a nice Order Block at H4.
I'm going to wait for a reaction from the price on this OB before possibly going long.
However, if this OB doesn't hold, it's quite possible that we'll go looking for $52,000, as mentioned in one of my previous analyses.
Feel free to subscribe and boost this post if you enjoyed my analysis, and let me know what you think!
Happy trading and a great week :)

Introducing another way to display volume profile sectionsHello traders!
If you "Follow" us, you can always get new information quickly.
Please also click “Boost”.
Have a good day.
-------------------------------------
The indicators activated in the settings are those created by trading volume.
Therefore, this indicator represents the volume profile section.
The indicator that the arrow points to is the indicator I mentioned earlier.
By looking at this indicator together with volume candles, you can more clearly identify the volume profile section and support and resistance sections.
In addition, you can verify the start of trading by checking the movement of the BW indicator, which consists of five indicators, namely MACD, StochRSI, CCI, PVT, and superTrend indicators.
BW-MACD, BW-StochRSI, BW-CCI, BW-PVT, and BW-superTrend indicators are displayed separately to help you understand the indicators.
Once your trading timing has been selected, you need to create a trading strategy that suits your investment style.
What is important in creating a trading strategy that suits your investment style is the investment period and investment size.
Once the investment period and investment size have been decided, you must create a trading method and profit realization method using the information obtained from chart analysis.
Trading methods include buying, selling, and stop loss methods.
The purchase method should focus on how to lower the average purchase price by purchasing in installments.
At that time, when the price falls below the stop loss point and shows resistance, you need to think about how to proceed with selling.
When taking a stop loss, you must proceed according to the investment period you have set.
For example, if you decide to trade within one wave as a short-term trade and proceed with the trade, but the price falls below the stop loss point, you should be able to sell 100% and then watch the situation.
If the price rises after purchasing, you must proceed with selling according to the selling method.
The selling method must also be carried out according to the investment period.
However, the method of increasing the number of coins (tokens) corresponding to profit by selling the amount equal to the purchase amount can be continued into mid- to long-term trading even if the transaction was done through day trading or short-term trading.
The reason is that the average purchase price of coins (tokens) corresponding to profits is 0.
If you add other indicators to help you conduct split transactions based on price fluctuations, the chart will look like the one above.
If the chart is unfamiliar to your eyes,
It is recommended to view only the HA-Low, HA-High indicators and the M-Signal indicators of the 1D, 1W, and 1M charts.
Have a good time.
thank you
--------------------------------------------------
- The big picture
A full-fledged upward trend is expected to begin when the price rises above 29K.
This is the section expected to be touched in the next bull market, 81K-95K.
#BTCUSD 12M
1st: 44234.54
2nd: 61383.23
3rd: 89126.41
101875.70-106275.10 (when overshooting)
4th: 13401.28
151166.97-157451.83 (when overshooting)
5th: 178910.15
These are points that are likely to encounter resistance in the future.
We need to see if we can break through these points upward.
Since it is thought that a new trend can be created in the overshooting zone, you should check the movement when this zone is touched.
#BTCUSD 1M
If the general upward trend continues until 2025, it is expected to rise to around 57014.33 and then create a pull back pattern.
1st: 43833.05
2nd: 32992.55
-----------------

BTC bearish As of now I’m short targeting the 1st FVG below. We keep making LH’s and LL’s. The market trend is down. Seen this way to many times to see a huge flush is brewing and many will be liquidated. Suggest closing all longs and shorts unless he short from higher or long from much lower. When I say “lower” I’m talking sub $50k

What's going on in Bitcoin's mind?Currently, I expect the price to correct to $53,000.
If the price breaks the specified resistance ($67,420), the price will enter the bullish phase with a target of $86,000.

BTC / USD bearish outlook. High probability of a 15% dropThere are many reasons why CRYPTOCAP:BTC could actually fall further from this descending channel, both on the chart and in the macro economy. Let's dig into my reasoning and how I came to this conclusion.
Here is a list of negative factors:
The macroeconomic outlook is bad. We will likely see poor CPI reports and disappointing FED meetings in the coming months.
The S&P 500 is at an all-time high, suggesting a correction is imminent. If this correction occurs, crypto will also likely fall.
Gold prices have corrected.
CRYPTOCAP:BTC has been moving sideways for 170 days, causing many bulls to turn bearish in hopes of finding a better entry point for the remainder of the bull run.
There is a lot of liquidity and short positions below us at $58k, GETTEX:52K , and GETTEX:48K , which exchanges and whales can easily target.
There is significant liquidity above us at FWB:67K - $71k, but bulls have tried to reach this level four times and were rejected by the top descending trendline.
Volume is decreasing, which can lead to a massive move.
The MACD is struggling to rise, indicating low momentum.
The SRSI is oscillating below 50 without breaking out of this middle range.
The fake-out on April 9th reset the downtrend channel with a more bearish outlook, which is why I start my trendline from this date.
Conclusion: To exit this descending channel, a shakeout is necessary. The bulls are not strong enough to push to the upside, the macroeconomic environment is negative, and there is nothing to help CRYPTOCAP:BTC pump significantly.
Bulls seem to realize that in order to escape this trap, a significant capitulation is necessary to restart the uptrend.
If we drop to the $50k area, many bears will enter long positions, resetting the market to an uptrend.
This is just an idea, I might be wrong, DYOR, everything can happen.


BTC Bullish Bat Potential BTC Bullish Bat HTF Late June/July Bottom. 42.5 is the VAH of that lower range.

BTC in public Zone and facing a minor resistanceTo make the bullish continue BTC needs to hold above 65K or else it goes for the retest of EMA200 around 63000-63500 in 4H.Daily closing also interesting to watch.

BTC to 100K There is a clear falling wedge on BTC on the daily time frame. Oh my goodness the measured move puts us smack-bang in the 100k region (psychological resistance ). Play the pattern responsibly and don't drink and drive.

BTCUSD Last attempt to short BTC failed. Here I incorporate smart money approach in attempt to validate Elliott Wave count.

Hello friends, Thank you for joining me in this analysis. RememHello friends,
Thank you for joining me in this analysis. Remember to like, subscribe, and stay tuned for more updates. See you soon!
Thanks, Bros


After exiting from pennant, BTC can make retest and bounce upHello traders, I want share with you my opinion about Bitcoin. Observing the chart, we can see that the price a long time ago reached a resistance level, which coincided with the seller zone, and then made a downward impulse to 56500 points, thereby breaking the 60200 level. But later BTC turned around and made a strong impulse up to the resistance level, breaking the 60200 level, which coincided with the buyer zone one more time. Also, the price entered the seller zone, where it rose to 65300 points and then at once turned around and started to decline, breaking soon the 64600 level again. As well price continued to decline inside the pennant, pattern, where it corrected almost to the support level. After this, BTC rose to the resistance line, but at once rebounded then and fell to the 60200 level and then started to grow to the resistance line of pennant again. When BTC reached this line, the price broke it, thereby exiting from the pennant pattern and now it trades near. In my opinion, Bitcoin can decline to this line, making retest and then rebound up. For this reason, I set my target at the 64600 resistance level. Please share this idea with your friends and click Boost 🚀

BTCUSD Shows Potential for Forming a Head and Shoulders PatternBTCUSD is exhibiting signs that it may be forming a head and shoulders pattern, a critical development that could indicate a potential reversal in the current trend.
