Don't Short SupportYTD VPOC held nicely as support... A main LOI we had on watch for today
So far price has retraced >61% of yesterday's sell
ESM2017 trade ideas

breaker breaker trade love this setup on the daily.. you can take this setup with your stop right above that high and be content with the trade.

Trading Plan for Friday, April 5th, 2024Trading Plan for Friday, April 5th, 2024
Market Sentiment: Extreme volatility expected due to the recent selloff and NFP data release. Caution and adaptability are crucial.
Important Note: Nonfarm Payrolls (NFP) was released at 8:30 AM (EST). Expect outsized moves and volatility. Avoid predictions, and look for failed breakdowns as potential trade entry points.
Key Supports
Immediate Supports: 5203, 5196, 5190, 5181-84 (major), 5177, 5171 (major), 5163, 5155 (major), 5146, 5142 (major), 5136, 5127 (major), 5115, 5102 (major).
Major Supports: 5171, 5142 (important for long positions), and 5102 (major).
Key Resistances
Near-term Resistance: 5212 (major), 5221 (major), 5230, 5235, 5240 (major), 5250, 5257, 5266 (major), 5274, 5279, 5288 (major), 5294 (major), 5302.
Major Resistances: 5257, 5266 (major), 5288 (major), and 5310 (major).
Trading Strategy
Knife-Catch Mode: Exercise extreme caution and use small position sizes. Longs ONLY at major supports, prioritizing 5181-84, 5171, and especially 5142. Consider longs after a failed breakdown and reclaim.
Bullish Reclaims: If bulls regain 5212, watch for acceptance above this level before adding longs. Target level-to-level profits.
Short Opportunities: Look for back-tests of the 5235-40 zone as potential shorting areas, as it hasn't been fully retested from below.
Bull Case
Support Holds: Bulls need to reclaim 5241 to maintain control and set the low. Moves towards 5265 and 5288 are possible if this occurs. Short-term, reclaiming 5212 is essential.
Downside Magnet: If bulls make a strong move, 5143 is a significant downside target to watch.
Bear Case
Resistance Rejections: If bulls fail to retake 5212, expect a retest and rejection. This could open up a move towards 5194 for potential short entries (only if a bear flag establishes between 5212-5196).
News: Top Stories for April 5th, 2024
U.S. Jobs Report
Strong March jobs report with 303,000 positions added.
Unemployment rate down to 3.8% shows continued labor market resilience.
Impact on Fed's rate decisions uncertain, as wage growth easing.
Corporate News
Johnson & Johnson's $13.1 billion acquisition of Shockwave Medical announced.
Updates on Telecom Italia financing and China Oilfield Services operations.
Market Performance
S&P 500 hits all-time highs in March, strong Q1.
Nasdaq-100 projections point to good performance for 2024, with specific stock highlights.
Global Economic Indicators
Japan monitors volatile Yen movements.
Disappointing German factory data raises slowdown concerns.
India's strong economy leads to stable interest rates.
Energy Sector
Oil dividend stock recommendations for April.
Shell's gas output exceeds guidance.
Monetary Policy & Inflation
Fed remains inflation-focused, considering mid-2024 rate cut.
Developed market inflation expected to ease toward 2024 end.
Geopolitical Concerns
Questions emerge about reliance on U.S. nuclear capabilities.
U.S. strategic moves in managing China's growing power.
Technology & Disinformation
Chinese AI-powered campaigns targeting U.S. voters & Taiwan.
Market Outlook
J.P. Morgan sees a challenging 2024 ahead due to economic slowdown potential.
Overall positive 2024 outlook for U.S. stocks, experts discuss valuations and rate forecasts.
Reminder: Expect high volatility tomorrow due to NFP data and the recent sell-off. Adapt your trading size accordingly (1/4 size recommended). Focus on reacting to price action over any predictions.

MES Pickup! Solo Miny Chart Wrightdouble down on your MA to get better vission.
The vision is yours as is the world of knowledge. Consider all time frames when making a decision.

MES BUY ZONE? SoloMiny TEMPLATE FTW!Dress up our charts for better vision!
Utilize Both MA to get more analytics.

ES1! evening update(Possible) temporary top looks in. Bulls (in green) looking at zigzag to complete wave 4. Bears (in red) looking for formal impulse wave down.

ES - 15 min chartI talk about pump and dumps all the time, you can see that they did a low volume premarket pump and dumped on volume today.
It's too bad my 3 hr indicator didn't hit overbought on the pump, I was waiting for tomorrow to buy puts, lol.
It's funny how I said yesterday that I had no clue what was gonna happen today. Well, today would've been really hard to predict, that was the largest midday swing in over a year.

Spy/spx heading toward pervious supportSpy heading toward pervious support with the confluence of 200 moving average very good spot in term of risk and reward ratio
Buy weakness sell strength
Keep it simple

ES UpdateWow, RSI hit oversold already. I couldn;t figure out what was gonna happen yesterday, and there's really no way to have predicted this, lol.
We could see a bounce, but I'm not playing it. Staying cash.
ES UpdateSorry, slept in and missed all the fun.
Appears the algos are indeed doing the pump and dump regardless of intraday action. Why pump the market during the day when it's so much easier to do premarket on low volume? (Kinda reminds me of those meme stocks, lol)
Not gonna short anything until it gets overbought on RSI which should happen tomorrow on Ponzi Friday. Just keep in mind that there isn't any rule that says it has to get overbought on RSI, so not going long.
Basically I have no idea which way it gaps tomorrow, foreign markets didn't do much last night, this was mostly a premarket pump. I would assume pump and dump since it's Ponzi Friday tomorrow, but not confident enough to bet on it.

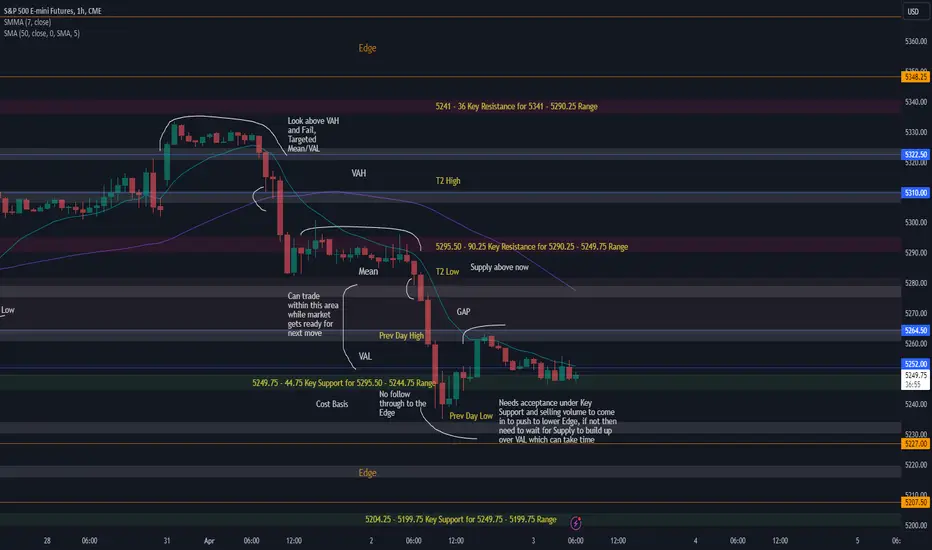
ES_F Updated chart for 04.01 - 04.05 Didn't post this weeks prep since last weeks was still in play but wanted to post an updated chart for a better visual of PA around the levels and structure we have been forming since last week. As mentioned we had this area under the Mean to fill out once we had the supply to do so, it took some time but we created the Supply for it and now are trading around these areas under the Mean filling it out.
Some notes going into rest of the week :
5249.75 - 44.75 Key Support at VAL has been holding all night, no continuation towards the Edge unless we accept under and more selling comes in to push us that way. If selling is not strong we can stay balancing in this VAL area around 40 - 60s with 5264.75 - 60.75 being our Intrarange Resistance if we build up enough we could try to push over towards 5275.25 - 79.25 Level to fill some of that Gap we have created above but need to be careful as we still have T2 and Supply above that Mean area which tells us any pushes over 64.75 could be met with selling once buying runs out and price can keep coming back inside VAL. We are currently inside 5244.75 - 5295.50 Range with Supply above so if we do hold this range for now we can expect to trade around the lower parts of it while supply is coming out. As mentioned Size shorts will be covering down at VAL and under it which can hold us up until they are done and then we will see if there is still Supply to take us towards the lower Edge or selling runs out and we try to head back inside the Mean for Supply but this can take time to play out.
Levels to Watch :
Key Support 5249.75 - 44.75 Need acceptance under AND stronger volume to try and push to lower targets if no volume then can keep trading around it.
Lower areas just in case are 5234.25 - 30.25 // 5219.75 - 15.75
Key Edge bottom and Supports 5207.50 // 5204.25 - 5199.75
Current Intrarange Resistance 5264.75 - 60.75
There is GAP above which means Supply, pushes over could be weak while still have selling but areas to watch above would be 5279.25 - 75.25
Key Resistance 5295.50 - 90.25
Return to value...ES now back into last week's VPOC - Full circle move.
Can buyers show a retest of the near-term range high?

Trading Plan for Thursday, April 4th, 2024Trading Plan for Thursday, April 4th, 2024
Market Sentiment: Uncertain, as traders weigh consolidation signs against the underlying bullish trend.
Weekly Volatility Risk: High (consolidation phase, earnings, Fed uncertainty)
Key Supports
Support Levels: 5266, 5257(major), 5246, 5241 (major), 5235 (major), 5231, 5222 (major), 5212 (major), 5208, 5203, 5196, 5192 (major), 5181 (major), 5171, 5163 (major), 5155, 5148, 5137 (major), 5126 (major), 5120, 5115, 5109 (major), 5105, 5092-95 (major)
Key Resistances
Resistance Levels: 5274, 5279 (major), 5285 (major), 5294, 5298-5302 (major), 5308, 5315 (major), 5322, 5329 (major), 5341, 5347, 5354 (major), 5363 (major), 5372, 5380 (major), 5392, 5400, 5408 (major), 5416, 5423-26 (major), 5435, 5447 (major)
Trading Strategy
Consolidation Zone: We're likely in a consolidation phase between 5241 and 5279. This requires flexibility and adaptability – overly aggressive trading will likely be punished.
Supports: Look for potential long opportunities at 5257 (if today's high isn't broken), with stronger plays at 5246 or the 5241-35 zone. Be cautious with longs above these levels.
Resistances: Shorting resistance areas carries risk in a bull market. Consider shorts near the 5298-5302 zone, primarily for scalps.
Breakdown Watch: A decisive break below 5235 activates the bear case, triggering breakdown setups. Remember, breakdowns often trap traders – patience is key. Look for a failed breakdown (rejection and recovery), then consider shorts with level-to-level targets.
Bull Case
Holding Support: As long as 5241-35 holds, bulls maintain control. Consolidation between 5241-5279 likely, followed by a potential breakout above the 5298-5302 zone. This could lead to retesting 5315+.
Expect Consolidation: We may not immediately reach new all-time highs. Be prepared for an extended consolidation period before the next push higher.
Bear Case
Key Breakdown Level: A strong break below 5235 signals a bear move. Look for failed breakdowns and bounces as shorting opportunities. Exercise caution due to the potential for traps.
News: Top Stories for April 4th, 2024
Federal Reserve Outlook
Fed signals continued focus on rate stability rather than immediate cuts.
Concerns remain about the potential impact on equities in the long-term.
Cryptocurrency Market Dynamics
Bitcoin surpasses $70,000 with continued bullish momentum.
Approaching Bitcoin halving sparks interest in the sector.
Global Economic Indicators
Eurozone growth strengthens, while major economies like Germany & France lag.
Inflation remains a concern, influencing the potential for rate adjustments.
Financial Services Sector
Outlook remains positive for financial stocks, with specific recommendations.
Increased focus on weathering rising interest rates & long-term market resilience.
Additional Market Updates
Risk-off sentiment following natural disasters in Asia.
Eurozone inflation data signals the potential for ECB rate cuts.
Warnings & Opportunities
Analysts express caution regarding select financial stocks before a potential crisis.
Technology continues to disrupt finance, with evolving focus on AI and blockchain within the space.
Important Reminder: Despite the potential for short-term pullbacks, the main trend remains bullish. Consolidation is likely. Prioritize adaptability, risk management, and reacting to the price action rather than relying solely on predictions.

ES UpdateRSI and MFI bounces as expected, chart pattern looks like a backtest than a rally. I cashed out earlier today, not sure which way the market gaps tomorrow, but I expect MFI to hit overbought so have an exit plan if you do short term trading.

ES UpdateRSI and MFI both hit oversold, flipped my puts. Didn't pick the best stocks to short so I made some money but not a lot.
THought about going long but I'll wait until this afternoon. Got other stuff to do, plus I'm always a bit too early anyways, lol.

wave 4 begin soon ?Inside market sentiment :
check out insider tracking of big tech company . there are almost 0 buying activity all of them is sell their share including big smart money like Warren Buffett
Charting :
Momentum indicators such as MACD ROC is show bearish divergence
Market Breadth indicators such as Mcclellan show divergence that mean amount of stock price begin not to going up many company as previous
Wave analysis is show that price is on up trend wave 3 but it seem to weak
Cycle analysis such as Hurst cycle trend to tell us that we already past peek of this sub cycle
so I ok to bet with RR=2 from that all information

Volume Voids Fill QuicklyFollowing up with a previously posted idea, the index reclaimed the prior day high and the key daily pivot.
What do we have above?
A volume void - Which tend to "fill" quickly, meaning price and exhibit momentum through those areas
Can be incredible setups if you are well positioned

Trading Plan for Wednesday, April 3rd, 2024Trading Plan for Wednesday, April 3rd, 2024
Market Sentiment: Cautious, price discovery after pullback in a strong uptrend.
Weekly Volatility Risk: High (price discovery, earnings season, potential FOMC pivot implications)
Supports to Watch:
Immediate Supports: 5245-5242 (major), 5235, 5232 (major), 5219, 5210-12 (major), 5203 (major), 5190, 5183, 5175-77 (major), 5171, 5162, 5155 (major), 5147, 5142, 5134-36 (major), 5126 (major).
Resistances to Monitor:
Key Resistances: 5259, 5267-69 (major), 5274, 5282-84 (major), 5293, 5300(major), 5307 (major), 5311, 5315 (major), 5321, 5329-33 (major), 5342, 5345 (major), 5352, 5357 (major), 5364, 5370 (major), 5380-82 (major), 5389, 5400 (major)
Trading Strategy:
Support & Resistance: Focus on potential bounces at support levels, notably 5242-5245 (triangle backtest) and the major support zones. Look for short opportunities at resistance levels, especially 5267-69 and 5282-84.
Knife Catch Mode: If sharp declines continue, be extremely cautious with longs, prioritizing major support levels only and following your rigorous knife-catching strategy.
Long Opportunities: Exercise patience if considering longs. Bids at 5242-45, with more confidence after a failed breakdown and reclaim, are possible. Consider potential adds above 5255.
Short Opportunities: Counter-trend shorting within the strong uptrend carries significant risk. Use extreme caution if considering shorts near major resistances. Watch for signs of a breakdown or retracement for better risk/reward entries. Target level-to-level profits.
Focus on Reactions: Don't force trades, be patient, and react to price action.
Bull Case
Triangle Backtest Hold: A successful hold of the 5242-45 triangle backtest, particularly if 5255 can be reclaimed, would signal potential for a rebound. This could lead to retests of 5267, a basing period, followed by a test of 5282-84, and potentially a move back toward 5300-07.
Bear Case
Breakdown Signals: Breakdown below 5232 could trigger selling pressure. Watch for shorting opportunities on failed breakdowns or bounces. Exercise patience as these setups often involve traps. First significant short target is likely around 5219.
News: Top Stories for April 3rd, 2024
Fed Policy Outlook:
Fed's report highlights financial sector vulnerabilities.
Markets expect a potential first interest rate cut in June, with an April cut possible.
Recent inflation data has moderated expectations for rapid easing of monetary policy.
Stock Market Performance:
S&P 500 reached new all-time highs in March, ending with its best first quarter since 2019.
Index gained 3.2% in March and is up 10.6% year-to-date.
April historically strong for the S&P 500, investors remain optimistic.
Economic Indicators:
Fourth-quarter GDP growth of 3.4% indicates resilience to rate hikes.
Bond market predicts the Fed will hold rates near-term, with potential cuts by June.
Global Developments:
China's service economy posts 15th consecutive month of growth, signaling recovery.
Cooling Eurozone inflation opens the door for potential rate cuts by the ECB.
Corporate News:
Agilent Technologies highlights new cancer research and diagnostics solutions.
Endeavor Group Holdings acquired by Silver Lake in a $13 billion deal, the largest in the media and entertainment sector.
Investment Considerations:
Earnings season may bring caution despite overall bullish market sentiment.
Potential pullbacks would be normal within the larger uptrend.
Climate Risk & Regulation:
The U.S. Federal Reserve has reportedly blocked a proposal to focus global banking regulations on climate risk.
Cryptocurrency & Blockchain:
Interest in cryptocurrency and blockchain technology remains high, with discussions on top investment opportunities and sector-wide adoption.
Remember: The market is reacting to a key support test within a strong uptrend. Be adaptable, manage risk, prioritize capital preservation, and always prioritize reacting to price action over any predictions.

S&P 500 (ES) Day Trading Analysis With Volume Profile 📊On S&P 500 (ES) it's nice to see a strong sell-off from the price of 5287. It's also encouraging to observe a strong volume area where a lot of contracts are accumulated.
I believe that sellers from this area will defend their short positions. When the price returns to this area, strong sellers will push the market down again.
The downtrend combined with the strong volume area along with the strong S/R area from the past are my main reasons for this short trade.
Happy trading,
Dale

#ES_F Day Trading Prep Week 03.24 - 03.29Last Week :
Last week we opened below 5227 - 07.50 HTF Edge but weren't able to hold under it, we got some selling from Edge area back down towards VAH but not strong enough to get inside or break it, for any continuation under we needed to get through it which didn't happen. Once we got back over the Edge on Tuesday and this time held above, we were able to put together a cost basis there and once we took out VAL of New Range above VAH became our Target. We didn't hit it same day but got to it after hours which we know has less volume so its easier to move the market. We ended up tagging top of VAH but no strong buyers came in to take us over and that's when we started building the supply to back fill back towards the Mean to end the week with a break back under 5295.50 - 90.50.
This Week :
So far going into this week we know we have sellers over VAH and unless strong buyers come in, our current ones don't need to pay over Value. It's also Month end and this is a perfect spot for size longs to be taking profits and closing things up, BUT look at the small distribution ranges we had rest of the week which tells us we don't have size sellers to give us big moves from here so we will most likely need to wait for Supply to build up if we want to see continuation under 95.50 - 90.50.
For now the Mean can act as support as shorts will be trying to cover at cheaper prices for the supply that falls under 5300. This might be a tricky week again and ranges could be small while we are building Supply, we can see some tighter range balances around this top of Mean/VAH area and need to be careful with longs because we do have sellers now and long trades might fizzle out quicker than everyone wants as shorts don't have to pay higher prices while we have longs unloading into the buying to close out the month. If we can't make a push or accept over VAH and build up enough supply we could see a move through the Mean towards VAL at some point, just have to be careful forcing it early as we may need more time to test around VAH before we have the supply to do that. IF we do run out of selling at VAH and accept over 5322.50 we could see a run at next Key Resistance area towards the Edge but for that we would need to build up under VAH and inside it as well. 5310 - 06 area can still be tested and maybe even over it at some point before we get a better failure to see a move to push us further trough the mean. Quicker trades without expecting too much follow through would be best bet until we see that we will be ready to move.
Levels to watch :
Supply is over 5310.50 - 06.50 Which makes it possible resistance or to look for look above and fail area. If we get through and don't fail we have 5324.75 - 20.75 as VAH top
and 5341 - 36 as next Key Resistance.
5295.50 - 90.25 is current Key Area but we can't really say its our Support or Resistance just yet even though we closed at/under it on Friday, this area can act as smaller Mean, but once we have enough Supply over it and can get through we can watch lower targets for Continuation
5279.25 - 75.25 is first spot to hit and if enough supply VAL area at 5264.75 - 60.75 would be a good spot to visit as well.
5249.75 - 44.75 is Key Support for anything under VAL.
It is a shorter Holiday week so we have to be careful and see if we get any moves out of this area at all or will we spend the whole week trading around Mean/VAH area if that will be the case 5310.50 - 06.50 // 5295.50 - 90.25 +/- is our current shelf and can see trading within/around until we will be ready to move.

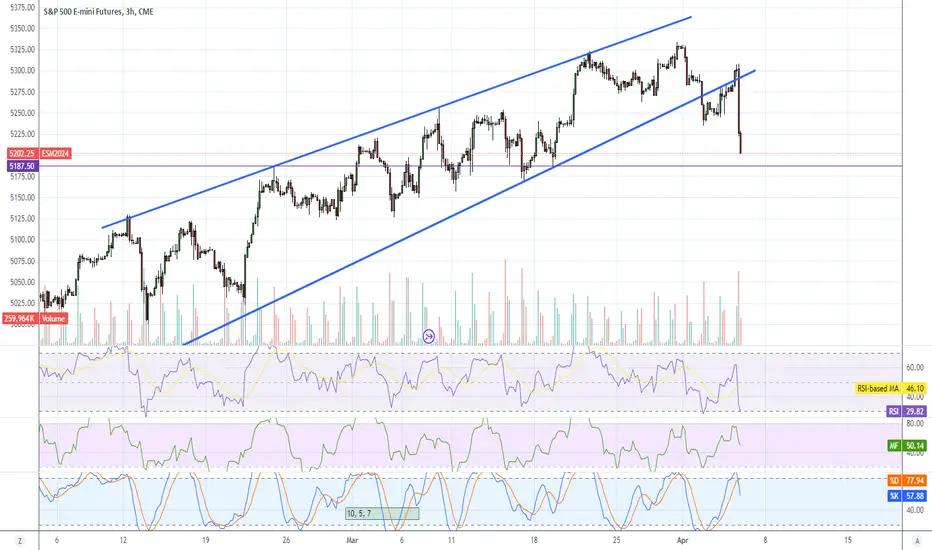
S&P500 TA: Return To The Mean? Bearish Div? PT 2000-2200?With individual names blowing up left & right, a new covid varient & margin debt at all time highs, could this finally be the top of one of the greatest bull markets in history?

Global Futures4/2/24 Global Futures:
S&P 500 ES1!
Nasdaq 100 NQ1!
Dow Jones YM1!
Euro Stoxx 50 FESX1!
FTSE 100 Z1!
China A50 CN1!
Nikkei 225 NKD1!
DAX FDAX1!

a daily price action after hour update - sp500Good evening and I hope you are well.
Today bears actually showed up and bulls began the profit taking. Very refreshing to see some two sided trading and not making more ath. I do think for all indexes the selling was strong enough to get another leg down, which then is mostly a third leg or W5 and markets are or will then trade at bigger support prices, trend lines and daily 20emas.
sp500
Yesterday I gave 5230 as a measured move target and low of the day was 5235, hope you made some.
bull case: Bulls are one more red day away from giving up control of the market and we go into neutral territory. 20ema was hit today but market closed above (currently around 5246). Bulls will probably get to the 1h 20ema and a retest of the breakout below the bull trend line (view chart). It’s already almost there and the reaction there is important. For bulls to retake full control, they need to break out of the red bear channel and trade above the 1h 20ema again, currently at 5270.
bear case: Market has now broken all bull trend lines and once we have a daily close below the 20ema, bulls are probably done. Retest of the breakout and upper bear channel line will probably happen in the Globex session and I expect market to hover around open/close price from today before EU session tomorrow. Bears want a third leg down which would bring us probably to around 5210/5200 and the chance that we break that on the first try is very low. Below 5200 is 5185ish next. Invalid above 5290.
short term: Sideways to down - bulls want back above 5290/5300 and bears want to stay inside the bear channel for a third leg down to around 5210/5200.
medium-long term: Below 5200 I keep my bearish thesis as drawn (weekly outlook). above we can go much higher before down. we could also range above 5000 for many months without going nowhere. I expect earnings to become weak in this quarter (Q1 - Banks begin reporting next week) but could take next one as well. —unchanged
trade of the day: Short at upper bear channel line and 1h 20ema. Perfect signal to short and was good for 61 points.
