ES poised to go higherIt looks like are going into a 5th wave complex, in trend, and impulsive.
looks at this time that the 4th wave i s complets, sideways correction
we will see
ESM2020 trade ideas

#ES_F Day Trading Prep Week 06.02 - 06.07Last Week :
Last week market opened up outside of Value, build some more supply then started the correction lower, we were able to move down to VAL where we found our first Support where we were able to do some covering but eventually we broke, held under and go continuation towards the Lower Edge, we were able to test its bottom where we ran out of Supply and got a sharp reversal back inside Value for a big move from VAL to VAH.
This Week :
Going into this week if we look at Structure we can see we did a look below VAL and fail which gave a return trip to VAH which we tagged, build more supply under and Failed which gave another round trip back to VAL and this time we tagged Key Support at 5249.75 - 44.75 and it acted as proper Key Support giving another big bounce all the way back towards Key Area and as we can see end of day push over 5295.50 - 90.25.
Globex consolidated over Key Area but was not able to hold and we got a flush back inside the Means of 5295.50 - 44.75 Range. This to me screams balance, and I think market will want to stay around these areas going forward until we will build up enough supply to accept under VAL or get stronger buyers to give us acceptance over VAH.
My bias is that we might not see higher prices over 5320-40s for some time but of course we never know and have to trade what market gives, for now I believe this current intraday range can finally become our balance range which we haven't gotten in some time, we have been moving ranges back and forth without spending too long in each and I think its about time we get some good balance action that can last a while.
The way I will be trading this we have our intraday range means at 5279.25 - 75.25 // 5264.75 - 60.75 this is the area where price might want to keep returning back into, pushes out of them can go towards the Key Edges of 5295.50 - 90.25 as our Resistance and 5249.75 - 44.75 but this is the time to be careful with looking perfect tags or too much continuation outside of Key Edges because if we have found balance we will look for any pushes out of the Means to return back either from failures at/above/below Key Support/Resistance or we could even see pushes out of means that will consolidate above/below without tagging Key Edges and then return back in, and when price is between this will be our balance/build up area.
Will continue trading this range until we can see clear acceptance Over or Under Key Support/Resistance and holds over/under VAH/VAL.
Levels to Watch :
Current Range 5295.50 - 5244.75
Means 5279.25 - 75.25 // 5264.75- 60.75
Key Resistance 5295.50 - 90.25
Key Support 5249.75 - 44.75
IF we do happen to leave balance and accept under/over the ranges would be
Above :
5341 - 36 Key Resistance
5324.75 - 20.75 // 5310.50 - 06.50 Means
5295.50 - 90.25
Below :
5234.25 - 30.25 // 5219.75 - 15.75 Means
5204.25 - 5199.75 Key Support

Watching for Make or Break?Watching carefully the blue horizontal line. If it doesn't break, I am almost certain to claim that a downtrend will be begin.


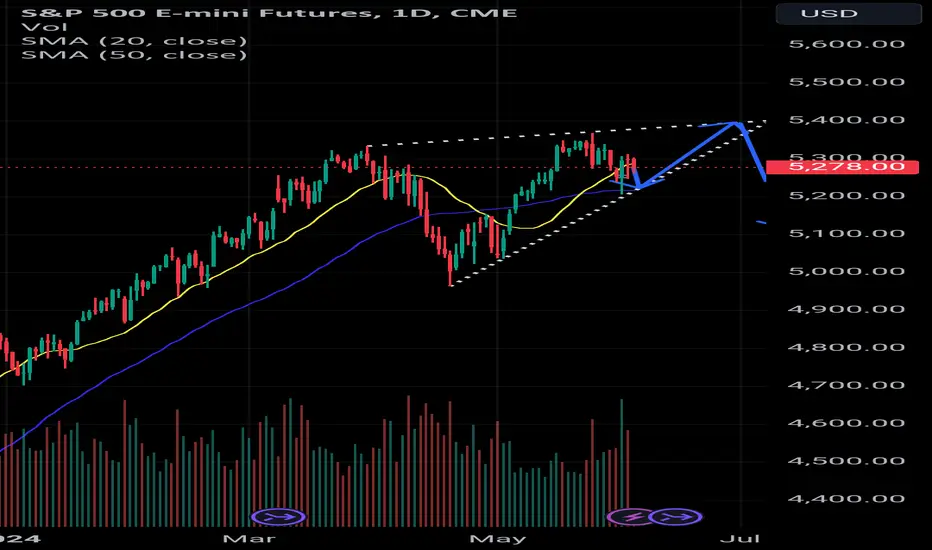
Rising wedge on the S&PWith the rejection of lower prices at the trend line, the S&P appears to be in a rising wedge at what I assume is the end of the uptrend. With FOMC meeting on the 12th, it could be the catalyst for more volatility. But with the VIX broken and a seemingly endless bull run, it is prudent to expect another wrench to be thrown into the fray before July. I'm watching for the pattern to complete by July 5th as of now.
Hey traders, it's Lord MEDZ here! In today's videoI'm excited to walk you through a fantastic trade I executed earlier on the Micro Nasdaq Futures (MNQ). Utilizing the ICT Fair Value Gap (FVG), Order Block (OB), and Market Structure Shift (MSS) strategies, I managed to achieve an impressive 11:1 risk-reward ratio within just 20 minutes, all during the New York power hour. We'll dive deep into the 15-second timeframe to break down every detail of this trade. Stay tuned to see how I leveraged these powerful tools to maximize my gains. Let's get into it!

ES1! afternoon updateThree examples of the .618 fib holding support since the low of 4963.50.
Bulls certainly seem intent on getting SPX to 6000. I think that as long as buyers are entering at and holding support at technical levels, no reason to doubt we see 6000 by the end of the year.

The Mechanics Of Trading - Part X - EOD 2 Min ES RecapPart X - End Of Day 2 Min ES Recap
I started this video because a friend asked me for help determining trends on multi-interval (time frames) and asked how I look at trading across multiple intervals. Asking how to best setup/use price trends to capture the best trade setups.
Essentially, it comes down to three key components...
A. Initial reversal/impulse waves should be traded lightly (if at all). They are the "potential price reversal setups" that are usually the most dangerous for traders (and often fairly short in length).
B. Looking for the second wave to form provides traders with the opportunity to catch the bigger Wave-3. This wave forms after the impulse (Wave-1) and a corrective wave (Wave-2), which must stay below any previous ultimate high or above any previous ultimate low.
C. Wave-3, and Wave-5 if applicable, are where traders can flex their muscles related to trade size using the techniques I present to try to capture the MEAT (Sweet Spot) of any trend.
Remember, after Wave-3, you must prepare for the potential end of a trend setup where volatility is likely to increase and risks become a bit more elevated.
I go over multiple techniques in this video.
Fibonacci techniques and Fibonacci Price Theory
Anchor Bars (breakaway bars)
Using Fibonacci Retracements to identify key support/resistance levels for trending
Stochastics
RSI
Wave formations (ZigZag)
and Others
This video is designed as an instructional video to help you incorporate usable techniques into your own trading style.
Hope you enjoy.

The Mechanics Of Trading - Part IX - ES Breakdown To SupportPart IX
I started this video because a friend asked me for help determining trends on multi-interval (time frames) and asked how I look at trading across multiple intervals. Asking how to best setup/use price trends to capture the best trade setups.
Essentially, it comes down to three key components...
A. Initial reversal/impulse waves should be traded lightly (if at all). They are the "potential price reversal setups" that are usually the most dangerous for traders (and often fairly short in length).
B. Looking for the second wave to form provides traders with the opportunity to catch the bigger Wave-3. This wave forms after the impulse (Wave-1) and a corrective wave (Wave-2), which must stay below any previous ultimate high or above any previous ultimate low.
C. Wave-3, and Wave-5 if applicable, are where traders can flex their muscles related to trade size using the techniques I present to try to capture the MEAT (Sweet Spot) of any trend.
Remember, after Wave-3, you must prepare for the potential end of a trend setup where volatility is likely to increase and risks become a bit more elevated.
I go over multiple techniques in this video.
Fibonacci techniques and Fibonacci Price Theory
Anchor Bars (breakaway bars)
Using Fibonacci Retracements to identify key support/resistance levels for trending
Stochastics
RSI
Wave formations (ZigZag)
and Others
This video is designed as an instructional video to help you incorporate usable techniques into your own trading style.
Hope you enjoy.

The Mechanics Of Trading - Part VIII - Learning PatiencePart VIII
I started this video because a friend asked me for help determining trends on multi-interval (time frames) and asked how I look at trading across multiple intervals. Asking how to best setup/use price trends to capture the best trade setups.
Essentially, it comes down to three key components...
A. Initial reversal/impulse waves should be traded lightly (if at all). They are the "potential price reversal setups" that are usually the most dangerous for traders (and often fairly short in length).
B. Looking for the second wave to form provides traders with the opportunity to catch the bigger Wave-3. This wave forms after the impulse (Wave-1) and a corrective wave (Wave-2), which must stay below any previous ultimate high or above any previous ultimate low.
C. Wave-3, and Wave-5 if applicable, are where traders can flex their muscles related to trade size using the techniques I present to try to capture the MEAT (Sweet Spot) of any trend.
Remember, after Wave-3, you must prepare for the potential end of a trend setup where volatility is likely to increase and risks become a bit more elevated.
I go over multiple techniques in this video.
Fibonacci techniques and Fibonacci Price Theory
Anchor Bars (breakaway bars)
Using Fibonacci Retracements to identify key support/resistance levels for trending
Stochastics
RSI
Wave formations (ZigZag)
and Others
This video is designed as an instructional video to help you incorporate usable techniques into your own trading style.
Hope you enjoy.

The Mechanics Of Trading - Part VII - 2 Min ES TrendingPart VII - Applying Success/Failure & Fibonacci Price Theory
I started this video because a friend asked me for help determining trends on multi-interval (time frames) and asked how I look at trading across multiple intervals. Asking how to best setup/use price trends to capture the best trade setups.
Essentially, it comes down to three key components...
A. Initial reversal/impulse waves should be traded lightly (if at all). They are the "potential price reversal setups" that are usually the most dangerous for traders (and often fairly short in length).
B. Looking for the second wave to form provides traders with the opportunity to catch the bigger Wave-3. This wave forms after the impulse (Wave-1) and a corrective wave (Wave-2), which must stay below any previous ultimate high or above any previous ultimate low.
C. Wave-3, and Wave-5 if applicable, are where traders can flex their muscles related to trade size using the techniques I present to try to capture the MEAT (Sweet Spot) of any trend.
Remember, after Wave-3, you must prepare for the potential end of a trend setup where volatility is likely to increase and risks become a bit more elevated.
I go over multiple techniques in this video.
Fibonacci techniques and Fibonacci Price Theory
Anchor Bars (breakaway bars)
Using Fibonacci Retracements to identify key support/resistance levels for trending
Stochastics
RSI
Wave formations (ZigZag)
and Others
This video is designed as an instructional video to help you incorporate usable techniques into your own trading style.
Hope you enjoy.

PUT Spread on /ES Neutral to Long strategy58 days out, Jul 26th
90% chance to win on this trade without needing to adjust
-4690 +4640 PUT side
$100 premium, $13 in fees, $697 capital allocated 12.4%
Will close around 50-70%
Next time doing one of these will aim for at least $100 post fees.

SP500**SP500:**
This week's forecast will be for the price to drop to the bottom of the channel and after that we'll have the scenario of the price continuing its descent to the 4,993 zone or reversing the trend and retesting the historical highs.

20240531 ESI anticipate more downside on 8.30 HI news, d ss raid and reversal to the upside for the rest of the day.

Overnight Price ACtion REview ESGoing over the price action Overnight ES looking for clues and what our plan for the day is.

Bounce by ES 5180 LONG from there.This is the additional Pivot level we added to the Indicator CD_Camarilla All_Levels, so it is the extreme of the extreme buy level. Buying at this level S6 is very safe, just like selling an ALL time High R6, which has never cost me.
If you dob't know about The Pivots study my Ideas. We had. run for 3 months with over 99 trades before we had a loss ( We sold R5, and the FOMC made a surprise RATE change which aused the market to go up for 2 months.
Lesson to be learned there is #1 always safe a stop outside the pivots range, a catastropic stop, not a "tight stop" whch the MM use to tforce overtrading. #2 Don't trade, as a rule, before an FOMC announcement. These are swing trades based on 60" to 6 hour charrts, The Pivots don't show up in daily and above charts.
If you understand what The Pivots are and how they work you know why. a days pivot range is created based on the previous intraday Pivots range.
My trades are also based on many other factors, elliot waves, TTM Squeeze Pro, Candlesticks, etc.
In a 6 hour chart we have a shooting star to continue down. No doubt we will explore S5 and possibly S6.
I have been posting Ideas for 8 years here. Look at my past posts.. 2019 i predicted we would go up for 5 more Ellitot waves before the first ATH Jan 22.
My next major post/Idee was March 2022, I shared that we had a "Tripple Thrust parrern from 2010 we went up on 3 sets of 5 waves up, corrected down from a lwer high, down for 6000 points on the NQ.
Then I posted we would continue up as part of Elliots, Grand Supercycle Bull Market to new ATH which we have all seen.
If you like my Ideas please follow me.
I called this a LONG, but don't buy before S5 or S6 next week.

ES1! big picture updateMy bullish count for ES1!. I have us in wave 3 of (5) of ((3)) of V.
It looks like wave 2 has completed. I expect ES1! to grind up the rest of the spring and summer, with target of ~6000 and the median line of the pitchfork drawn from COVID-19 low, January 2022 high and October 2022 low.

Upside move is expected for MondayContinuation of an upside move is expected for Monday in the S&P 500. Buyers entered the market on Friday. The challenge will be there ability to be consistent with additional moves to the upside.

Small Account Challenge Day 14 Update - +$1,788, 675% SPX WinToday was great, had some awesome short setups earlier in the morning and I was able to capitalize. Thankful to have $3k profit after the first 14 days. I'll be taking MIL:1K out so I'll be trading with profits from now on.

Fair Value Gaps With Fibonacci Has Changed My Trading ForeverGave yall this one last night for FREE
When we get the 618 Fibonacci in a fair value gap the win rate can dramatically increase
Got $3k on this trade in 15 mins I plan to share more
PLEASE DROP A LIKE AND FOLLOW!

#ES_F Day Trading Prep Week 5.28 - 5.31Last Week :
Last week Market opened over VAH and spent all week building Supply over it, as discussed in Sunday Prep since we were at ATH with no over hang we needed to wait for Supply to build up for any meaningful back fill of previous areas and that 5341 - 5290 might be our Range where price will want to stay around and keep returning into for some time while it builds that Supply.
On Thursday we ended up pushing inside the Edge but failed to find acceptance in it and the push back out gave us the flush of the inventory filling the buyers into the Value, even with how strong the move looked with break/hold under Key Support on Friday Globex failed to hold under it and we found our way back inside 5341 - 5290 Range where we were able to push back into the Means for the Range where we closed the week in VAH.
This Week :
Few things this week, we have Month End, Settlement changes from T2 to T1 which we don't know just yet how that will impact the trading and we had Holiday yesterday which pushed us over VAH and we are again building up Supply over it. For now we are inside T2 Range which was Thursday I believe the change goes in effect Today or this week, we are right around Previous Days Range and 5341 - 36 already showed us this morning that it's acting properly as good Resistance.
So far going into this week Thursdays flush showed us that don't have stronger buyers up here just yet who want to keep paying over Value and keep pushing us into new range above and that even with strong flush we didn't have enough Supply to accept under 5295 - 90 to continue filling more buyers into VAL.
This tells me again that market may want to stay in this 5341 - 5290 Intraday Range and balance around it, we have to be ready to spend quite a bit of time in these areas and trade around them until market will show us clear acceptance and intensions of moving Ranges and that can take some time because we are in a Key Spot on higher time frames we are at tops of Daily/Weekly Balances without finding acceptance above and without having the Supply just yet to move under the Middle of those balances which is around the 5290-80s area.
Plan is to continue trading 5341 - 5290 Range level to level just like last week with moves out of its 5324.75 - 20.75 // 5310.50 - 06.50 Means and then returns back towards/inside them. Failures to accept over 5341 - 36 will likely find their way back to/under 24.75 - 20.75, pushes under 5310.50 - 06.50 could also be absorbed under and find their way back to/over 10.50 - 06.50 and inside the Means we could balance. We are in lower volume times so also have to give time for the moves to properly set up and be ready to correct back.
Levels to watch :
Current Range 5341 - 5290.25
5341 - 36 Key Resistance
5324.75 - 20.75 // 5310.50 - 06.50 Means for the Range
5295.50 - 90.25 Key Support
If Accept over 5341 - 36 next Range 5386.50 - 5336
5356 - 52 // 5370.50 - 66.50 Means and Edge Top
5386.50 - 81.50 Key Resistance
If Accept under 5295.50 - 90.25 lower Range 5295.50 - 5244.75
5279.25 - 75.25 // 5264.75 - 60.75 Means and VAL
5249.75 - 44.75 Key Support

Trends Mixed; Overall Neutral Short Term on MarketsSo, as stated in the video, the shorter term timeframes of 30m/1hr/2hr have opened up to lower movements, while the 3hr/4hr/6hr have been violated and would call for a movement back up, but haven't shown that potential movement yet.
We are still in a short term Bullish Zone in accordance with my moving momentum algorithm, but we are very close to hitting below that Zero Line into Bearish territory, especially if we continue to stay low like this. What I may look for is a movement into the Bearish zone, a move upward, and if that movement upward doesn't bounce us back into a bullish zone I may short the market, but we shall see.
Overall long term, I'm curious if the Daily can push below and settle under 5160ish for a Lower Low. It would be the first time in quite some time that we had a lower low on the Daily trend, putting us at risk of getting a lower high Daily rebound that will call for markets to be on a decline.
Overall, The Mag 7, especially NVidia, still continue to mostly carry the market with the bulk of the Dow in neutral territory at best, and the Nasdaq outside of the Mag 7 also neutral. I continue to be concerned about this rally being too narrow and traders continuing to use Mag 7 stocks as safety stashes, and what will happen if they choose to take that safety money out to stash it somewhere else.
Trends into today are;
Last Macro Trend Signal Spots (ES Contract)
30m - 5319 Downtrend (5/28/2024) Lower Low
1Hr - 5313 Downtrend (5/28/2024) Lower Low
2Hr - 5309 Downtrend (5/28/2024) Lower Low
3Hr - 5286 Downtrend (5/23/2024) Higher Low
4Hr - 5286 Downtrend (5/23/2024) Higher Low
6Hr - 5287 Downtrend (5/23/2024) Higher Low
12Hr - 5188 Uptrend (5/6/2024) Higher High
Daily - 5330 Uptrend (5/15/2023) Higher High
Weekly - 4769 Uptrend (12/11/2023) Higher High
Monthly - 5304 Uptrend (03/31/2024) Higher High
Economic Calendar;
GDP Thursday
PCE Friday
Earnings to watch;
Salesforce AMC today
Costco earnings are tomorrow
My sentiment on the market is as follows;
Shorter Term - Bearish
Short Term - Bearish / Neutral
Medium Term - Neutral / Bullish
Long Term - Bullish
Basically, I don't see major risks in the long-term just yet, but the short term is a bag of mixed reactions. Currently in a place I feel we may need to look elsewhere. If you were looking for me to give you a warm and fuzzy on where to trade the ES Futures, I just can't give that today.
Safe trading and remember your risk management.

S&P 500: Already reached the summit?According to our expectations, the overarching wave (1) in magenta should extend to a new record high. Only after this impulse do we anticipate an extended wave (2) correction. However, please note our alternative scenario (38% likely). This option will be triggered if the key 4964 level is breached and implies that the price is already in the correction.
