ESM2024 long trade, stop and take profit in place ESM2024 long trade, stop and take profit in place as seen on the chart.
This is no financial advise! Do not risk real money on any idea published by us.
ESM2017 trade ideas

Trading Plan for Tuesday, April 23rd, 2024Trading Plan for Tuesday, April 23rd, 2024
Market Sentiment: Uncertain, with bulls and bears battling at key resistance after yesterday's recovery day.
Key Supports
Immediate Supports: 5040 (major), 5032, 5020 (major)
Major Supports: 4996 (major), 4959 (major), 4938 (major), 4903 (major)
Key Resistances
Near-term Resistance: 5057 (major), 5081 (major), 5102 (major), 5115 (major)
Major Resistances: 5129 (major), 5141 (major), 5167 (major), 5186-90 (major)
Trading Strategy
The 5040 Battleground Continues to be critical. Observe for breakouts or breakdowns with close attention.
Long Opportunities: Due to the choppy nature of the 5040 zone, direct bids are less reliable. Consider bids with a failed breakdown at 5032 or on major supports (4959, 4938). Prioritize the knife-catch protocol for deeper longs.
Short Opportunities: Look for backtests of 5081 and particularly 5102 for shorting. A breakdown below 5020 could open up downside targets.
Profit-Taking: On shorts, consider taking profits entirely at major levels, especially given ES's tendency to short squeeze.
Bull Case
Holding Support: Defending the 5040 zone is encouraging for bulls. Re-tests and quick recoveries signal buying strength.
Reclaiming Resistances: Bulls need to push above the 5081/5102 zone for a sustained recovery attempt.
Adding on Strength: Breaks and acceptance above 5057 could offer opportunities for adding to long positions. Observe closely to ensure it's not a backtest for a downside rejection.
Bear Case
Breakdown Signals: A convincing break below 5020 triggers the downside move, likely targeting 4975 or lower. As always, be wary of traps – look for a bounce/failed breakdown first, then consider shorting with level-to-level profit-taking.
News: Top Stories for April 23rd, 2024
Economic Environment
US GDP growth and the impact of interest rates on corporate America.
IMF projections for global economic growth and inflation expectations.
Bond market signals regarding Federal Reserve policy.
Market Analysis
Upcoming economic data releases: GDP estimate and key inflation measure.
Reminder: The market is reacting to a mix of earnings reports, economic data, and the critical battle at the 5040 resistance. Prioritize risk management and adapt your trading strategy accordingly.

Index Futures: April 22nd-26th, 2024Bearish Index Futures:
-Expecting a run on Monday's high, from inside the htf key levels.
-Would like to see the market eventually turn from there and target new lows on the month.
-Waiting for dollar to sync before expecting sustained bearishness into the htf targets.(Wed-Friday)

ESM2024 (S&P500) neutral atm, no further shorts allowed for nowWe are neutral on S&P futures after the recent drop. It is too early in the week to determine a high probability bias. We have taken out fridays high today (5058), and we might see further retracment to the upside. We are not considering a short bias on the daily chart, unless ESM2024 daily candle body closes below 4984. Until we get more insight troughout the week, we will stick to intraday scalping only.
There is potential buyside liquidity remaining at 5095 and sellside liquidity at 5006.
We will see if tomorrow gives us a setup to engage either one. As of now, I think 5006 sellside is the more likely one.
This is no financial advise! Do not risk real money on any idea published by us.

Bouhmidi-Bands and Overnight Session - Name of the Game The overnight range was the name of the game today. As mentioned earlier, we were looking for a potential break in either direction. After establishing the initial balance, we saw a test of the overnight session low (5019), which was successfully defended. Subsequently, buyers entered the market, leading to a push higher in $ES. This move broke the high of the overnight session (5036), confirming bullish momentum and surpassing the previous day high (5058) & upper #BouhmidiBand, reaching a peak at 1.3s BB (5074). In the last 1.5 hours, NYSE:ES retraced back within the Bouhmidi-Bands.

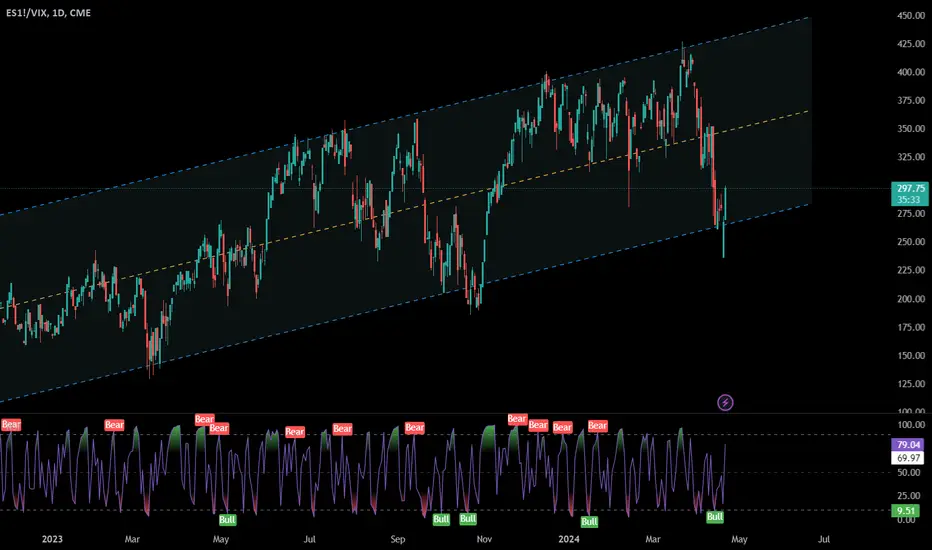
SP500 reversal in progressfrom the sp500/vix ratio it emerges that there is an increase in the relative strength of the stock market compared to the fear index. We could witness a bull market reabsorbing the bearish excess of the month of April
ES updateNQ and RTY filled the gap from yesterday, but ES still has a small open gap. Also, MFI isn't moving much. I see lots of stuff in the red as well.
Running errands today, staying out.

ES Scalping Zones 4/22If daily gap holds then upside targets
*5021.5 then 5026.5-5037.
For downside targets
*4997-4991 and if that fails 4974
Daily Trend Tracker
*DXY - Bullish - *VIX - Bearish - *US10Y - Bearish
Follow Jbetrading on X for more in depth analysis across multiple asset classes.

ES UpdateMFI went oversold last night, but there's also an open futures gap. Don't have time to watch the market today so I took the easy money and cashed out. I think it'll double bottom before going up because of the open gap. Guessing TSLA tanks on earnings.
Gold down big caused Brazil (EWZ) to go red. Barely made any money on those calls.

NY Open breakout This idea is based on 8:30 ET Breakout candle..
This is Silver Bullet strategy buy a bit more aggressive.
Reason being is that, Previous week was over extended to the downside and expect a retracement bullish short term..

Trading Plan for Monday, April 22nd, 2024Trading Plan for Monday, April 22nd, 2024
Market Sentiment: Uncertain, with bulls and bears at a crossroads. Geopolitical risks remain a factor, and market reaction to earnings reports and economic data will be crucial.
Key Supports
Immediate Supports: 4996-5000 (major), 4990, 4975 (major), 4966
Major Supports: 4958 (major), 4937 (major), 4904-08 (major), 4878 (major)
Key Resistances
Near-term Resistance: 5013, 5027 (major), 5039, 5045 (major)
Major Resistances: 5081 (major), 5108 (major), 5125-30 (major), 5146-50 (major), 5190 (major)
Trading Strategy
Geopolitical Awareness: Remain vigilant about weekend news developments and potential market impact.
Long Opportunities: Due to potential volatility, exercise caution with long positions. Prioritize bids at 4975 (a reaction may signal buying strength) or on failed breakdowns of overnight lows at 4963. For deeper longs, focus on major supports (4937, 4904), utilizing the knife-catch protocol.
Short Opportunities: Look for backtests of 5045, 5081, and particularly 5108 for shorting. A breakdown below 4958 could open up downside targets.
Profit-Taking: On shorts, consider taking profits entirely at major levels, especially given ES's tendency to short squeeze.
Bull Case
Reclaiming Resistances: Bulls need to regain control by reclaiming 5045 and pushing back into the red channel/flag around 5108 for a sustained recovery attempt.
Holding Support: Defending the 4996-5000 zone is encouraging for bulls. If 4958 holds on a retest, it may signal a relief bounce.
Adding on Strength: Breaks and acceptance above 5013 could offer opportunities for adding to long positions. Observe closely to ensure it's not a backtest for a downside rejection.
Bear Case
Breakdown Signals: A convincing break below 4958 triggers the downside move, likely targeting 4937 or lower. As always, be wary of traps – look for a bounce/failed breakdown first, then consider shorting with level-to-level profit-taking.
News: Top Stories for April 22nd, 2024
Economic Environment
IMF Global Financial Stability Report highlights optimism and expectations for policy easing.
Verizon earnings report provides insights into the telecommunications sector.
Focus on big tech earnings and their potential impact on market trends.
Monitoring of economic indicators: commodity currencies, Asian shares, European currencies, and industrial output data from Poland, Taiwan, and China.
Market Focus
Sector analysis: Focus on communication services and energy sectors.
Upcoming economic events: employment report, CPI report, and Bitcoin halving.
Additional Market News
Earnings season: Focus on major bank reports.
Regulatory and legal updates: SEC activities and discussions on college debt and retirement planning.
Reminder: The market is reacting to a mix of geopolitical events, earnings reports, and economic data. Prioritize risk management and adapt your trading strategy accordingly. Let me know if you have any further questions or would like changes made!

doji == moment of rest between the bull and the bearsI'm seeing EWT numbers as high as Fibonacci 1.618 or 5443.75.... However my knowledge of the pivots tells me, we are at just about at S 4.3 5009 and I think the market will raise. to R5 or R6 the normal Pivots cycle from daily lows, S5-S6 where we buy and daily highs R5-R6 where we sell. Kauai Dave's Pivots Traders.

ES Weekly Levels (Apr 22-26)Here are my levels after a few weeks off. Bullish trend was broken with the drop below the upward trendline. Now trading below key emas. Green box represents important support as price pulls back to key fibs and the 200 sma. Watch for outsized move in either direction due to option volatility. Bounce back into the ema cloud or break of support are equally possible.
SUMMARY
ES posted a weekly loss of 3.15% after trading in a huge 249 pt range
ES is now below the 2021 high and the 9/21/55 emas
Price has fallen for 6 consecutive sessions.
R2 = 2021 High (5092)
R1 = MTF 236 Fib RT (5052)
S1 = Mar 29th High (4924)
S2 = MTF 382 Fib RT (4885)
Bias is now down to sideways as the upward trendline has been broken.
200 SMA price magnet in play
Strong bounce from 200 sma/ trendline support is possible
Econ data this week includes PMI on Tues, GDP on Thurs & PCE on Friday
Huge week for earnings with Mega caps reporting including MSFT, TSLA, GOOGL & META.
Global event risk is high
Rate sentiment has changed from rate cut to rate hold or raise due to persistance inflation.
RSI 29.68| VIX at 18.70 | 10 year 4.62%

Trend Extend SPX short term futures bullThis algo and automatic drawing system can indicate that an oversold short term furtures index price can retrace to trend extend levels.
the projection in the algo and short term futures or money network index risk may accumulate according to trend regularity 33, with automatic drawings suggesting a cross.
a bear pullback could look like something as indicated on the chart, where the market overall USI:TICK SP:SPX $DXY/SPY is still a weekly sell.

US futures are fallingUS futures are falling
ES1! = 4971.25 low
NQ1! = 17,213.50 low
YM1! = 37513 low
RTY1! = 1920.8 low

Where does the danger live?My God. If the SETUP used is correct, technology companies will melt the SPX index.
I won't even write a text explaining why, because no one likes reading.
I will post the bearish pivot combined with a buy trap. What a thing, right?
Supports: 4933 for the moment. Medium-term secondary support (15/20 days): 4742.
I'd better keep quiet. Because things always turn out the opposite of what the graphs show. However, they will never stop occurring at a given future moment. 30 days. Lol
Medium-term bearish pivot.
All short-term bearish pivot targets have been caught. And in this time frame there are no signs of a change in the corrective direction, therefore, the medium and long-term target presented above is the most sensible for the moment.
Do your analysis and good business.
Be aware, if you buy, use stop loss.
See other graphic analyzes below!

#202417 - a weekly #priceaction market recap and outlook - daxDax
Quote from last week:
bear case: Bears showed strength this week and bulls continued to take profits. Every bounce was sold and this pull back is now as deep as the one we got from mid 2023-12 to early 2024-01, which is around -4%, which is, given the +28% rise, almost nothing. Now we are at the first very important level to determine the strength and speed of this market cycle. If we bounce here and markets shakes off all risks again, we could stay inside a trading range at the highs, or we fall through 18000 and get the first leg of a new bear trend. It is very unusual for markets to go from one trend to another but it can happen. But betting on it, is usually a losing strategy. Bears did an amazing job and closing 2 bull gaps in 2 weeks and their next target is to keep a pull back very shallow to trap many late bulls. The perfect scenario for bears could be as drawn but I do think this is low probability. It’s more likely that we will see a bounce here. A retest of the extreme is almost always expected.
current market cycle: Bear trend - all bull trend lines but the one from the Covid lows are broken and the only thing right now keeping this from a panic sell, is the weekly 20ema around 17500. Could it also be the daily 50ema (around 17925)? Sure, who knows for certain? Both are reasonable arguments.
key levels: strong support 17900/18000 - 18400 (unsure where resistance will be, we have to find out. 18400 is my next best guess but could very will be 18600)
bull case: Bulls bought aggressively at the 2024-03 low, which was their last hope to stop the flush to 17000/17150, which produced a big bullish reversal bar on the daily chart. They desperately need follow through above 18000 on Monday.
bear case: My bearish wave thesis was drawn 2 weeks ago and right now I’m unsure about end of the bigger W1 where W5 should lead to below 17200. So case a is, the darker red I to V wave, which would result in a bigger bounce now for II, to form a broader bear channel. Case b would be to continue inside this very narrow bear channel with very small intraday pullbacks that get sold immediately, very much analog to the bull trend we had from mid 2024-02. Case a is much more preferred because it’s low probability to not get a bigger bounce around big support areas. If bears manage to print below 17600 again, this might just go straight down to 17000/17200. Bears doing an amazing job of continuously selling the 4h 20ema, the 9th time now since the ath. That is unusual to say the least.
outlook last week: “Tricky one this week but bear with me. It’s an easy if statement. IF tail risks (mainly middle east) continues to get worse, we could see a very deep sell off. Like -4 to -5% deep to 17000. IF market shakes it off and we see strong buying pressure at this key level, we can see a big bounce, targets are 18400, 18600 and retest of ath 18800...."
→ Last Sunday we traded 18082 and now we are at 17925. Market sold off hard to 17607 but bulls reversed it. So outlook was meh, given that we just moved sideways on the week.
short term: Absolutely neutral as of this posting. Tough spot right here where you should not engage new trades until we see more price action. Market is in balance around 17900-18000 area until one side clearly break out of it. Below 17900 is retest of 17600 and below that is probably 17200. Above 18000 is the upper bear channel line 18100ish and above that I’m unsure. Could be 18200/18400. I wait.
medium-long term: Third red week in a row, which has not happened since 2023-10. We need to see a proper bounce to calculate new targets or bears just grind this down inside the narrow bear channel.
I expect at least a -20% correction in 2024. —changed -30 to -20% because price is moving higher while time is getting shorter for the target. Medium term is 17100 while I think we can touch the big bull trend line starting 2022-10 around 16700 in 2024. —unchanged part
Chart update: Chart updated with my preferred wave thesis I to V.

ES1! - Selloff In The WorksYesterday I posted analysis for ES but unfortunately, it was for the previous contract month meaning that all analysis made is negated.
Assuming this was posted on the Sunday, i was looking out for sellside to be swept, which eventually happened but it's pointless me saying that is what i was on a lookout for when the move has already played out.
Overall, i am still short until the liquidity voids is met @ 5075 - 5055 but the main point of interest was sellside located at 5157 which has already been met.
The run up to weekly buyside @ 106.006 has been booked, as anticipated from last week. With my overall target of 106.006 met, i am expecting a minor retracement before a continuation up into the 14th Nov 22 lower displacement fair value gap.
This could take a few weeks to pan out. but i will be keeping this analysis updated throughout the week.
My philosophy is simple...
Fortify Michael J Huddlestone's concepts that I have studied to consistently predict where the market is more likely to go.
This includes;
- Market Structure
- Buyside/Sellside Liquidity
- Order Blocks
- Liquidity Voids
- Fair Value Gaps
- Optimal Trade Entry
- Premium/Discount Array
- SIBI/BISI
- Many More!
The strategies mentioned here are some of many that I use to implement into my analysis and over time, with consistency I aim to achieve a high degree of accuracy in the markets with the foresight and understanding to assess what went wrong when my bias is negated.
Credits;
- Michael Joe HUDDLESTONE
- Shawn Lee POWELL
- Toray KORTAN

ES1! - Macro Bulls Loosing Power?Throughout the last few weeks, ES has gently tricked to the upside but this week is looking a bit different.
Throughout the weeks, from the beginning of 2024, there has not been a bearish market shift in structure before repricing to the upside yet but with Wednesday, Thursday and Friday being down close days, sellstops could be i danger of being liquidated as near lower highs has formed whilst pushing on further to the upside.
My bias for ES is bearish this week into the daily fair value gap located from 5092 - 5020.25 with consequent encroachment being @ 5056.

Price action Review friday 4/19Price action after thursday night's geopolitical spike returns to normal.
After the spike the ES retraced to the 6pm open creating a text book ICT bearish breaker pattern. Reaching down to the NY Midnight opening price. Then bouncing up reaching into the first Pd Array above equilibrium (FVG) creating another bearish breaker pattern which re-established the weekly bearish trend.

SPX Oversold with an UptrendThis chart shows an potential revesal point in the S&P500. A tradeable 38% retracement rally is probable here.

SP500 SELL after US open and FIB retracementIdeas to seek a short trades in a trend with a FIB retracement.

spy My Nasdaq 3M view #spy #stockmarkets #StockMarket #stockMarket #trade #trader #technicalanalysis AMEX:SPY NYSE:ES #es1
