ICT UNICORN setup on ES 5MThere is ICT Unicorn setup on ES 5M chart. I marked with red lines FVG high and low which align with breaker block. I will go for new daily highs for RR 1:2
ESH2023 trade ideas

11/29/23 Market Check11/29/23 Market Check:
S&P 500
Nasdaq
Dow Jones
10 yr Bond
EUR/USD
Bitcoin
Oil
Gold

ID: 2023 - 03411.20.2023
Final trade of the year - 2023.
A combination of multiple strategies placed into two differing expirations. Closely monitored and prepared to make max of three (3) adjustments prior to years end.
Happy Trading All!
-kevin

ID: 2023 - 02911.1.2023
inception price action
Non-directional trade.
Unbalanced Butterfly Trade - NEGATIVE leaning Delta Bias going into FOMC and NFP this Friday.
29th trade for this calendar year.
There will be no resting GTC orders on this trade as it will be aggressively managed going into the end of the year.
Anywhere in the "peak profit" zone is where maximum profits occur.
Happy Trading All!
-kevin

11/27 Trading Plan - Monday Recap and Day Ahead📊 Recap
Today's newsletter provides a comprehensive look at the current market situation, emphasizing the S&P 500 Futures and the essential strategies for upcoming trading sessions.
📈 The Markets Overnight
Asia: Mixed
Europe: Down a bit
US Index Futures: Down slightly
Crude Oil: Up a bit
Dollar: Down slightly
Yields: Up slightly
Crypto: Up slightly
🌏 Major Global Catalysts
Saudi Arabia is actively seeking allies for a production cut before the OPEC+ meeting scheduled for Thursday.
🔍 Key Structures
A significant breakout from a 4-month downtrend channel occurred on November 14th, influenced by CPI data. This bullish setup has sustained its momentum, with minor sell-offs being quickly absorbed. The S&P 500 Futures are currently consolidating under 4580, hinting at a potential upcoming move.
📉 Support Levels
4536-42: Crucial zone, acting as a major support.
4507: Notable support from mid-November.
4491-95: Key level from September's downturn.
4445, 4436-32: Secondary support zones.
4385: Represents the lower bound of a potential pullback.
📈 Resistance Levels
4620-22: Ultimate target, connecting historical highs.
4580: Recent resistance, tested last Wednesday.
4565: Immediate resistance zone.
📝 Trading Plan
Remain alert for support levels, especially around 4555 and 4535, to hold for continuing the bullish trend. Key resistances at 4580 and above may offer opportunities for adding strength. Watch for breakdowns below 4535 as a sign of a potential trend reversal.
💡 Wrap Up
The current market condition is a blend of strong bullish trends and consolidation phases. It's vital to stay aware of major support and resistance levels and adapt strategies accordingly. The market remains in a delicate balance, with potential for both continuation and reversal of the current trend.
Disclosure: This is not financial advice and is for informational purposes only. Please consult a professional financial advisor before making any investment decision.

ID: 2023 - 03011.3.2023
THIS IS A BEARISH LEANING TRADE!
A lot of ground has been covered in the past few days, and global uncertainty is at all time high. Not to mention going into years end with election nonsense, coupled with depressed VIX levels. This market is ripe for a moderate to potentially significant pullback.
This trade is bearish by nature, coupled with the fact that if I am too early with execution, I can follow the market up and add more tranches - this current trade plan includes adding capital up to three more times.
Lastly, I am utilizing a small portion of this years already realized gains, in order to potentially double YTD returns. Risk 1: Return 5 if this trade plays out as planned. This is how professionals trade. ;)
Happy Trading All!
-kevin

ES1 futures Short.Price broke through a big multiday trendline up. I'm expecting a sell down to November's cost basis so that we can back fill some of the trapped short positions and check if there still is buying demand and buyer retention. If both are present and no supply hits the market then we are going back up.
The vix is also at a very low point relative to the past 2 years, so puts are cheap for a good rr.
Central banks seem to be restarting the liquidity cycle, which would be beneficial for stock prices, but I believe that we have not felt the full impact of the tightening that happened over the previous year. However, the economy can be in shambles and stock prices can keep going up - so just trade your set ups when they are available.

BUY ES - ICT BULLISH BREAKER ON 15MES made bullish breaker on 15M chart tapping the lows of the day and targeting at least Asia session high.
Entry at FVG/breaker block high. I would call it almost ICT Unicorn setup though FVG is not exactly aligned with breaker block.

ES Spike and Channel Back Down To 4100 NOV False RallyI am expecting this spike and channel to fail any day now as it is falsely breaking out of the top of the channel. Failure of this pattern will put price back inside the down channel.
I am also expecting a substantial move down to 4400 for a false move in a bear flag under the hourly 200sma.
I am then expecting a sharp rally that coincides with the Santa Rally back up into the red resistance line of 4421.00 followed by another leg down to take out November lows and 4100.00
I currently have a short position initiated on November 22nd at 4563.75 with my target at 4100.00
As soon as this spike and channel pattern fails, I am expecting some major selling to come into the market.
In my humble opinion, this parabolic fake rally was just a stop hunt/ short squeeze to get more order flow into the market before another leg down.
I also expect that this will be the last leg down in this complex bull flag consolidation and once we get down to the 50% mark and the weekly 200sma that major buying will come into play for the next 26% rally of about 1100 points to top off at 5250 at/around January 2025.
I am expecting after 5250, a 36% sell off back down to 3150 at/middle of 2026.
Of course, all of this dictates how price will behave at these levels/times but I will be planning my moves based on this plan.

ES In Complex Bull Flag Consolidation Pattern Still Bearish 3950In this uptrend on the daily chart, price is in a complex flag pattern consolidation. I believe it is about half way through with another leg down to complete the measured move.
The evidence that leads me to believe that this parabolic run up the last few weeks is false is
1. Parabolic run up to stop hunt the shorts that got it right
2. Sucker in more longs
3. Hit gap resistance
4. False break out of the top of the flag channel from a million miles away, The best breakouts happen building up right near the top of the channel, not from the next planet over.
5. The stop losses on all the longs are down there at 4000 area
6. The weekly 200sma, which is rising by the way, is hugging right under the channel bottom in the same direction and degree of slope
7. The peak formation low at the beginning of the year is down there. ES loves to trade into peak formations

Data-Driven Bearish Option SentimentTo complete the image, it is necessary to encourage the bulls with the sharp upward movement. After a drop below 4500 occurs, it will indicate the beginning of a correction.

SPY ANALYSIS 11/27As, of this morning PCC is at 1.026 so there is a high interest for shorts- this is the perfect condition for a short squeeze. Even though the trendline broke I am expecting a a liquidity grab. On the high time gram I see a head and shoulder forming with a clean trendline break- so I will target short term liquidity to be safe.

ES/SPY Weekly Levels (Nov17-Dec1)ES is locked near Mid-time frame 786 Fib just above the Aug 16th high. Market has gained 10% + after making a V-bottom on Oct 26/27th. Makes sense for price to trade sideways to down for a bit. Santa rally effect still in play going into the new year but tax loss selling season is also upon us so some early Dec weakness is possible.
SUMMARY
ES finished the week with a gain of 1.29 % after trading in a range of 58 pts.
ES finished 4th positive week in a row consolidating above the Aug 16th high
Jul 27th high within striking distance, but pullback possible as price is extended and at pivot resistance
First resistance is 886 Fib RT (4618)
First support is Aug 16th high (4505)
If price breaks the 886 Fib a move to 4700 is likely
If price breaks below the Aug 16th high a move to 4400 is likely.
Consumer Confidence data due out Tuesday and PCE data due out Thursday.
Earning season winds down with reports from CRWD, CRM, SNOW, ULTA, DLTR & KR
Black Friday/Cyber Monday sales to offer insight about US consumer.

SPX ShortWEEKLY SP:SPX UPDATE
pivotal week ahead expecting reversal of intermediate uptrend with important signals for #consumption #china #housing and #inflation
watch out for...
Tue: #ConsumerConfidence
Wed: #ChinaPMI
Thu: #PCE
Fri: #PMI #PowellSpeech
still flat - short entry imminent

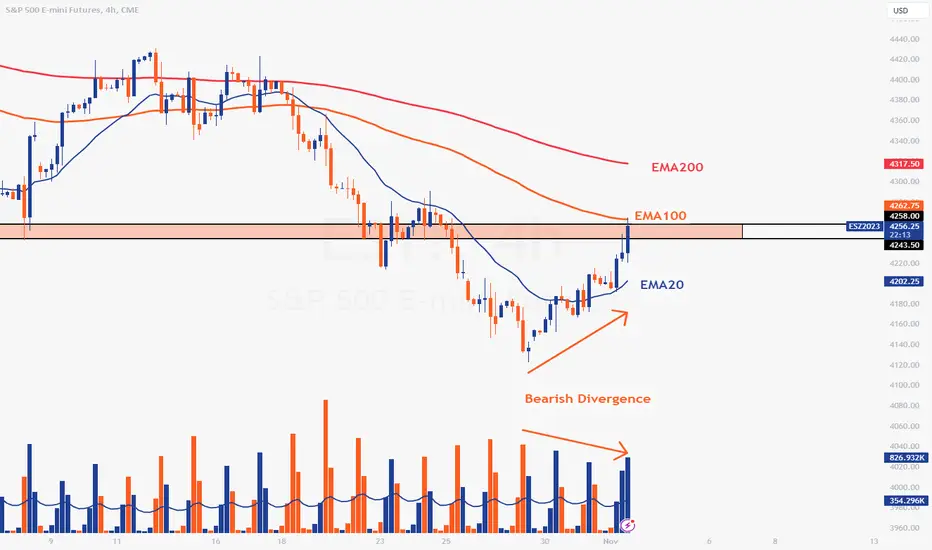
SPY | TA | POST FOMC AMEX:SPY
Trendlines:
The chart showcases three Exponential Moving Averages (EMAs): EMA20 (blue), EMA100 (orange), and EMA200 (red). EMAs are used to identify trends over different periods. Here's what we can infer:
The EMA20 is currently below both the EMA100 and EMA200, suggesting that in the very short term, prices have been trending lower relative to the more extended periods.
The fact that all three EMAs are relatively close, with the price oscillating around them, may indicate a lack of a strong trend in any one direction.
Price Action:
It looks like there was a previous downtrend, as seen by the succession of lower highs and lower lows. Recently, however, the price has shown signs of a potential reversal or consolidation.
The price is currently testing the EMA100, which can act as resistance in this context. A break above this EMA could be bullish, whereas failure to surpass it might lead to further declines.
Bearish Divergence:
This is highlighted between the price action (which is making higher highs) and the momentum indicator below (which is making lower highs). This divergence suggests that while prices are increasing, the underlying momentum is weakening. Bearish divergences can be a precursor to potential price declines as they may indicate a loss of buying pressure.
Volume Bars:
The volume bars, shown in blue and orange, represent buying and selling activity, respectively. An increase in volume can validate the strength of a move. Here, we can notice some significant selling volume bars recently, which could be a cause for concern if you're bullish.
Overall Impression:
The chart appears to be at a critical juncture. The recent price action is testing significant resistance levels (EMA100), and the bearish divergence suggests caution. The next few trading sessions will be crucial in determining the potential trend direction.
Futures forming possible inverse cup & handleWaiting for a handle on the chart which should hopefully signal a downward trend for futures. I see a possible inv h&s forming on the 5 day. 👀

ES Outlook for 11-27 Week We are approaching an area of resistance with the composite value area from the ATH lingering above us. Does not mean we will see a sharp rejection, but could mean that buyers really need to step up or else we risk a phase of balance and or rotation lower.

ES - Neutral - 4th Week of NovemberAdmittedly my bias on ES is contradicting my bias on NQ. ES is still respecting bullish PDAs but also failing to displace above highs. ES still has 60 day highs in tact. If these highs are not taken out by Wednesday, I will consider the possibility that the high of the week has been established. DXY also still has 60 day lows in tact so a reach higher on ES is not out of the picture at all. Neutral here on ES & am able to play both sides. I will be scalping this week until a clear displacement lower occurs.
The 4 Hour /ES Chart Has a 3 Marching Lemmings Warning Sign.The /ES forming a "three marching lemmings" MACD warning sign. This is when the product makes at least 3 successive highs, but the MACD makes 3 successive lows. This could indicate a near term change in direction, if a break of a defined trendline occurs.

ES chart bias analysis for next week/monthWe have liquidity a daily sweep and price have been failing to close above the high. We are in a bullish market, however for price to keep going up, it needs some fuels. So this week and the first weeks of December we might experience a bearish retracement for price to reach the ultimate buyside liquidity before the end of the year.

Updated SP500 Analysis. FORECASTS REMAINS UNCHANGEDHas Elliott Wave Lost Its Forecasting Accuracy?
I cannot recall the exact setting, but many years ago I was asked this specific question…
” …as the number of practitioners of Elliott Wave Theory grows due to its popularity, won’t more people be trading these wave patterns and in doing so, somehow skew the theory’s efficacy”?
It’s a great question.
One in which I think requires a more nuanced, rather than simple answer. Forecasting markets using Elliott Wave Theory (EWT) is only as accurate as the practitioner. With respect to EWT, if one could consider being in a renaissance of sorts, I would say, now is that time, because of the increase in practitioners . Since R.N. Elliott’s final published work, Nature's Law –The Secret of the Universe published in June, 1946 several individuals have contributed to the theory in incremental ways. However, this article is not about the history of Elliott Wave theory, but a thought experiment in the continued efficacy of what I would consider to be the only effective and comprehensive analytical tool that describes the price movements of markets.
If there is one phrase, I have used over the years to explain short term pattern ambiguity it would be…
“Nothing clears up the current price action, like more price action”.
Meaning, at times, an objective practitioner of EWT can decipher a pattern in different ways, and what will deem the current pattern, optimal , will be the price action that follows. This is the primary reason I include alternative counts within all my published work. However, I am a purist in the pursuit of arriving at a truth. Using EWT, I find the truth mostly has two potential outcomes, and only the price action that follows will lean more so towards one, rather than the other. That is why I believe that when one shares their work with the public, (like here on Trading View) it should be their own work, and not a concoction of other people’s work posted on the Internet, and peddled as one’s own. As a trader, I think there are no rules that govern the pursuit of profit. As an analyst, I believe when sharing an analytical forecast, it should be the work of the one posting. Explaining how I determine some people are posting analysis that is an aggregation of other public postings is of less importance than remaining on topic in relation to the efficacy of EWT in forecasting. Last year, I was rated the top author on Solana, a crypto currency. I no longer share my analysis on Solana with the public. However, a quick search of current analysis on Solana yields ideas that lack context, or make bold predictions, that I can say are not based on a rules-based forecasting tool like EWT. This is one method I use to discern the analysis is either not their own, or is not worthy of using hard earned money to get behind. Solana, as a chart falls into the category of having one primary analytical thesis, and an alternate for me. Ironically, in this case, they both point higher towards triple digits. I see nothing posted on Solana here that contains the context of why prices have moved higher and where they will go over the very long term. Additionally, there is nothing contained with the Solana chart that tells me new lows are option to be considered. Yet, some with say that is precisely where that crypto currency is headed.
I often wonder when substandard analysis is shared with the public does it change the optimal pathway of correct analysis. It's impossible to know for sure. However, it seems reasonable to think that the longer-term targets would not change, but the smaller timeframe sub-divisions might. This may lead to more short term complex patterns, but in the grand scheme of things, the efficacy of EWT I do not think is harmed. Traders who follow EWT analysis may find mixed results. That is why if you follow anyone else's analysis on the Internet, make sure they are providing details, context, the nuance behind what could happen, versus shallow context and a lack of a well thought out thesis. It is possible, you're reading someone's else's work, interpreted and passed off as their own.
This leads me to my updated analysis on the SP500.
My last post on the SPX futures was on October 28 which was one day after the market bottomed. The purple pathway I deemed low probability. In retrospect, this is precisely what has played out. However, now that price has rallied swiftly higher, I have to consider yet another possibility.
The blue count in the chart above.
As of this morning, both my primary black, and first alternative count, has the index in a c wave lower towards the lower 3,000 area. Black subdivides more so than purple, but they ultimately arrive in the same area. The blue count requires some explanation and the context to warn followers of this sort of price action will play out. Regardless of my primary, first or second alternate counts, a retrace should begin soon. In the case of black and purple, those retraces turn into impulsive patterns towards my target. However, in the case of the blue second alternative, that retrace will take the form of a 3-wave pattern, but ultimately reconcile higher. This resulting higher price action can be for a new high in primary B, or an even higher high resulting in new all-time highs, as v of 5 of Supercycle wave (III). The interesting aspect of either of those moves higher results in an ending diagonal by virtue of overlap that occurred on October 27th 2023.
THIS WILL RESULT IN A MARKET CRASH SCENARIO.
Price will return to their point of origination, which in the case of a new primary B wave high, that price originated at 3502 in October of 2022. In the case of new all-time highs for wave (III) in the super cycle degree, that is the Covid-19 bottom at 2191, which occurred in March 2020. Therefore, I'll conclude by saying that we should all expect a retrace lower to start as early as next week. To what extent, will determine the direction of the SP500 into the first half of 2024. Is there a possibility of the index making a new high? Current price action suggests I cannot rule that out...but so far, (Even this very impressive November 2023 rally) leads me to believe anything has occurred to make me change my original forecast of 3200-3300 in the SPX Futures.
If we do decide to go up and make new highs...I think for this trader, that may be cause to get flat assets in general and to the degree it makes sense. I'm referring to assets directly AND indirectly associated with the stock market.
Best to all,
Chris

11/25 Trading Plan - Friday Recap and Day Ahead🔄 Recap
In the past month, the S&P 500 Index Futures (ES) has demonstrated an unusual bullish trend, closing four consecutive green weeks. Notably, after breaking out of a downtrend channel on November 14th at 4425, the market has largely maintained an upward trajectory. This breakout signifies a classic technical analysis pattern typically seen in 4-month downtrend reversals.
🔍 Key Structures
4620: Represents a significant trendline connecting the January 2022 COVID bull market high with the August 2022 most recent high.
4577-80: A major resistance level encountered back in late August/early September.
4536-42: A critical horizontal zone that served as key resistance during the summer of 2023.
Other Notable Levels: 4507, 4488-90, 4445, 4436-32, 4408-11, and 4390.
📉 Support Levels
The primary support levels to monitor include 4507, 4488-90, 4445, 4436-32, and the critical 4408-11 zone. These levels have historically played a significant role in the market's movement and will be crucial in determining future trends.
📈 Resistance Levels
Key resistance levels to watch are 4577-80, the upper zone of 4536-42, and the overarching 4620 level. These levels have previously acted as barriers to upward movement and will be critical in assessing the potential for continued bullish momentum.
📝 Trading Plan
Supports to Monitor: 4554, 4549, 4542, 4535, and other major supports down to 4408-11.
Resistances for Potential Reversal: 4565, 4572, 4580, and upwards to 4620.
Bull Case Scenario: Maintaining above 4542-36 on dips to continue the bullish trend.
Bear Case Scenario: A breakdown below 4536-42 could signal a short-term bearish shift.
🔚 Wrap Up
As the market transitions from the Thanksgiving holiday, traders should be prepared for potential volatility and abrupt changes in direction. The emphasis should remain on trading within pre-planned, high-conviction zones and reacting to market shifts rather than predicting them. The approach for Monday hinges on the market's ability to sustain support levels, particularly around 4542-36, to continue the upward trend or signal a bearish reversal if these levels fail.
Disclosure: This is not financial advice and is for informational purposes only. Please consult a professional financial advisor before making any investment decision.

A clear deviation between NQ and ES CME_MINI:NQ1! CME_MINI:ES1! We can see that the ES chart is weaker and more "bearish" than the NQ. That means in the next week open if ES breaks the checkpoint "1" we can easily see an ATH for NQ , because we have already broken the checkpoint "1" on NQ . So I think the direction and the sentiment of NQ are highly based on whether ES breaks above or bellow the checkpoint "1" . We should also wait to see where the weekly gap will open. Up or down the current weekly close.
