Macquarie group - positional longStock is making a rounding bottom that indicates accumulation & getting ready to break the next big resistance.
Daily closing above 183 can lead to 192 and 200 levels. Keep a stop loss below 174 in this trade. If a closing comes above 200 levels, then stock price can increase by 10-15 % very quickly
Next report date
—
Report period
—
EPS estimate
—
Revenue estimate
—
6.01USD
2.21 BUSD
19.48 BUSD
360.04 M
About MACQUARIE GROUP LIMITED
Sector
Industry
CEO
Shemara Wikramanayake
Website
Headquarters
Sydney
Employees (FY)
20.67 K
Founded
2006
ISIN
AU000000MQG1
FIGI
BBG000P0WYL8
Macquarie Group Ltd. operates as a non-operating holding company. The firm engages in the provision of banking, financial, advisory, investment and funds management services. It operates through the following segments: Macquarie Asset Management (MAM), Banking and Financial Services (BFS), Commodities and Global Markets (CGM), Macquarie Capital and Corporate. The MAM segment delivers investment solutions to clients across a range of capabilities, including infrastructure, real estate, agriculture, equities, fixed income, private credit, liquid alternatives, and multi-asset solutions. The BFS segment offers personal banking, wealth management, business banking, and vehicle finance products and services to retail clients, advisers, brokers and business clients. The CGM segment comprises of integrated, end-to-end offering across global markets including equities, fixed income, foreign exchange, and commodities. The Macquarie Capital segment includes capital solutions across products and sectors including infrastructure, green and conventional energy. The Corporate segment refers to the head office and central service groups, including group treasury and other investments. The company was founded on December 10, 1969 and is headquartered in Sydney, Australia.

Macquarie Ltd AustraliaSun Storm Investment Trading Desk & NexGen Wealth Management Service Present's: SSITD & NexGen Portfolio of the Week Series
Focus: Worldwide
By Sun Storm Investment Research & NexGen Wealth Management Service
A Profit & Solutions Strategy & Research
Trading | Investment | Stocks | ETF | Mutua

MQG Buy Zone $148-164Forever collecting this one. Long-term hold as it has always trended upwards.
They are one of the largest investors in renewable energy which has a chance to really take off in our current climate...no pun intended.

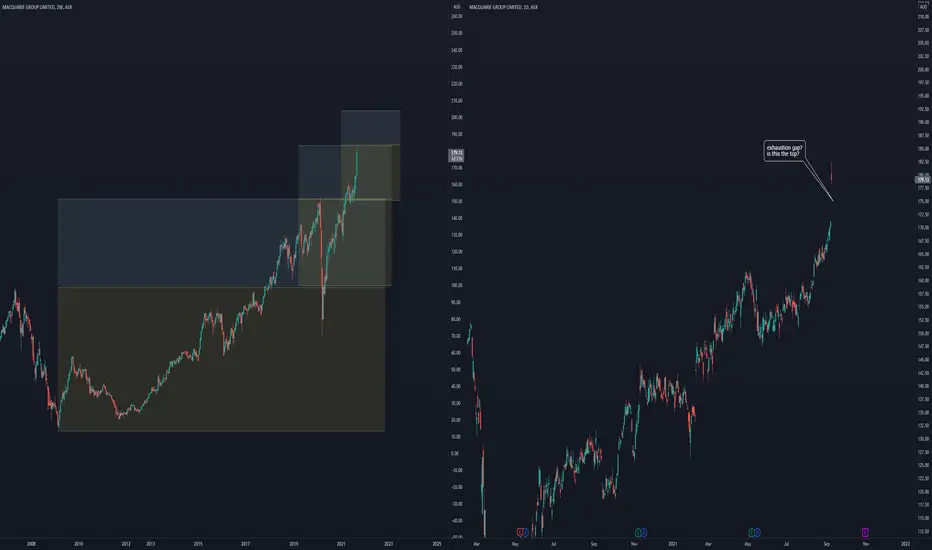
MQG to the moon?I tried to find some measured moves in MQG. the two lines marked "=" were the first two I found. I also over laid the same measure on two earlier ramps.
It does look like tat measured move could spell the end of the run of MQG for the time being?
I don't use fundamentals, but I would be keen to

current price looks overvaluedcurrent price looks overvalued, it may down to 175 level.
Mqg have the potential to go 246 in the long run

MQG @ 4 NOV 2021Text me if you have any questions/comments for me.
-----
MQG
- Previous analysis was done on 23 Sep (red arrow) -> Suggested entry around $178 levels if believe the stock can create new all-time highs
- Since then, the stock tested the $182 resistance for 2 weeks before breaking out strongly
- The

MQG @ 23 SEP 2021Text me if you have any questions/comments for me.
-----
MQG
- First time doing a written analysis on MQG
- Stock has a history of uptrend that is punctuated with sideways movements
- Usually, a low volatility stock that doesn’t have strong pullbacks (less than 10%)
- Stock would fit traders/inves

topping signal is in for MQG1. there is an exhaustion gap on the daily chart. (bearish)
2. fibonacci levels show a resistance level has been met. (2 week chart)
Macquarie hedgeI'll use MQG as a hedge against my current long stonks position.
MQG has been highly re-active to the previous sell-off & since recovery.
I'll be buying PUTS (out of the money) upon confirmation

Trading Diary - August MQG trading strategyThis post is purely for recording my self trading actions. Not an advice to anyone.

See all ideas
Trade directly on the supercharts through our supported, fully-verified and user-reviewed brokers.


Frequently Asked Questions
The current price of MCQEF is 122.25 USD — it has decreased by 0.12% in the past 24 hours. Watch Macquarie Group, Ltd. stock price performance more closely on the chart.
Depending on the exchange, the stock ticker may vary. For instance, on OTC exchange Macquarie Group, Ltd. stocks are traded under the ticker MCQEF.
MCQEF stock has fallen by 0.12% compared to the previous week, the month change is a 5.01% fall, over the last year Macquarie Group, Ltd. has showed a 1.34% increase.
We've gathered analysts' opinions on Macquarie Group, Ltd. future price: according to them, MCQEF price has a max estimate of 142.40 USD and a min estimate of 110.79 USD. Watch MCQEF chart and read a more detailed Macquarie Group, Ltd. stock forecast: see what analysts think of Macquarie Group, Ltd. and suggest that you do with its stocks.
MCQEF reached its all-time high on Mar 30, 2022 with the price of 155.00 USD, and its all-time low was 9.75 USD and was reached on Mar 2, 2009. View more price dynamics on MCQEF chart.
See other stocks reaching their highest and lowest prices.
See other stocks reaching their highest and lowest prices.
MCQEF stock is 0.12% volatile and has beta coefficient of 1.33. Track Macquarie Group, Ltd. stock price on the chart and check out the list of the most volatile stocks — is Macquarie Group, Ltd. there?
Today Macquarie Group, Ltd. has the market capitalization of 47.12 B, it has decreased by 1.32% over the last week.
Yes, you can track Macquarie Group, Ltd. financials in yearly and quarterly reports right on TradingView.
Macquarie Group, Ltd. is going to release the next earnings report on Nov 1, 2024. Keep track of upcoming events with our Earnings Calendar.
MCQEF earnings for the last quarter are 3.57 USD per share, whereas the estimation was 3.71 USD resulting in a −3.77% surprise. The estimated earnings for the next quarter are 3.17 USD per share. See more details about Macquarie Group, Ltd. earnings.
Macquarie Group, Ltd. revenue for the last quarter amounts to 5.85 B USD despite the estimated figure of 5.98 B USD. In the next quarter revenue is expected to reach 5.84 B USD.
MCQEF net income for the last quarter is 1.32 B USD, while the quarter before that showed 879.53 M USD of net income which accounts for 49.62% change. Track more Macquarie Group, Ltd. financial stats to get the full picture.
Macquarie Group, Ltd. dividend yield was 3.20% in 2023, and payout ratio reached 69.83%. The year before the numbers were 4.27% and 55.40% correspondingly. See high-dividend stocks and find more opportunities for your portfolio.
As of May 17, 2024, the company has 20.67 K employees. See our rating of the largest employees — is Macquarie Group, Ltd. on this list?
Like other stocks, MCQEF shares are traded on stock exchanges, e.g. Nasdaq, Nyse, Euronext, and the easiest way to buy them is through an online stock broker. To do this, you need to open an account and follow a broker's procedures, then start trading. You can trade Macquarie Group, Ltd. stock right from TradingView charts — choose your broker and connect to your account.
Investing in stocks requires a comprehensive research: you should carefully study all the available data, e.g. company's financials, related news, and its technical analysis. So Macquarie Group, Ltd. technincal analysis shows the sell today, and its 1 week rating is buy. Since market conditions are prone to changes, it's worth looking a bit further into the future — according to the 1 month rating Macquarie Group, Ltd. stock shows the buy signal. See more of Macquarie Group, Ltd. technicals for a more comprehensive analysis.
If you're still not sure, try looking for inspiration in our curated watchlists.
If you're still not sure, try looking for inspiration in our curated watchlists.