AMZN : Mid-Term Bullish Continuation OutlookAmazon is shaping a constructive bullish sequence on the 4-hour timeframe, with recent price action reinforcing renewed upside momentum. The unfolding structure suggests buyers may remain in control as the market progresses into December, keeping the continuation scenario active while the current rh
Key facts today
Next report date
—
Report period
—
EPS estimate
—
Revenue estimate
—
7.20 USD
59.25 B USD
637.96 B USD
9.69 B
About Amazon.com, Inc.
Sector
Industry
CEO
Andrew R. Jassy
Website
Headquarters
Seattle
Founded
1994
ISIN
US0231351067
FIGI
BBG000BVPV84
IPO date
May 15, 1997
IPO offer price
18.00 USD
Amazon.com, Inc. engages in the provision of online retail shopping services. It operates through the following business segments: North America, International, and Amazon Web Services (AWS). The North America segment includes retail sales of consumer products and subscriptions through North America-focused websites such as amazon.com and amazon.ca. The International segment offers retail sales of consumer products and subscriptions through internationally-focused websites. The Amazon Web Services segment involves in the global sales of compute, storage, database, and AWS service offerings for start-ups, enterprises, government agencies, and academic institutions. The company was founded by Jeffrey P. Bezos in July 1994 and is headquartered in Seattle, WA.
Related stocks

Amazon 🎯 Key Levels & Risk Management
Critical Support: $215 or the Year-To-Date (YTD) Anchored VWAP. These levels must hold to maintain the bullish structure.
Stop Loss: A close below $215 invalidates the long thesis.
Bullish Target/Flow: Huge institutional interest observed with $250 Calls (May '26)—ov

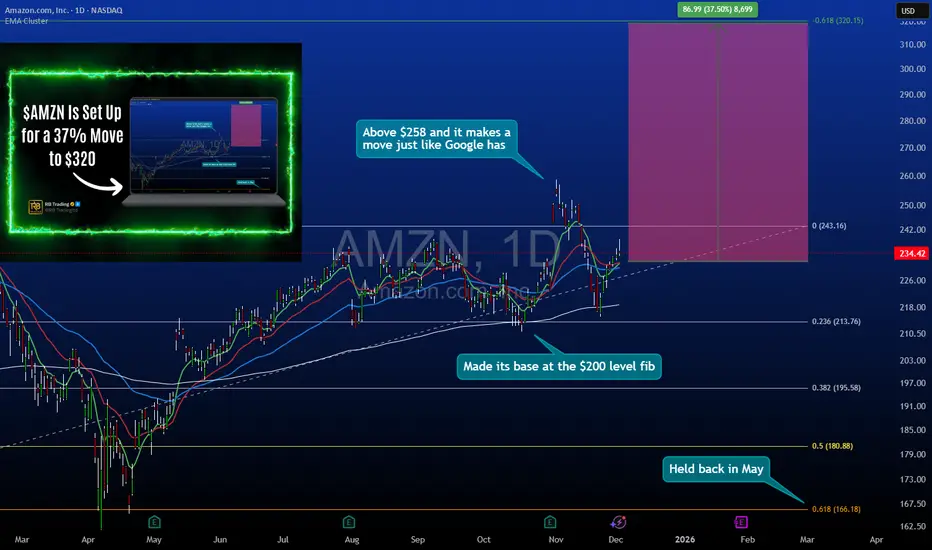
Amazon - Big Tech Pullback Strategy Into $232 SupportAmazon Multi-Month Position Build: $232-234 Entry Zone Targeting $320
Amazon has pulled back into a critical support zone at $232-234, presenting the same geometric retracement setup that recently validated on GOOGL. This analysis breaks down why this level offers favorable risk/reward asymmetry fo
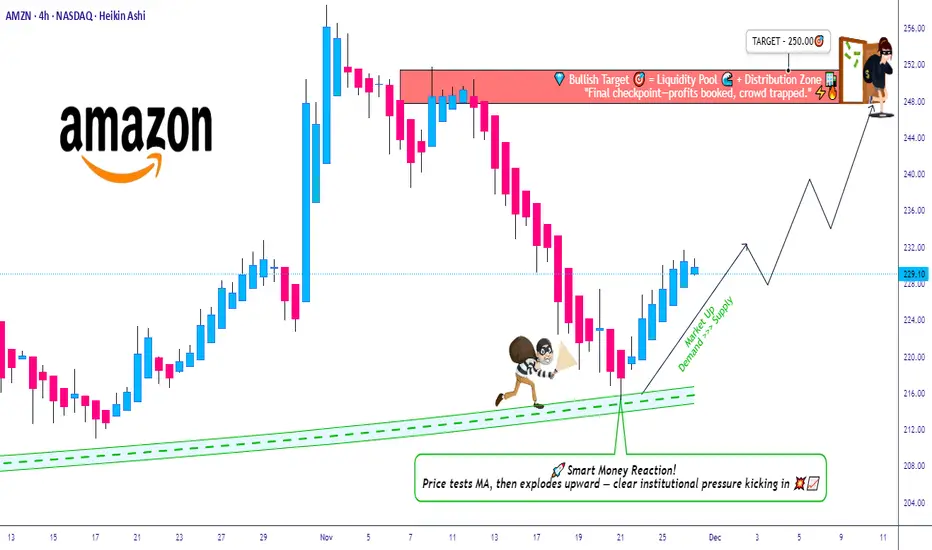
AMZN Breakout Reload? TMA Pullback Shows Buyer Strength🔥 AMZN Swing Trade Profit Playbook | Bullish Pullback + Thief Layering Strategy 🟢📦
Welcome back, Ladies & Gentlemen — the Thief OG’s 😎🕵️♂️
Here’s a polished, rule-friendly breakdown of the bullish setup developing on AMZN (Amazon.com Inc.) – NASDAQ.
📌 Market Context
AMZN is showing a clean bullis
Amazon (AMZN) Falters, Bears Eye 200 EMAI’m wondering whether Amazon has seen a major top on 3 November, given it saw a large gap into the high before momentum turned lower. This has the hallmarks of a ‘blow-off top’, which can occur at major turning points when bulls push a stock higher with such force – often via a gap – as a kind of ‘l

AMZN Weekly Outlook — Contrarian Put Opportunity📊 AMZN Trading Information
AMZN | QuantSignals V3 Weekly | 2025-12-01
🔹 Primary Direction (Weekly): BUY CALLS
Confidence: 58%
Risk Level: High (low confidence + mixed signals)
🔹 Katy AI Direction: BUY PUTS
Predicted Move: -1.38%
Katy Confidence: 50%
⚠️ Directional Conflict Detected
📈 Price +

The Role of the Bond Market in the Global Market1. Foundation for Government Financing
One of the primary roles of the bond market is enabling governments to finance their operations, budget deficits, infrastructure development, and long-term national projects. Every country—whether a developed economy like the United States or an emerging marke
AMZN: Bullish Outlook Post-Black Friday Surge
Title:
AMZN: Bullish Outlook Post-Black Friday Surge
Greetings, Traders!
🌟 Hello everyone,
As we analyze Amazon (AMZN) following the recent Black Friday and Thanksgiving sales, we notice a strong bullish sentiment emerging. The online sales surge of **3.1%** provides a solid foundation for p

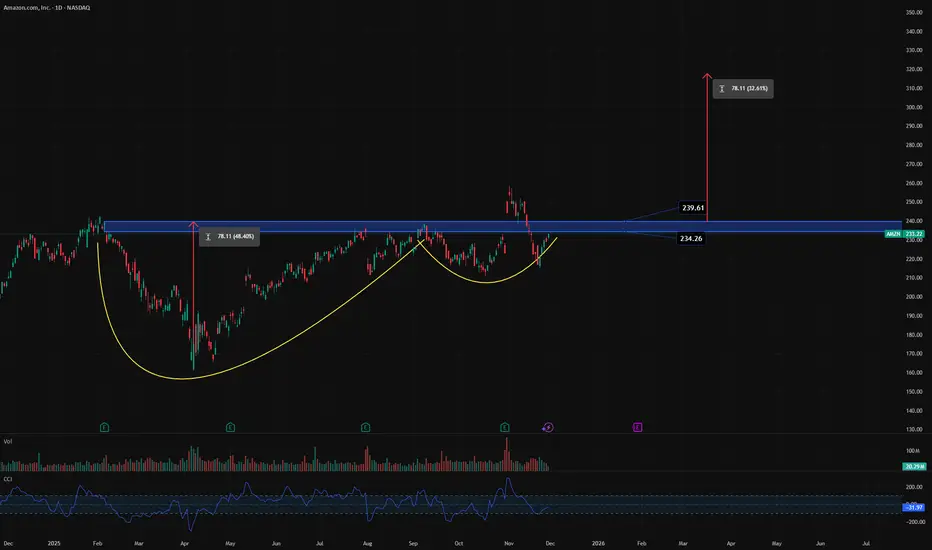
AMZN with a high pontential to go upNASDAQ:AMZN with potential to rise 32 precnt if it will break the resistance
AMZN🌎 Amazon After Q3: Strength, Strategy, and Attractiveness
A Crash Against a Background of Strength: Amazon shares experienced a short-lived correction along with the broader market, but this move was driven more by general sentiment than by changes in the company's fundamentals.
Quarterly Re

See all ideas
Summarizing what the indicators are suggesting.
Neutral
SellBuy
Strong sellStrong buy
Strong sellSellNeutralBuyStrong buy
Neutral
SellBuy
Strong sellStrong buy
Strong sellSellNeutralBuyStrong buy
Neutral
SellBuy
Strong sellStrong buy
Strong sellSellNeutralBuyStrong buy
An aggregate view of professional's ratings.
Neutral
SellBuy
Strong sellStrong buy
Strong sellSellNeutralBuyStrong buy
Neutral
SellBuy
Strong sellStrong buy
Strong sellSellNeutralBuyStrong buy
Neutral
SellBuy
Strong sellStrong buy
Strong sellSellNeutralBuyStrong buy
Displays a symbol's price movements over previous years to identify recurring trends.
AMZN6237342
Amazon.com, Inc. 5.55% 20-NOV-2065Yield to maturity
5.60%
Maturity date
Nov 20, 2065
US23135CK0
Amazon.com, Inc. 4.1% 13-APR-2062Yield to maturity
5.54%
Maturity date
Apr 13, 2062
US23135CC8
Amazon.com, Inc. 3.25% 12-MAY-2061Yield to maturity
5.53%
Maturity date
May 12, 2061
AMZN6237344
Amazon.com, Inc. 5.45% 20-NOV-2055Yield to maturity
5.47%
Maturity date
Nov 20, 2055
US23135CJ3
Amazon.com, Inc. 3.95% 13-APR-2052Yield to maturity
5.46%
Maturity date
Apr 13, 2052
AMZN4531868
Amazon.com, Inc. 4.25% 22-AUG-2057Yield to maturity
5.46%
Maturity date
Aug 22, 2057
AMZN4996701
Amazon.com, Inc. 2.7% 03-JUN-2060Yield to maturity
5.45%
Maturity date
Jun 3, 2060
US23135BT2
Amazon.com, Inc. 2.5% 03-JUN-2050Yield to maturity
5.44%
Maturity date
Jun 3, 2050
AMZN5182959
Amazon.com, Inc. 3.1% 12-MAY-2051Yield to maturity
5.40%
Maturity date
May 12, 2051
AMZN4531866
Amazon.com, Inc. 4.05% 22-AUG-2047Yield to maturity
5.35%
Maturity date
Aug 22, 2047
US23135AQ9
Amazon.com, Inc. 4.95% 05-DEC-2044Yield to maturity
5.16%
Maturity date
Dec 5, 2044
See all AMZN bonds
Curated watchlists where AMZN is featured.


Frequently Asked Questions
The current price of AMZN is 229.11 USD — it has decreased by −2.12% in the past 24 hours. Watch Amazon.com, Inc. stock price performance more closely on the chart.
Depending on the exchange, the stock ticker may vary. For instance, on NASDAQ exchange Amazon.com, Inc. stocks are traded under the ticker AMZN.
AMZN stock has fallen by −1.43% compared to the previous week, the month change is a −9.16% fall, over the last year Amazon.com, Inc. has showed a 6.09% increase.
We've gathered analysts' opinions on Amazon.com, Inc. future price: according to them, AMZN price has a max estimate of 360.00 USD and a min estimate of 250.00 USD. Watch AMZN chart and read a more detailed Amazon.com, Inc. stock forecast: see what analysts think of Amazon.com, Inc. and suggest that you do with its stocks.
AMZN reached its all-time high on Nov 3, 2025 with the price of 258.60 USD, and its all-time low was 0.07 USD and was reached on May 22, 1997. View more price dynamics on AMZN chart.
See other stocks reaching their highest and lowest prices.
See other stocks reaching their highest and lowest prices.
AMZN stock is 2.95% volatile and has beta coefficient of 1.41. Track Amazon.com, Inc. stock price on the chart and check out the list of the most volatile stocks — is Amazon.com, Inc. there?
Today Amazon.com, Inc. has the market capitalization of 2.45 T, it has increased by 3.07% over the last week.
Yes, you can track Amazon.com, Inc. financials in yearly and quarterly reports right on TradingView.
Amazon.com, Inc. is going to release the next earnings report on Jan 29, 2026. Keep track of upcoming events with our Earnings Calendar.
AMZN earnings for the last quarter are 1.95 USD per share, whereas the estimation was 1.57 USD resulting in a 24.34% surprise. The estimated earnings for the next quarter are 1.95 USD per share. See more details about Amazon.com, Inc. earnings.
Amazon.com, Inc. revenue for the last quarter amounts to 180.17 B USD, despite the estimated figure of 177.91 B USD. In the next quarter, revenue is expected to reach 211.20 B USD.
AMZN net income for the last quarter is 21.19 B USD, while the quarter before that showed 18.16 B USD of net income which accounts for 16.64% change. Track more Amazon.com, Inc. financial stats to get the full picture.
No, AMZN doesn't pay any dividends to its shareholders. But don't worry, we've prepared a list of high-dividend stocks for you.
As of Dec 5, 2025, the company has 1.56 M employees. See our rating of the largest employees — is Amazon.com, Inc. on this list?
EBITDA measures a company's operating performance, its growth signifies an improvement in the efficiency of a company. Amazon.com, Inc. EBITDA is 141.68 B USD, and current EBITDA margin is 19.15%. See more stats in Amazon.com, Inc. financial statements.
Like other stocks, AMZN shares are traded on stock exchanges, e.g. Nasdaq, Nyse, Euronext, and the easiest way to buy them is through an online stock broker. To do this, you need to open an account and follow a broker's procedures, then start trading. You can trade Amazon.com, Inc. stock right from TradingView charts — choose your broker and connect to your account.
Investing in stocks requires a comprehensive research: you should carefully study all the available data, e.g. company's financials, related news, and its technical analysis. So Amazon.com, Inc. technincal analysis shows the sell today, and its 1 week rating is buy. Since market conditions are prone to changes, it's worth looking a bit further into the future — according to the 1 month rating Amazon.com, Inc. stock shows the strong buy signal. See more of Amazon.com, Inc. technicals for a more comprehensive analysis.
If you're still not sure, try looking for inspiration in our curated watchlists.
If you're still not sure, try looking for inspiration in our curated watchlists.