Atossa Therapeutics: Navigating Clinical Trials and Market TrendAtossa Therapeutics is in the spotlight with its Phase 2 clinical trials, a crucial stage in assessing the efficacy and safety of their drug. Success here is vital for FDA approvals and advancing to later trials. However, the journey is fraught with challenges like regulatory hurdles and unpredictab
Next report date
—
Report period
—
EPS estimate
—
Revenue estimate
—
−0.24USD
−30.09 MUSD
125.25 M
About Atossa Therapeutics, Inc.
Sector
CEO
Steven C. Quay
Headquarters
Seattle
Website
Employees (FY)
12
Founded
2008
FIGI
BBG002NCD8C8
Atossa Therapeutics, Inc. operates as a clinical-stage pharmaceutical company, which engages in the development of novel therapeutics and delivery methods for the treatment of breast cancer and other breast conditions. The company was founded by Steven C. Quay and Shu Chih Chen in December 2008 and is headquartered in Seattle, WA.

ATOS Break OutAverage daily volume has been increasing since late May when it made a bullish pennant and a golden cross.
The ADX at 36 indicates a strong trend with D+ moving sharply higher.
Price broke out of the pennant (which corresponds to the descending trend line on the weekly) and looks very bullish a

ATOS | InformativeNASDAQ:ATOS
It completed wave 3, and now wave 4 has started. It is expected to reach the 1.08 area soon, which aligns precisely with the Fibonacci retracements. After that, it should initiate wave 5, with the initial target being 1.60, followed by 2.10, which is a significant key level from 2021.

ATOS | InformativeNASDAQ:ATOS
I anticipate a pullback to $0.85 as the Relative Strength Index (RSI) indicates an overbought condition. Based on Elliott Waves theory, a correction is expected, followed by the emergence of the fifth leg.
Following the pullback, if the price surpasses the psychological resistance le

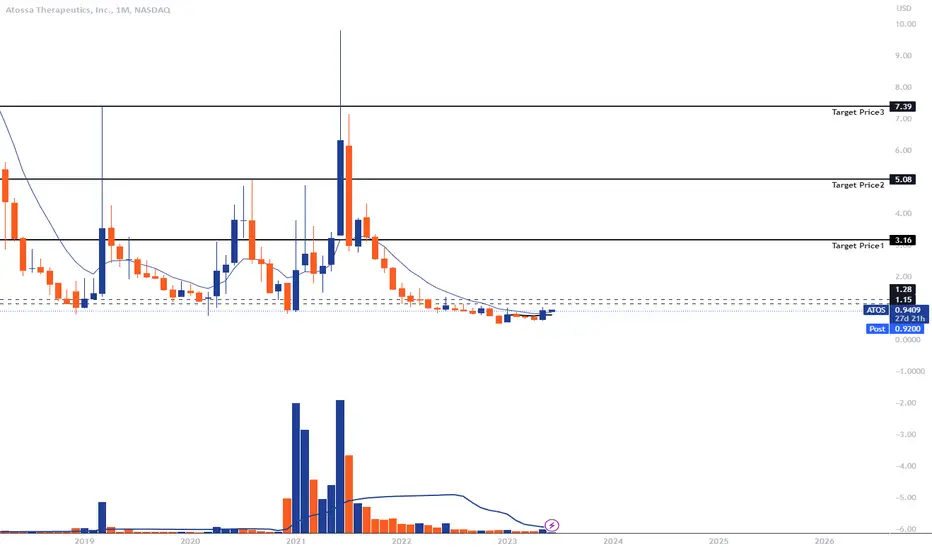
Long | ATOS NASDAQ:ATOS
Possible Scenario: Long
Target Prices TP1:3$, TP2: 5$, TP3: 7$
Timeframe: October 2023
Evidence: Price Actions, Money Flow
Atossa Therapeutics*risky but the reward…*
Trawling through the Nasdaq at the 11th hour before a major correction reveals a number of interesting opportunities where the success of tech stocks have overshadowed the less successful of late.
This trade idea is 100% technical without focus on the fundamentals. Atossa

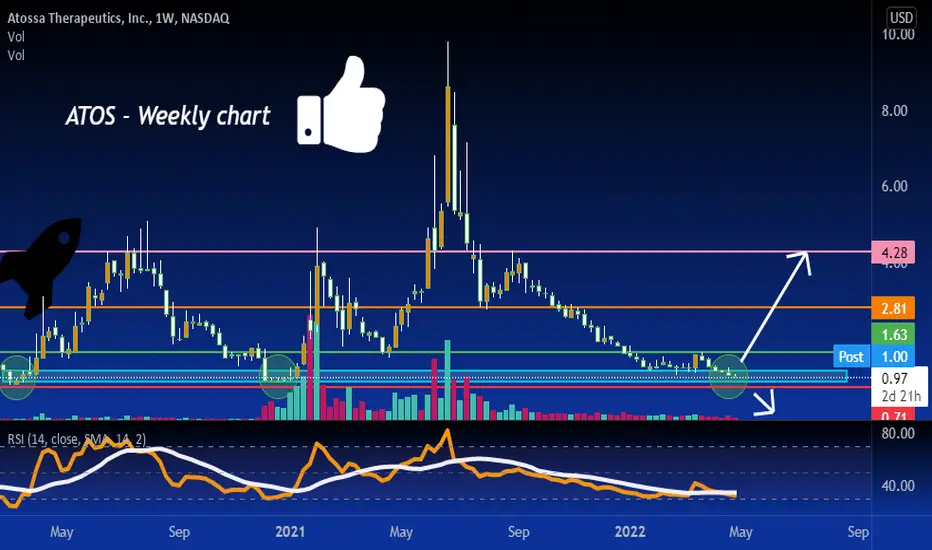
ATOS amazing risk reward for longs! should see a bounce here we can easily do a triple bottom bounce off extreme support now, targeting 1.63-2.81-4.28 on a bounce with SL below extreme support zone.
can be a short play if support breaks as well
Target $ 2.78Atossa Therapeutics (ATOS) said Wednesday it has completed enrollment in part B of its phase 1/2a trial of drug candidate AT-H201 in Australia.
AT-H201 is being developed as an inhalation therapy for moderately to severely ill hospitalized COVID-19 patients and for "long-haul" patients with post-in

ATOS Weekly Shaping UpWe can see that the weekly chart is showing some exhaustion on the sell pressure. The daily has a bit of a heartbeat today breaking over the 20ema/ma.
Looking to see the weekly SARs flip underneath to support price, and a break over the T Line (EMA8) on the weekly to confirm a trend change.
If th

ATOS: no support for new uptrendHead and Shoulders pattern from earlier this year almost fully manifested (see my previous post below)
Next support is around 2.00 and if that does not hold we are looking at 1.5 and 0.8

See all ideas
Trade directly on the supercharts through our supported, fully-verified and user-reviewed brokers.


Curated watchlists where ATOS is featured.

Frequently Asked Questions
The current price of ATOS is 1.69 USD — it has increased by 0.60% in the past 24 hours. Watch Atossa Therapeutics, Inc. stock price performance more closely on the chart.
Depending on the exchange, the stock ticker may vary. For instance, on NASDAQ exchange Atossa Therapeutics, Inc. stocks are traded under the ticker ATOS.
Atossa Therapeutics, Inc. is going to release the next earnings report on May 14, 2024. Keep track of upcoming events with our Earnings Calendar.
ATOS stock is 7.88% volatile and has beta coefficient of 1.90. Track Atossa Therapeutics, Inc. stock price on the chart and check out the list of the most volatile stocks — is Atossa Therapeutics, Inc. there?
ATOS earnings for the last quarter are −0.06 USD per share, whereas the estimation was −0.06 USD resulting in a 0% surprise. The estimated earnings for the next quarter are −0.07 USD per share. See more details about Atossa Therapeutics, Inc. earnings.
Atossa Therapeutics, Inc. revenue for the last quarter amounts to 0 USD despite the estimated figure of 0 USD. In the next quarter revenue is expected to reach 0 USD.
Yes, you can track Atossa Therapeutics, Inc. financials in yearly and quarterly reports right on TradingView.
ATOS stock has risen by 9.74% compared to the previous week, the month change is a 3.98% fall, over the last year Atossa Therapeutics, Inc. has showed a 134.69% increase.
ATOS net income for the last quarter is −7.75 M USD, while the quarter before that showed −6.23 M USD of net income which accounts for −24.48% change. Track more Atossa Therapeutics, Inc. financial stats to get the full picture.
Today Atossa Therapeutics, Inc. has the market capitalization of 211.76 M, it has increased by 8.50% over the last week.
No, ATOS doesn't pay any dividends to its shareholders. But don't worry, we've prepared a list of high-dividend stocks for you.
Like other stocks, ATOS shares are traded on stock exchanges, e.g. Nasdaq, Nyse, Euronext, and the easiest way to buy them is through an online stock broker. To do this, you need to open an account and follow a broker's procedures, then start trading. You can trade Atossa Therapeutics, Inc. stock right from TradingView charts — choose your broker and connect to your account.
ATOS reached its all-time high on Mar 19, 2013 with the price of 2231.78 USD, and its all-time low was 0.50 USD and was reached on Dec 28, 2022. View more price dynamics on ATOS chart.
See other stocks reaching their highest and lowest prices.
See other stocks reaching their highest and lowest prices.
As of May 10, 2024, the company has 12.00 employees. See our rating of the largest employees — is Atossa Therapeutics, Inc. on this list?
Investing in stocks requires a comprehensive research: you should carefully study all the available data, e.g. company's financials, related news, and its technical analysis. So Atossa Therapeutics, Inc. technincal analysis shows the buy rating today, and its 1 week rating is buy. Since market conditions are prone to changes, it's worth looking a bit further into the future — according to the 1 month rating Atossa Therapeutics, Inc. stock shows the neutral signal. See more of Atossa Therapeutics, Inc. technicals for a more comprehensive analysis.
If you're still not sure, try looking for inspiration in our curated watchlists.
If you're still not sure, try looking for inspiration in our curated watchlists.
We've gathered analysts' opinions on Atossa Therapeutics, Inc. future price: according to them, ATOS price has a max estimate of 6.00 USD and a min estimate of 4.00 USD. Watch ATOS chart and read a more detailed Atossa Therapeutics, Inc. stock forecast: see what analysts think of Atossa Therapeutics, Inc. and suggest that you do with its stocks.