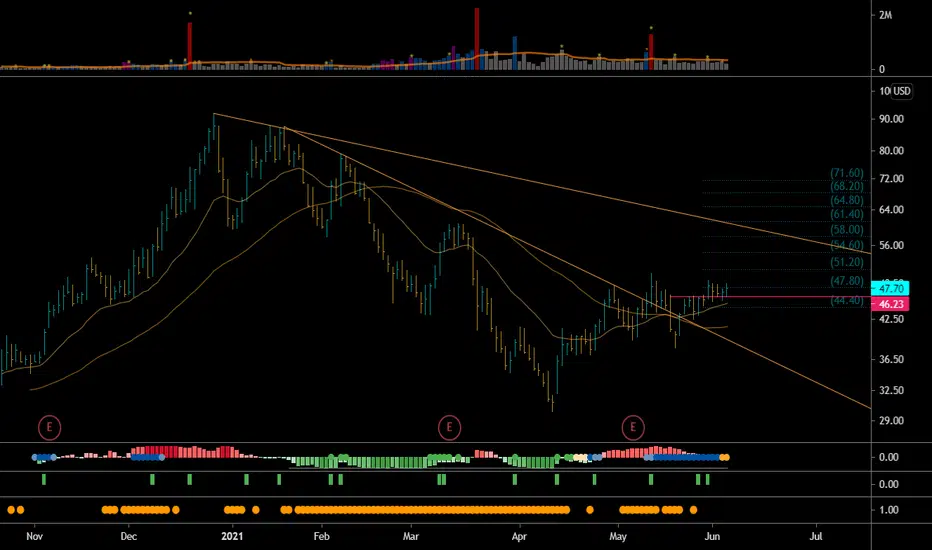
KYMR Busts Through Resistance - Waiting for PullbackKYMR just busted through the $52.94 resistance. This triggered a rev strat reversal on the quarterly chart as well as a 2-2 continuation on the monthly. I'll be waiting for a light volume pullback for long entry. Keeping position size small in this choppy market. Also not incredibly impressed with t
Next report date
—
Report period
—
EPS estimate
—
Revenue estimate
—
−2.50USD
−146.96 MUSD
78.59 MUSD
55.02 M
About Kymera Therapeutics, Inc.
Sector
Industry
CEO
Nello Mainolfi
Website
Headquarters
Watertown
Employees (FY)
187
Founded
2015
FIGI
BBG00SDHC8D1
Kymera Therapeutics, Inc. is a biopharmaceutical company, which engages in the discovery and development of small molecule therapeutics that degrade disease-causing proteins. The company was founded by Bruce Lee Booth and Nello Mainolfi in September 2015 and is headquartered in Watertown, MA.


An aggregate view of professional's ratings.
Trade directly on the supercharts through our supported, fully-verified and user-reviewed brokers.


Frequently Asked Questions
The current price of KYMR is 44.54 USD — it has increased by 1.14% in the past 24 hours. Watch Kymera Therapeutics, Inc. stock price performance more closely on the chart.
Depending on the exchange, the stock ticker may vary. For instance, on NASDAQ exchange Kymera Therapeutics, Inc. stocks are traded under the ticker KYMR.
KYMR stock has risen by 1.20% compared to the previous week, the month change is a 43.63% rise, over the last year Kymera Therapeutics, Inc. has showed a 101.17% increase.
We've gathered analysts' opinions on Kymera Therapeutics, Inc. future price: according to them, KYMR price has a max estimate of 112.00 USD and a min estimate of 30.00 USD. Watch KYMR chart and read a more detailed Kymera Therapeutics, Inc. stock forecast: see what analysts think of Kymera Therapeutics, Inc. and suggest that you do with its stocks.
KYMR reached its all-time high on Dec 28, 2020 with the price of 91.92 USD, and its all-time low was 9.60 USD and was reached on Nov 2, 2023. View more price dynamics on KYMR chart.
See other stocks reaching their highest and lowest prices.
See other stocks reaching their highest and lowest prices.
KYMR stock is 4.67% volatile and has beta coefficient of 3.09. Track Kymera Therapeutics, Inc. stock price on the chart and check out the list of the most volatile stocks — is Kymera Therapeutics, Inc. there?
Today Kymera Therapeutics, Inc. has the market capitalization of 2.70 B, it has decreased by 7.17% over the last week.
Yes, you can track Kymera Therapeutics, Inc. financials in yearly and quarterly reports right on TradingView.
Kymera Therapeutics, Inc. is going to release the next earnings report on Aug 2, 2024. Keep track of upcoming events with our Earnings Calendar.
KYMR earnings for the last quarter are −0.69 USD per share, whereas the estimation was −0.72 USD resulting in a 4.25% surprise. The estimated earnings for the next quarter are −0.68 USD per share. See more details about Kymera Therapeutics, Inc. earnings.
Kymera Therapeutics, Inc. revenue for the last quarter amounts to 10.29 M USD, despite the estimated figure of 14.24 M USD. In the next quarter, revenue is expected to reach 12.55 M USD.
KYMR net income for the last quarter is −48.56 M USD, while the quarter before that showed −14.37 M USD of net income which accounts for −237.95% change. Track more Kymera Therapeutics, Inc. financial stats to get the full picture.
No, KYMR doesn't pay any dividends to its shareholders. But don't worry, we've prepared a list of high-dividend stocks for you.
As of Jul 27, 2024, the company has 187.00 employees. See our rating of the largest employees — is Kymera Therapeutics, Inc. on this list?
EBITDA measures a company's operating performance, its growth signifies an improvement in the efficiency of a company. Kymera Therapeutics, Inc. EBITDA is −168.94 M USD, and current EBITDA margin is −206.08%. See more stats in Kymera Therapeutics, Inc. financial statements.
Like other stocks, KYMR shares are traded on stock exchanges, e.g. Nasdaq, Nyse, Euronext, and the easiest way to buy them is through an online stock broker. To do this, you need to open an account and follow a broker's procedures, then start trading. You can trade Kymera Therapeutics, Inc. stock right from TradingView charts — choose your broker and connect to your account.
Investing in stocks requires a comprehensive research: you should carefully study all the available data, e.g. company's financials, related news, and its technical analysis. So Kymera Therapeutics, Inc. technincal analysis shows the buy rating today, and its 1 week rating is strong buy. Since market conditions are prone to changes, it's worth looking a bit further into the future — according to the 1 month rating Kymera Therapeutics, Inc. stock shows the strong buy signal. See more of Kymera Therapeutics, Inc. technicals for a more comprehensive analysis.
If you're still not sure, try looking for inspiration in our curated watchlists.
If you're still not sure, try looking for inspiration in our curated watchlists.