Moon City Incoming! $250! NEXT!Price action has been very bullish over the past few days and if this 4HR demand holds (Red box), $250 can be next!
Calculate Your Risk/Reward so you don't lose more than 1% of your account per trade.
Every day the charts provide new information. You have to adjust or get REKT.
Love it or hate it,
Next report date
—
Report period
—
EPS estimate
—
Revenue estimate
—
14.35 USD
1.81 B USD
10.59 B USD
101.99 M
About lululemon athletica inc.
Sector
Industry
CEO
Calvin R. McDonald
Website
Headquarters
Vancouver
Founded
1998
IPO date
Jul 27, 2007
IPO offer price
18.00 USD
Identifiers
3
ISINUS5500211090
lululemon athletica, Inc. engages in the business of designing, distributing, and retailing technical athletic apparel, footwear, and accessories. It operates through the following segments: Company-Operated Stores, Direct to Consumer, and Other. The company was founded by Dennis James Wilson in 1998 and is headquartered in Vancouver, Canada.
Related stocks

LULU Bullish Reversal Alert, +43% Upside Potential on the Table?Hey Realistic Traders!
With the Fed cutting rates, investors rotated out of overpriced AI stocks and into value names. Lululemon stands out after a sharp sell-off compressed valuations to historically attractive levels, and we now turn to technical analysis to see whether price action confirms the

LULU: Hands Changed. Upside Possible to 308This is accumulation near support levels and It is sign to have buying interest, So, Good spikes of volumes are there, If no negative news will be there then It has potential to raise in Upside 308 Levels.
For this Stop Loss : 155
Manage Your Risk and Hold in your portfolio..
If you will gain some g

$LULUShares of the athletic apparel retailer Lululemon (NASDAQ: LULU) surged by 4.1% during morning trading, propelled by positive earnings results from fellow retailer Dollar General. The discount retailer reported third-quarter net sales of $10.6 billion, a 4.6% year-over-year increase, driven primaril


LULU 1D - stretching into a comebackOn the daily chart of Lululemon Athletica (LULU), a clean AB=CD pattern is forming, signaling a potential end to the correction and the beginning of a new upward wave. The price has tested the strong buy zone between 164–167, aligned with a major daily support level and rising volume - a classic set

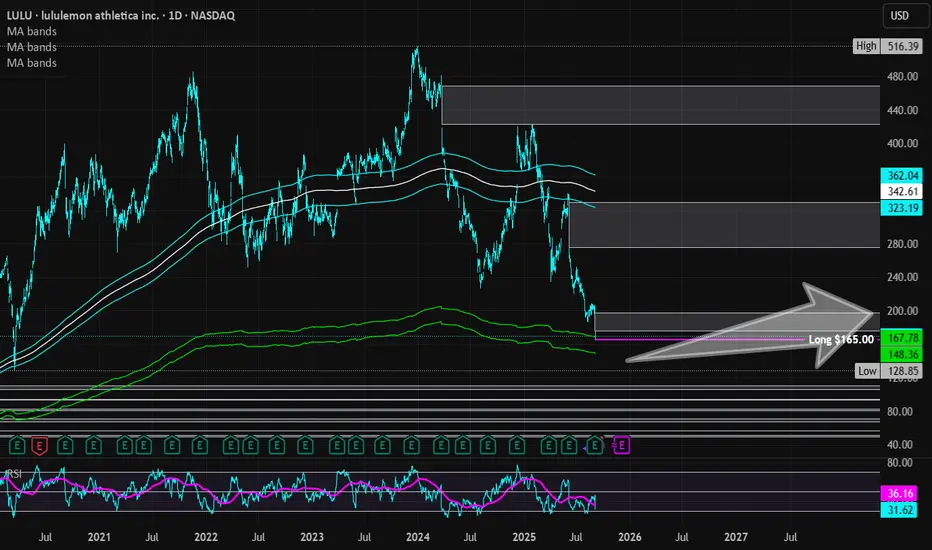
Lululemon Athletica | LULU | Long at $165.00Lululemon $NASDAQ:LULU. If you don't think the US is in a recession, examine most retail stocks right now. But this doesn't mean doom and gloom are here from a US government/news narrative - in fact, the complete opposite. AI and tech are solely propping up the US stock market ... but pay no attenti
Quant Signals V3 LULU Earnings: Bearish Setup DetectedLULU Earnings Signal | 2025-12-11
• Direction: BUY PUTS
• Confidence: 60%
• Expiry: 12/12
• Strike: 177.50
• Entry: 6.45–7.05
• Target: 10.13
• Stop: 5.00
• Risk Level: Moderate
• Flow: Bearish (PCR 1.80)
• 24h Move: -2.26%
Katy AI: Neutral label but bearish bias — 75% of predictions below current

Lululemon Athletica Inc. breakout momentum targets $220 this wee
Current Price: $204.97
Direction: LONG
Confidence Level: 80% (Momentum confirmed by strong earnings, broad trader agreement, and bullish technical setup)
Targets:
- T1 = $210.00
- T2 = $220.00
Stop Levels:
- S1 = $202.11
- S2 = $198.00
**Wisdom of Professional Traders:**
I'm seeing significan

LULU Earnings I think LULU should have good earnings giving holiday season , they have inventory , stock is down a lot. IMO we could see low 200's if earnings are good and so is guidance

See all ideas
Summarizing what the indicators are suggesting.
Neutral
SellBuy
Strong sellStrong buy
Strong sellSellNeutralBuyStrong buy
Neutral
SellBuy
Strong sellStrong buy
Strong sellSellNeutralBuyStrong buy
Neutral
SellBuy
Strong sellStrong buy
Strong sellSellNeutralBuyStrong buy
An aggregate view of professional's ratings.
Neutral
SellBuy
Strong sellStrong buy
Strong sellSellNeutralBuyStrong buy
Neutral
SellBuy
Strong sellStrong buy
Strong sellSellNeutralBuyStrong buy
Neutral
SellBuy
Strong sellStrong buy
Strong sellSellNeutralBuyStrong buy
Displays a symbol's price movements over previous years to identify recurring trends.
Curated watchlists where LULU is featured.

Frequently Asked Questions
The current price of LULU is 212.68 USD — it has increased by 0.15% in the past 24 hours. Watch lululemon athletica inc. stock price performance more closely on the chart.
Depending on the exchange, the stock ticker may vary. For instance, on NASDAQ exchange lululemon athletica inc. stocks are traded under the ticker LULU.
LULU stock has risen by 1.85% compared to the previous week, the month change is a 28.73% rise, over the last year lululemon athletica inc. has showed a −44.02% decrease.
We've gathered analysts' opinions on lululemon athletica inc. future price: according to them, LULU price has a max estimate of 303.00 USD and a min estimate of 175.00 USD. Watch LULU chart and read a more detailed lululemon athletica inc. stock forecast: see what analysts think of lululemon athletica inc. and suggest that you do with its stocks.
LULU reached its all-time high on Dec 29, 2023 with the price of 516.39 USD, and its all-time low was 2.17 USD and was reached on Mar 6, 2009. View more price dynamics on LULU chart.
See other stocks reaching their highest and lowest prices.
See other stocks reaching their highest and lowest prices.
LULU stock is 1.97% volatile and has beta coefficient of 1.18. Track lululemon athletica inc. stock price on the chart and check out the list of the most volatile stocks — is lululemon athletica inc. there?
Today lululemon athletica inc. has the market capitalization of 24.91 B, it has increased by 4.95% over the last week.
Yes, you can track lululemon athletica inc. financials in yearly and quarterly reports right on TradingView.
lululemon athletica inc. is going to release the next earnings report on Mar 31, 2026. Keep track of upcoming events with our Earnings Calendar.
LULU earnings for the last quarter are 2.59 USD per share, whereas the estimation was 2.22 USD resulting in a 16.44% surprise. The estimated earnings for the next quarter are 4.79 USD per share. See more details about lululemon athletica inc. earnings.
lululemon athletica inc. revenue for the last quarter amounts to 2.57 B USD, despite the estimated figure of 2.48 B USD. In the next quarter, revenue is expected to reach 3.58 B USD.
LULU net income for the last quarter is 306.83 M USD, while the quarter before that showed 370.90 M USD of net income which accounts for −17.27% change. Track more lululemon athletica inc. financial stats to get the full picture.
No, LULU doesn't pay any dividends to its shareholders. But don't worry, we've prepared a list of high-dividend stocks for you.
As of Dec 24, 2025, the company has 39 K employees. See our rating of the largest employees — is lululemon athletica inc. on this list?
EBITDA measures a company's operating performance, its growth signifies an improvement in the efficiency of a company. lululemon athletica inc. EBITDA is 2.94 B USD, and current EBITDA margin is 27.83%. See more stats in lululemon athletica inc. financial statements.
Like other stocks, LULU shares are traded on stock exchanges, e.g. Nasdaq, Nyse, Euronext, and the easiest way to buy them is through an online stock broker. To do this, you need to open an account and follow a broker's procedures, then start trading. You can trade lululemon athletica inc. stock right from TradingView charts — choose your broker and connect to your account.
Investing in stocks requires a comprehensive research: you should carefully study all the available data, e.g. company's financials, related news, and its technical analysis. So lululemon athletica inc. technincal analysis shows the buy rating today, and its 1 week rating is neutral. Since market conditions are prone to changes, it's worth looking a bit further into the future — according to the 1 month rating lululemon athletica inc. stock shows the sell signal. See more of lululemon athletica inc. technicals for a more comprehensive analysis.
If you're still not sure, try looking for inspiration in our curated watchlists.
If you're still not sure, try looking for inspiration in our curated watchlists.