Next report date
—
Report period
—
EPS estimate
—
Revenue estimate
—
−88.11USD
−12.01 MUSD
13.73 MUSD
760.04 K
About Reliance Global Group, Inc.
Sector
Industry
CEO
Ezra S. Beyman
Website
Headquarters
Lakewood
Employees (FY)
67
Founded
2013
FIGI
BBG0063J9Y61
Reliance Global Group, Inc. is a diversified company, which engages in the business of insurance market and other relates sectors. It focuses on acquisition strategy, wholesale, and retail insurance agencies. The company was founded on August 2, 2013 and is headquartered in Lakewood, NJ.

RELI - Great Setup to start EntryReliance Global Group, Inc. engages in the acquisition and management of wholesale and retail insurance agencies in the United States. It provides healthcare and Medicare, personal and commercial, trucking, and employee benefits insurance products. The company was formerly known as Ethos Media Netwo
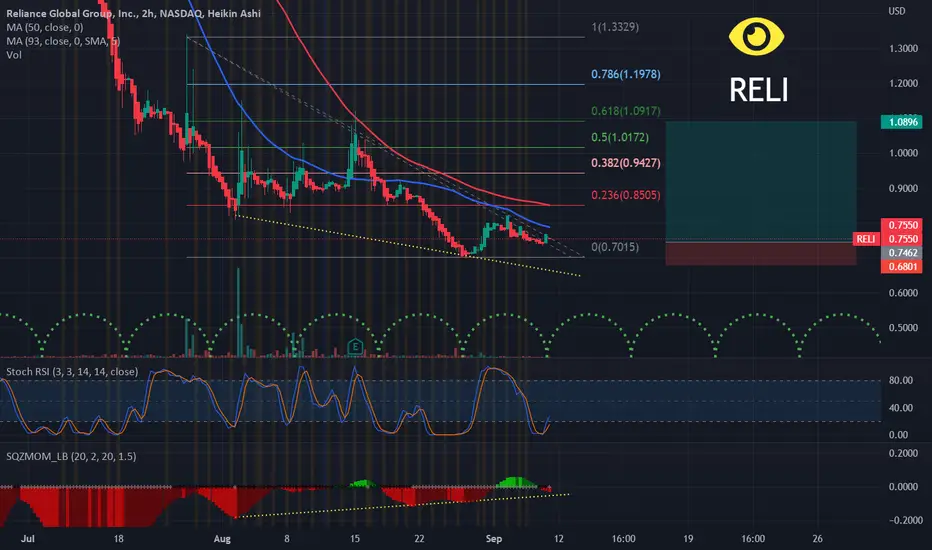
Shorting reliably the Reliance Group. RELIGoals 5, 3.6. Invalidation at 13.9 .
We are not in the business of getting every prediction right, no one ever does and that is not the aim of the game. The Fibonacci targets are highlighted in purple with invalidation in red. Fibonacci goals, it is prudent to suggest, are nothing more than mere f


$RELI – SI 183%Reliance Global Group, Inc. engages in the acquisition and management of wholesale and retail insurance agencies in the United States. It provides healthcare and Medicare, personal and commercial, trucking and transportation, and employee benefits insurance products. The company was formerly known a


$RELI – SI 76%$RELI entry PTs 5.29-6.30 Targets PT 9-10.50 and higher
$RELI – SI 76%
Reliance Global Group, Inc. engages in the acquisition and management of wholesale and retail insurance agencies in the United States. It provides healthcare and Medicare, personal and commercial, trucking and transportation, an


$RELI – SI 46% SYMMETRICAL TRIANGLEReliance Global Group, Inc. engages in the acquisition and management of wholesale and retail insurance agencies in the United States. It provides healthcare and Medicare, personal and commercial, trucking and transportation, and employee benefits insurance products. The company was formerly known a

See all ideas
Trade directly on the supercharts through our supported, fully-verified and user-reviewed brokers.


Frequently Asked Questions
The current price of RELI is 3.76 USD — it has decreased by 7.62% in the past 24 hours. Watch Reliance Global Group, Inc. stock price performance more closely on the chart.
Depending on the exchange, the stock ticker may vary. For instance, on NASDAQ exchange Reliance Global Group, Inc. stocks are traded under the ticker RELI.
RELI stock has fallen by 5.05% compared to the previous week, the month change is a 28.65% fall, over the last year Reliance Global Group, Inc. has showed a 94.09% decrease.
RELI reached its all-time high on Oct 1, 2015 with the price of 42,935.90 USD, and its all-time low was 3.30 USD and was reached on Jul 8, 2024. View more price dynamics on RELI chart.
See other stocks reaching their highest and lowest prices.
See other stocks reaching their highest and lowest prices.
RELI stock is 11.51% volatile and has beta coefficient of 1.94. Track Reliance Global Group, Inc. stock price on the chart and check out the list of the most volatile stocks — is Reliance Global Group, Inc. there?
Today Reliance Global Group, Inc. has the market capitalization of 3.75 M, it has decreased by 11.11% over the last week.
Yes, you can track Reliance Global Group, Inc. financials in yearly and quarterly reports right on TradingView.
Reliance Global Group, Inc. is going to release the next earnings report on Nov 12, 2024. Keep track of upcoming events with our Earnings Calendar.
RELI net income for the last quarter is −1.49 M USD, while the quarter before that showed −5.35 M USD of net income which accounts for 72.14% change. Track more Reliance Global Group, Inc. financial stats to get the full picture.
No, RELI doesn't pay any dividends to its shareholders. But don't worry, we've prepared a list of high-dividend stocks for you.
As of Jul 27, 2024, the company has 67.00 employees. See our rating of the largest employees — is Reliance Global Group, Inc. on this list?
EBITDA measures a company's operating performance, its growth signifies an improvement in the efficiency of a company. Reliance Global Group, Inc. EBITDA is −801.88 K USD, and current EBITDA margin is 25.81%. See more stats in Reliance Global Group, Inc. financial statements.
Like other stocks, RELI shares are traded on stock exchanges, e.g. Nasdaq, Nyse, Euronext, and the easiest way to buy them is through an online stock broker. To do this, you need to open an account and follow a broker's procedures, then start trading. You can trade Reliance Global Group, Inc. stock right from TradingView charts — choose your broker and connect to your account.
Investing in stocks requires a comprehensive research: you should carefully study all the available data, e.g. company's financials, related news, and its technical analysis. So Reliance Global Group, Inc. technincal analysis shows the sell today, and its 1 week rating is sell. Since market conditions are prone to changes, it's worth looking a bit further into the future — according to the 1 month rating Reliance Global Group, Inc. stock shows the sell signal. See more of Reliance Global Group, Inc. technicals for a more comprehensive analysis.
If you're still not sure, try looking for inspiration in our curated watchlists.
If you're still not sure, try looking for inspiration in our curated watchlists.