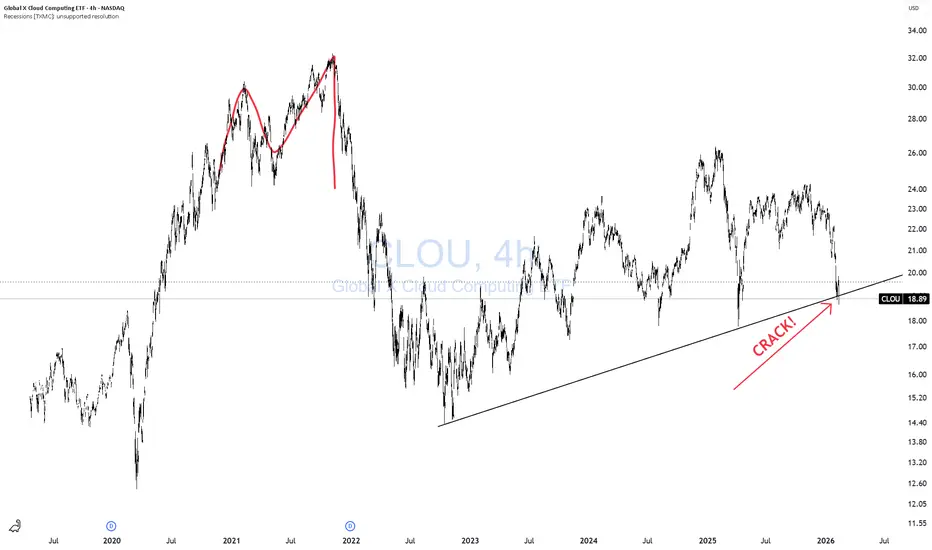
CLOUD ETF CRACK!We can all agree there is a definite revaluation going on in markets of late. This is consistent with software companies going through multiple contractions, as there is too much spending and not enough earnings growth.
CAUTION!
THANK YOU for getting me to 5,000 followers! 🙏🔥
Let’s keep climbing.
ETF market
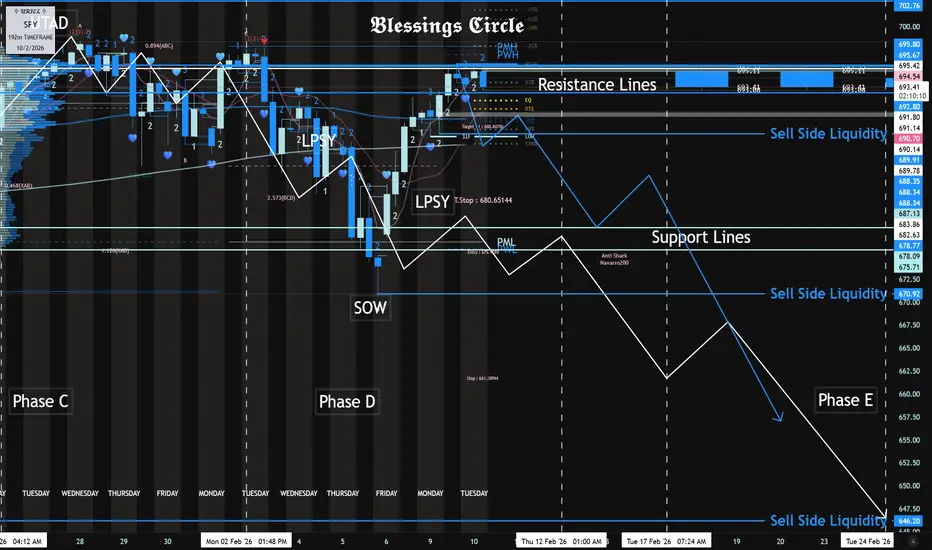
To 700 or Not To 700? OBV Might Be The ClueEdit: Sorry for the jank chart on the front of this idea, I didn't realize the view I had when I published this idea would be the main one for this idea. Anyway...
I ran upon an indicator new to me, and just thought I'd manifest my observations and thoughts on this interesting indicator. Here's wh

SPY – Feb 11 Market Preview: Compression Before ExpansionSPY spent the session consolidating just under the 696–697 resistance zone after the strong recovery off 670s earlier this week. The structure on the 15m remains constructive, but momentum has clearly slowed. This is no longer expansion — this is positioning.
We are sitting inside a tight value pock

$SPY & $SPX — Market-Moving Headlines Wednesday Feb 11, 2026🔮 AMEX:SPY & SP:SPX — Market-Moving Headlines Wednesday Feb 11, 2026
🌍 Market-Moving Themes
💼 Delayed Jobs Data Lands
January employment report finally drops after shutdown delays, reopening rate and growth debate in one print
🛒 Consumer Stress Signals
Recent KO and PEP misses keep focus on w

QQQ Update — Still in Range - Weekend Volatility
As we’ve been discussing, since October QQQ continues to trade inside a broad range.
Lows around ~580. Highs around ~630–637.
Different headlines, same structure.
Today we closed around 613, slightly green by the end of the day after last week’s sell-off. But year-to-date performance remains basi

SPY Weekly Outlook – Week 6 of 2026 (Feb 09–13)SPY Weekly Outlook – Week 6 of 2026 (Feb 09–13)
Weekly Recap
Last week, my core projection for SPY was that price lacked a clear directional bias and would trade within a range, reacting from key levels. Price behaved exactly as expected throughout the week, rejecting from those levels and formi

SPY Distribution Schematic Sub 650 by EOMAs Long As 695.80 - 695.67 Resistance Is Respected Today.
The Sells Targets Are As Follows:
SPY Sub 650 by Late Feb.
SPY Sub 600 by End of March.
Part Two:
02-10 SPY Forecast and PerspectiveKey Note, overnight structure held up to the Levels.
PM HIGH and LOWS updated
Good morning traders, it’s February 10, 2026, and we’re waking up to a nuanced S&P 500/SPY open, ready to map the tactical landscape for today’s price action: here we go !
ATR Structure: Our Average True Range comes in

TLT Neutral, near bottom to longDemand Zone,
Long entry 86.6
no stop
Target 89
Risk management is much more important than a good entry point.
I am not a PRO trader. About 25% of my trades had been stopped quickly.
In my trading plan, the Max Risk of each short term trade should be less than 1% of an account.

Indonesia ETF - 2:1 (+10%)Lagger trade in the Indonesian ETF.
Indonesia is a commodity heavy exporter. With the prices of all commodities skyrocketing as shown by gold; companies in this region will see higher revenues.
This is by no means a high conviction trade but offers good value at this level with a stop and limited

See all popular ideas
Community trends
SymbolPrice & chgNAV total return 1Y
SymbolNAV total return 1Y / Price
SymbolPrice & chgDividend yield FWD
SymbolDividend yield FWD / Price
ETF collections
LargestHighest AUM growthHighest returnsBiggest losersEquityBitcoinEthereumGoldFixed incomeReal estateTotal marketCommoditiesAsset allocationInverseLeveragedMost tradedLargest inflowsLargest outflowsHighest discount to NAVHighest premium to NAVHighest yieldDividendMonthly distributionsHighest diversificationActively managedSectorHighest betaLowest betaNegative betaHighest expense ratioAll-time highAll-time low52-week high52-week lowETFs of the USAETFs of CanadaETFs of the United KingdomETFs of GermanyETFs of JapanETFs of AustraliaSee all