Nifty 50Nifty 50 should hold around these zones and target 25669, We can look for confirmations from here to go long
NIFTY trade ideas

NIFTY50 UPDATEAfter the formation of a diametric pattern, as expected, the NIFTY50 index experienced a strong upward movement. This upward movement concluded with the formation of a Reverse Contracting Triangle pattern. Given the current conditions, two probable scenarios lie ahead for the index:
1- The correction that followed the Reverse Contracting Triangle is wave-b of a larger upward movement, and after the completion of this wave, NIFTY50 will resume its upward trend. Considering the strong movement that occurred after the diametric pattern, it seems likely that this scenario could materialize. In this scenario, the 24337 level will not be broken to the downside.
2- If the price breaks below 24337, we should assume that a double pattern of triangle - X - diametric formed wave-a, and the Reverse Contracting Triangle that followed is wave-b of a larger corrective downward pattern, which could be a neutral or reverse triangle.
Good luck
NEoWave Chart

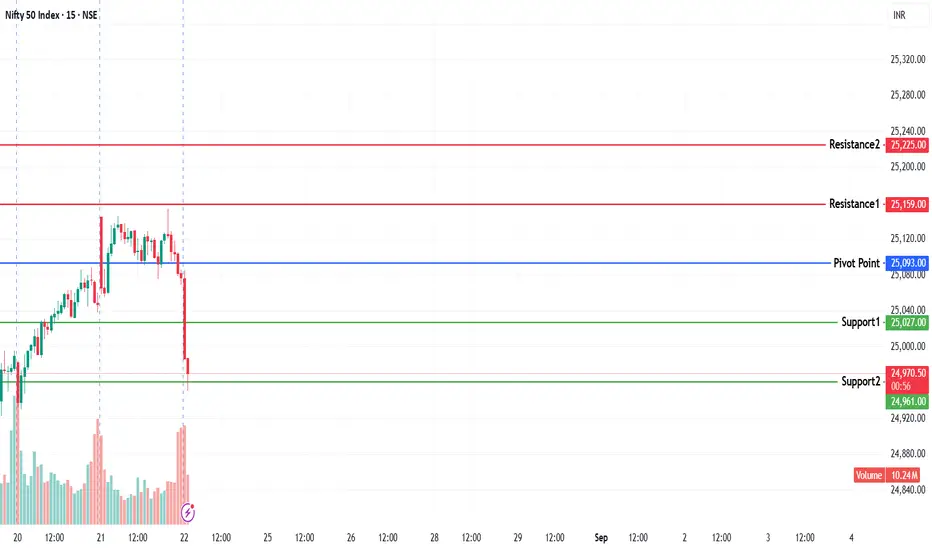
NIFTY KEY LEVELS FOR 26.08.2025NIFTY KEY LEVELS FOR 26.08.2025
************************* Time frame 3 Minutes******************************
If the candle stays above the pivot point, it is considered a bullish bias; if it remains below, it indicates a bearish bias. Price may reverse near Resistance 1 or Support 1. If it moves further, the next potential reversal zone is near Resistance 2 or Support 2. If these levels are also broken, we can expect the trend.
If the range(R2-S2) is narrow, the market may become volatile or trend strongly. If the range is wide, the market is more likely to remain sideways
📢 Disclaimer
I am not a SEBI-registered financial adviser.
The information, views, and ideas shared here are purely for educational and informational purposes only. They are not intended as investment advice or a recommendation to buy, sell, or hold any financial instruments.
Please consult with your SEBI-registered financial advisor before making any trading or investment decisions.
Trading and investing in the stock market involves risk, and you should do your own research and analysis. You are solely responsible for any decisions made based on this research.
26 August 2025 Nifty50 trading level Key Levels (25th Aug 2025 Close → 24,978.55)
25,218
🔺 Above 10m closing → Shot Cover Level
🔻 Below 10m → Hold PE by Safe Zone
25,133
🔺 Above 10m → Hold CE by Entry Level
🔻 Below 10m → Hold PE by Risky Zone
25,033
🔺 Above 10m → Positive Trade View
🔻 Below 10m → Negative Trade View
24,940 (Opening Levels)
🔺 Above Opening S1 → 10m Hold CE by Level
🔻 Below Opening R1 → 10m Hold PE by Level
24,840
🔺 Above 10m → Hold CE by Level
🔻 Below 10m → Hold PE by Level
24,738
🔺 Above 10m → Hold CE by Safe Zone
🔻 Below 10m → Unwinding Level


Nifty 50 Analysis for 26-08-2025NIFTY 50 (15m Chart)
Label Area/Level Description
FVG Zone ~24,995–25,045 Fair Value Gap area; strong supply zone
Current Price 24,967.75 Hovering near FVG and trendline retest
Expected Move Downward Anticipating a drop into lower OBs
Buy OB #1 ~24,920 area Minor reaction expected
Buy OB #2 ~24,875 area Stronger support zone
Gap Zone <24,850 Missing orders → liquidity magnet
Technical Breakdown
Bearish Price Action:
Price formed a rising wedge structure (bearish pattern).
Rejection from FVG (Fair Value Gap) suggests selling pressure still exists.
Clean liquidity void (gap) below, likely to be filled.
Buy Order Blocks (OBs):
Marked areas where institutional buying may appear.
These are potential reactive levels, but overall bias remains bearish unless price flips OBs back to demand.
Expected Flow:
Price retests FVG zone and stalls.
Drops to first OB → slight bounce or consolidation.
Breaks below to second OB.
Eventually seeks to fill liquidity gap at/below 24,850.
Comparison with 1H Chart
Feature 1H Chart 15m Chart
Timeframe Swing bias Intraday precision
Entry Area 24,919.1 (confirmed) Near 24,970-25,000
Target Zones 24,800 → 24,600 24,920 → 24,875 → gap below 24,850
View Bearish Bearish with OB reaction zones
Confirmation FVG rejection + trendline break Rising wedge + FVG + OBs tested
Why This Chart Matters:
It provides entry refinement and execution planning for intraday trades.
Highlights institutional order blocks, helping traders anticipate pauses or reactions.
Offers a clear, structured bearish roadmap with zones and invalidation levels.
Next Steps for Traders:
Look for lower highs / bearish candle patterns near FVG before shorting.
Be cautious near Buy OBs — partial booking or break-even adjustments are wise.
Confirm breakdown of OBs with volume or structure shifts before full position scaling.

Nifty levels - Aug 26, 2025Nifty support and resistance levels are valuable tools for making informed trading decisions, specifically when combined with the analysis of 5-minute timeframe candlesticks and VWAP. By closely monitoring these levels and observing the price movements within this timeframe, traders can enhance the accuracy of their entry and exit points. It is important to bear in mind that support and resistance levels are not fixed, and they can change over time as market conditions evolve.
The dashed lines on the chart indicate the reaction levels, serving as additional points of significance to consider. Furthermore, take note of the response at the levels of the High, Low, and Close values from the day prior.
We hope you find this information beneficial in your trading endeavors.
* If you found the idea appealing, kindly tap the Boost icon located below the chart. We encourage you to share your thoughts and comments regarding it.
Wishing you success in your trading activities!

Nifty Eyes Fresh Upside: Support at 24,700, Targeting 25,500 on **Overview**
The Nifty 50 shows renewed strength as it holds firm around the 24,700 support level—an area many analysts believe is primed for bounces amid persistent volatility. Should the index clear 25,150, the path may open toward 25,300–25,500. A breakdown below 24,800, however, could quickly test lower supports near 24,600. (Source: Economic Times)
**Drivers & Sentiment**
- Global markets are buoyed by a possible U.S. Fed rate cut in September, a move signaling improved risk appetite for emerging markets like India. (Source: Reuters)
- Indian sectors led by IT are contributing to the rally, leveraging positive global cues and easing rate expectations. (Source: Reuters)
**Technical Strategy**
- A measured **buy-on-dips** strategy is recommended, particularly near the 24,700 level.
- For options traders, a **Bull Call Spread** is a tactical strategy to benefit from the ongoing up-move while mitigating downside risk. (Source: ET)
**Key Levels to Watch**
- **Support**: 24,700 → 24,800
- **Resistance/Breakout**: 25,150 → 25,300–25,500
**Conclusion**
Nifty is at a potentially pivotal juncture. A clean breakout above 25,150 could signal the resumption of an uptrend, while strong support underscores the appeal of accumulation on dips. Exciting setups lie ahead for both equity traders and options strategists alike.
Only for education purpose. I am not a SEBI registered. Ask to your financial advisor

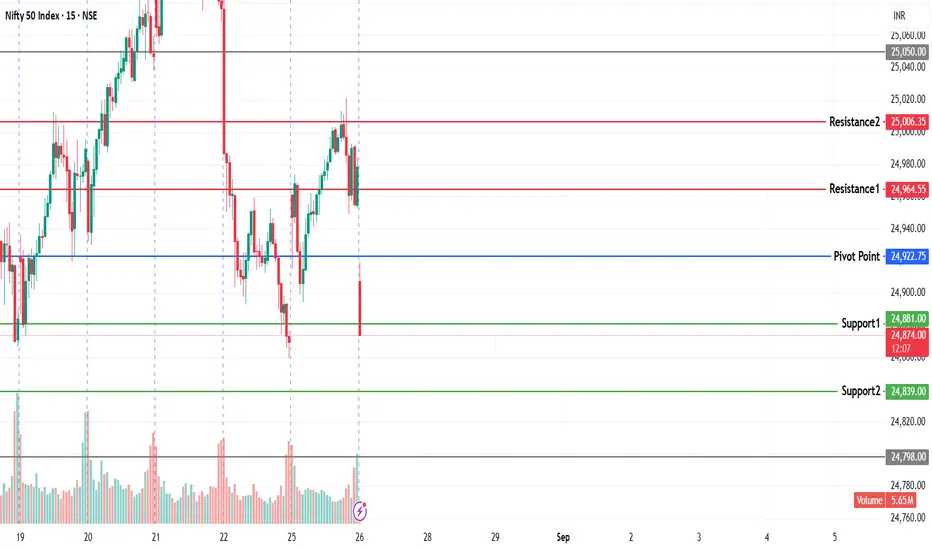
NIFTY KEY LEVELS FOR 25.08.2025NIFTY KEY LEVELS FOR 25.08.2025
If the candle stays above the pivot point, it is considered a bullish bias; if it remains below, it indicates a bearish bias. Price may reverse near Resistance 1 or Support 1. If it moves further, the next potential reversal zone is near Resistance 2 or Support 2. If these levels are also broken, we can expect the trend.
If the range(R2-S2) is narrow, the market may become volatile or trend strongly. If the range is wide, the market is more likely to remain sideways
📢 Disclaimer
I am not a SEBI-registered financial adviser.
The information, views, and ideas shared here are purely for educational and informational purposes only. They are not intended as investment advice or a recommendation to buy, sell, or hold any financial instruments.
Please consult with your SEBI-registered financial advisor before making any trading or investment decisions.
Trading and investing in the stock market involves risk, and you should do your own research and analysis. You are solely responsible for any decisions made based on this research.


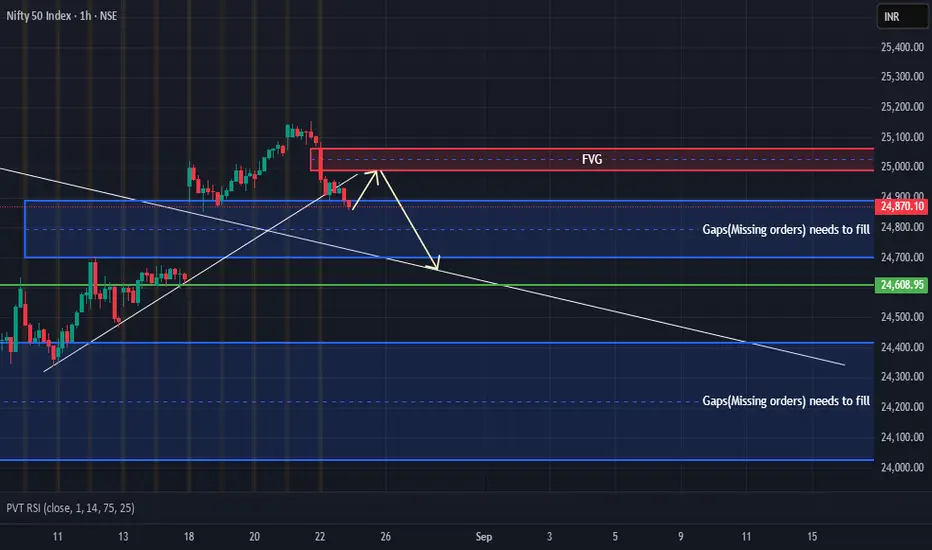
Nifty Analysis 25-08-2025 Technical View
Fair Value Gap (FVG):
Price recently dropped sharply, leaving behind an imbalance (FVG).
Current entry lies right at the edge of FVG, suggesting price may reject upon filling this inefficiency.
Bearish Momentum Signs:
Break of upward trendline
Bearish candlestick formations post-high
Multiple price gaps below waiting to be filled, likely due to aggressive buying without consolidation.
Trade Logic
This is a sell-on-rally strategy targeting:
Gap fills
Fair Value Gap rejection
Previous structure lows
If the market continues respecting supply areas (as seen from previous rejection), a move toward 24,600 and below seems plausible.
Risk-Reward
Metric Value
Entry 24,919.1
Stop Loss 25,153.65 (~+234 pts)
Target (TP 1.0) 24,684.55 (~234 pts)
Target (TP 1.5) 24,567.27 (~351 pts)
✅ Strengths of the Setup:
Confluence of FVG + broken trendline.
Gaps below offer natural liquidity magnets.
Clean structure with pre-defined TP levels.
Potential to scale out at different levels (TP0.5, TP1, TP1.5).
Risks / Considerations:
Gap Reversal Risk – NIFTY often fills and bounces back sharply.
High Volatility Zones – Around 24,800 to 24,600, demand may emerge.
NIfty may dip more but market breadth remains positiveRemember last Monday when I wrote in my commentary that a sharp dip is coming in Nifty with support at 24850? Well, check this week’s low – 24852. Spot on.
While finfluencers and TV “experts” were shouting about a mega rally, I kept a clear bearish view. That’s the power of chart reading.
If you know how to read Price Action + Volumes, you won’t get trapped in greed or fear. You’ll earn better, lose less.
On Friday I also mentioned sellers’ volume is still higher than buyers – and it showed up exactly.
I also said indices will stay weak but stocks will perform bullish. And that exactly what happened. I closed the biggest day gain on Friday.
I warned that this move is purely fueled by retail SIP inflows, while FIIs are consistently building shorts on the index. If after such clear hints you still lost money this week, then only God can save you from the market.
Now let’s talk about what happened Friday and how Monday + next week may look:
Friday gave us a big red candle, but interestingly there was no short build-up. It was just long unwinding. This means bulls haven’t exited – they are simply waiting for the index to come to its positional support, which is at 24650 this week.
However, sellers did beat buyers by 25 million in volume on Friday.
Pivot has slipped lower to 24938, with Pivot Percentile at 0.27%.
What to expect on Monday:
If opening is above Pivot and holds for 75 minutes, we may see a move towards resistance at 24986.
But keep in mind – until Nifty closes above weekly resistance of 25080, every upmove will remain a Sell-on-Rise opportunity.
And yes, this is monthly expiry week – expect volatility.
My view for the week → Index volatile, stocks bullish.
For Monday → rangebound bias (based on Pivot Percentile). Support at 24850. If this breaks, bias will turn bearish.
#BankNifty needs to close above 55333 tomorrow to turn constructive. Only then I’ll build a directional view there.
Sectors showing momentum → Textiles, Computer Software & Parts.
Performance of trades I took on Friday:
NSE:APOLLO → +14.58%
NSE:JMFINANCIL → +4% intraday booked
NSE:RSYSTEMS → +5.36%
NSE:KROSS → +13% intraday gain booked
That will be all for the day. Take care and have a profitable week tomorrow.
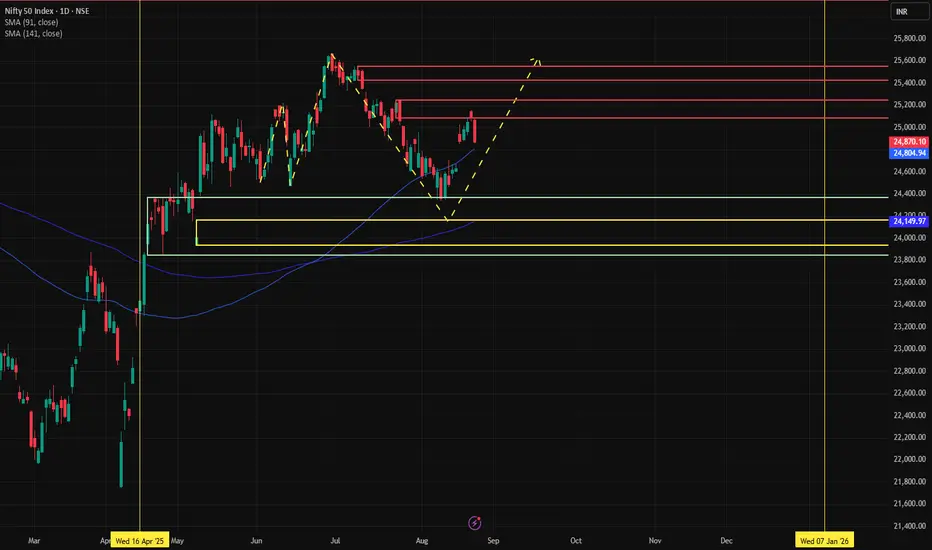
#NIFTY50 upcoming week looks decidingNSE:NIFTY Nifty currently taking time to clear whether to fall lower or to float around between recent time lows and ATH. As explained their could be multiple possibility ahead. For time being we expect one more swing higher could make the recent time low a strong support at-least for few weeks encouraging some buyers to enter. Now if not made and the recent lows are taken could implicate further more correction in #NIFTY50. So we suggest to stay on sideline till further notice.

NIFTY50.....Do we have a new rally?Hello Traders,
the NIFTY50 has increased by 238.80 points, or 0.97%, over the past week.
Additionally, we observed a gap-up, which could be interpreted as a positive sign for the bulls.
Probably, the correction has ended @ 24337/23347 from Monday, August 4th to Friday, August 15th!
In this case, my expectation for new lows below that range was incorrect!
When gaps occur rat chart, no matter if to the up- or downside, some news that haven't been published comes into focus via internet, the press or elsewhere.
So, it might be in this case too.
One bearish opportunity is, that the correction will extend into a triple correction with an x² and wave's z to follow! In this case, the bears will celebrate their victory below 24350 area!
Will the bulls instead start a party and start a rocket, we will favor new ATH in the coming weeks, possibly even by the end of 2025!
Right now, the wave structure is not clear to me, but I expect it to become clearer in the coming days!
My long-term published target is also still valid. It is placed @28905!
I have drawn my ideas at the chart. Blue-colored trend lines means "favorite" expectation, while gray means alternate view!
Have a great week.....
Ruebennase
Please ask or comment as appropriate.
Trade on this analysis at your own risk.

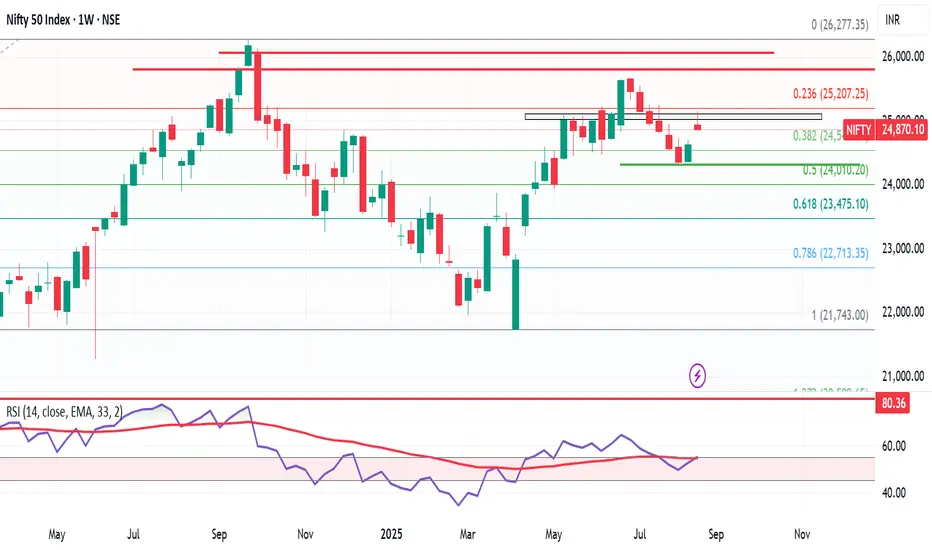
Nifty Forms Shooting Star – Is Septmber Correction on the Cards?Nifty closed this week at 24,870, up 240 points from the previous week’s close. It made a high of 25,153 and a low of 24,852, once again respecting my projected range of 25,100 – 24,300.
But here’s the key: this week, Nifty formed a Shooting Star candle, which is a bearish reversal pattern. As long as Nifty stays above 24,852, bulls are safe. But a break below this level could trigger downward pressure toward 24,400.
📊 Next Week’s Range:
➡️ Likely range → 25,350 – 24,400
➡️ Break below 24,852 = bearish pressure
➡️ If 24,400 breaks, 23,900 could come into play
Historical September Pattern:
From the 2nd week of September, markets have historically shown 6–11% corrections from their highs. If history repeats, within the next 10 days we could see another push toward 25,600/25,700, followed by heavy selling pressure.
✅ My Plan:
If markets rise in the coming days, I’ll be looking to cash out from existing positions and prepare to re-enter at better levels if a correction begins in the 2nd or 3rd week of September.
US Market Update – S&P500
The S&P500 bounced from 6,343 support and managed to close just 10 points higher than last week. Above its previous week’s high of 6,481, it has the potential to test the 6,568 Fibonacci level. Investors in US markets should trail their stop-loss to 6,330 to safeguard profits.
Want me to review any index or cryptocurrency for you? Drop it in the comments and I’ll cover it in my next update!
NIFTY STRATEGY🔹 MTF Demand Zones (All Showing BUY Bias)
Yearly Demand: 18,887 – 15,183 (Avg 17,035) → BUY
6 Month Demand: 21,801 – 18,837 (Avg 20,319) → BUY
Quarterly Demand: 24,226 – 21,964 (Avg 23,095) → BUY
Monthly Demand: 24,174 – 21,281 (Avg 22,728) → BUY
Weekly Demand: 24,365 – 23,847 (Avg 24,106) → BUY
Daily Demand: 24,164 – 23,935 (Avg 24,050) → BUY
➡️ Bias: Strongly bullish across all higher timeframes (HTF, MTF, ITF).
🔹 GANN Analysis
Stay Long Above: 23,452 – 23,362.5 → Support Zone
Stay Short Below: 23,362.5 – 23,273 → Breakdown Zone
Current Status: NIFTY is in Weekly Supply Zone (24,180 – 24,792) → Expect resistance.
🔹 Trade Setups
Entry 1 (Aggressive Long at Weekly Demand)
Entry: 24,365
SL: 23,935
Risk: 430
Target: 25,655
Reward: 1,290
RR: 3.0
Entry 2 (Conservative Long at Daily Demand)
Entry: 24,164
SL: 23,935
Risk: 229
Target: 25,454
Reward: 1,290
RR: 5.6
Combined Average Plan
Entry Avg: 24,265
SL: 23,935
Risk: 330
Target: 25,555
Reward: 1,290
RR: 3.9
✅ NIFTY Strategy Conclusion
Trend Alignment:
HTF, MTF, ITF all show BUY DEMAND zones → bias is bullish.
GANN View:
Stay Long above 23,452–23,362 (strong base support).
Risk of short only if breaks below 23,273.
Trade Execution:
Best Risk-Reward: Entry 2 at 24,164, RR = 5.6
Average Plan balances both: RR = 3.9
Target Zones:
Near-term target = 25,454–25,655
Beyond that → watch for breakout >25,655 for trend continuation.
👉 My take: The higher conviction trade is Entry-2 (24,164), since it has the tightest SL (229 pts) with the highest RR (5.6), while still aligning with all demand zones.
Nifty Hits Resistance; Volatility Looms Ahead of Monthly ExpiryReason Behind the Fall
The Indian market snapped its six-session winning streak on Friday as investors turned cautious ahead of US Federal Reserve Chair Jerome Powell’s speech at the Jackson Hole symposium.
Concerns over the upcoming 25% US tariffs, set to take effect on August 27, further added to market volatility.
Importantly, Powell signalled in his remarks on Friday that the Federal Reserve is likely to cut interest rates in September.
Technical Setup
The Nifty faced rejection from the key resistance zone of 25,000–25,100, which may trigger further downside towards 24,500–24,400.
OI Data Analysis
Open interest data shows significant call writing at 25,000, reinforcing it as a strong resistance for the upcoming monthly expiry.
On the downside, 24,800 is emerging as immediate support with notable put writing. If this level fails to hold, the next support is likely near 24,500.
Suggested Strategy
With the additional tariff deadline approaching alongside monthly expiry, heightened volatility is expected.
Traders are advised to stay cautious and adopt a wait-and-watch approach until the index provides clear directional cues.
Nifty August 4th week AnalysisNifty is looking positive and it is expected to continue last week's momentum , but it will face some resistance moving forward at 25050-25100. If Nifty sustains above these levels, then we can expect momentum to continue upto 25350-460 . But if it fails to cross and sustain above 25050-25100 range, then we can expect sell-on rise keeping Nifty range-bound and volatile throughout the week.
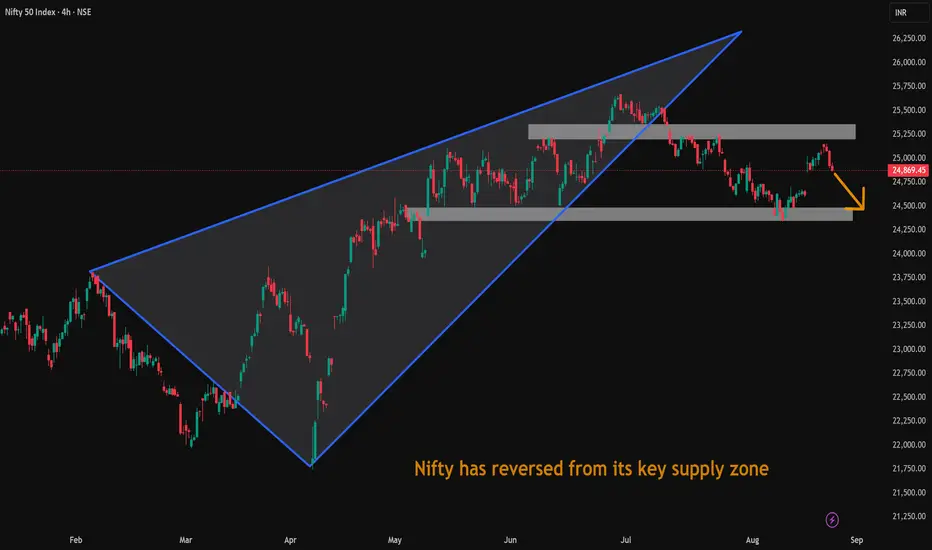
Nifty has reversed from its key supply zonePrice has broken Triangular pattern and currently Nifty has reversed from its key supply zone.
Nifty Analysis EOD – August 22, 2025 – Friday🟢 Nifty Analysis EOD – August 22, 2025 – Friday 🔴
Bears finally break the wall — wiping out 4 sessions’ gains
🗞 Nifty Summary
Yesterday, we noted:
“Though the close is higher by +33 points vs the previous day, it left behind a red daily candle (close < open). This indicates fading bullish momentum, even though HH-HL structure is still intact. The range was narrow (≈98 points), categorising the day as range-bound, not sideways. The previous weekly expiry was also narrow yet sideways.”
That caution proved valid today. Right from the opening candle, Nifty broke the PDL + S1 zone, invalidating the HH-HL structure and giving bears a clean entry. The past two sessions’ range contraction added fuel to the breakdown, resulting in a 225-point fall.
The attempted defense at 24,995, 24,955, 24,920, and 24,890 provided only temporary halts, but the downside momentum was too strong. The day ended at 24,869.45, erasing gains of the last 4 sessions.
On the weekly chart, the index now resembles a bearish pin bar / inverted hammer, a sign of exhaustion at the top.
📌 For Monday:
If Nifty fails to hold 24,850–24,820, then 24,745 and 24,650 come into play.
Bulls must reclaim and close above 24,955 to hold their fort.
🛡 5 Min Intraday Chart with Levels
📌 Intraday Walk
Opened at 25,064.15 with mild optimism.
First 1-min candle → broke PDL + S1 decisively → bears in control.
Gradual fall → temporary fights at 24,995 → 24,955 → 24,920 → 24,890, but all failed.
Closing print at 24,870.10, almost at the day’s low.
📉 Daily Time Frame Chart with Intraday Levels
🕯 Daily Candle Breakdown
Open: 25,064.15
High: 25,084.85
Low: 24,859.15
Close: 24,870.10
Change: −213.65 (−0.85%)
🏗️ Structure Breakdown
Strong red candle (Close < Open)
Body: 194.05 points
Upper wick: 20.70 points
Lower wick: 10.95 points
Full-body bearish bar → strong downside momentum
📚 Interpretation
Sellers seized control after three days of stalling at 25,150–25,180.
Break below 25,000 confirms supply dominance.
Closing near day’s low = no recovery attempt → decisive distribution.
🕯️Candle Type
Bearish Marubozu-style → clear trend shift to sellers.
🛡 5 Min Intraday Chart
⚔️ Gladiator Strategy Update
ATR: 198.19
IB Range: 134.25 → Medium
Market Structure: ImBalanced
Trade Highlight:
9:20 → Short Trigger → Target Achieved (R:R = 1:2).
🕵️Range & Bias
Support zone: 24,850–24,820
Resistance zone: 25,000–25,080
Bias: Bearish momentum → “Sell on rise” until 25k is reclaimed.
📌 Support & Resistance Levels
🎚️ Resistance Zones
24,920
24,955
24,995 ~ 25,005
25,080 ~ 25,090
🎚️ Support Zones
24,850 ~ 24,820
24,770
24,745
24,695 ~ 24,675
💡 Final Thoughts
The market has shifted gears from cautious bullish to outright bearish, with 25,000 now acting as a supply zone. Unless bulls reclaim lost ground above 24,955–25,000, the slide toward 24,745–24,650 seems inevitable.
“Markets climb the stairs but take the elevator down — today, the elevator arrived.”
✏️ Disclaimer
This is my personal analysis — not investment advice. Please consult your financial advisor before trading.

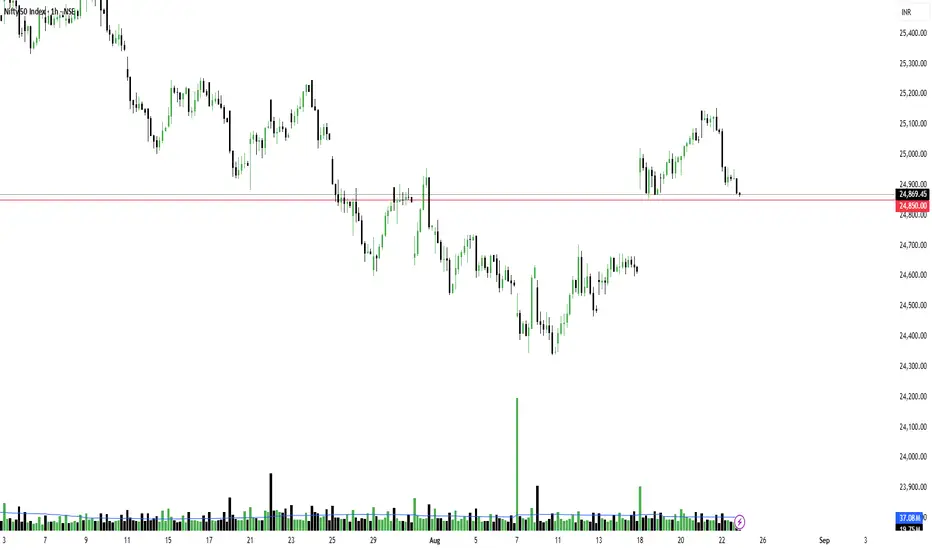
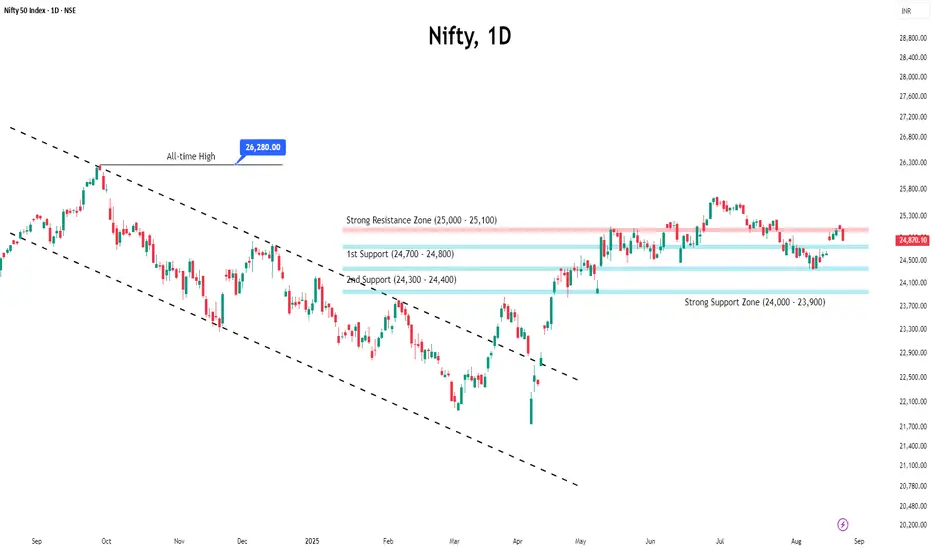
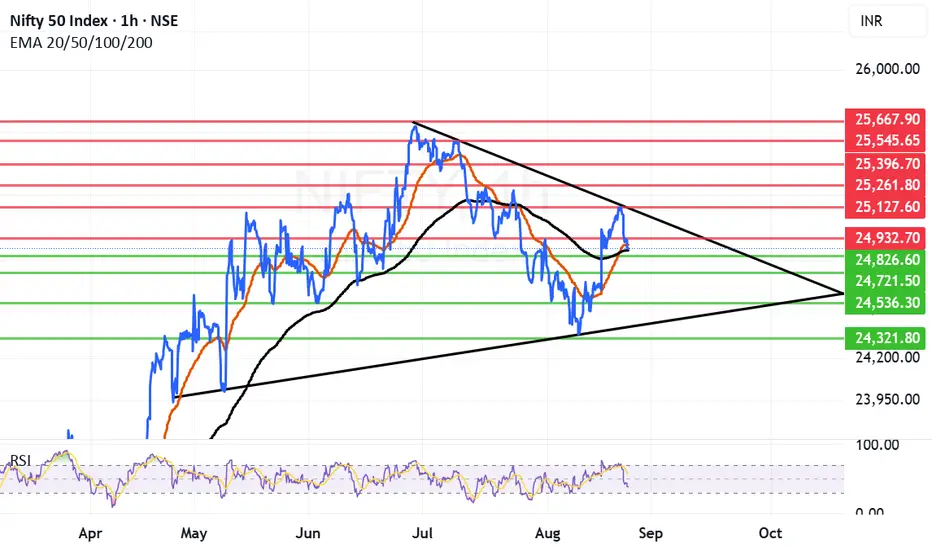
Trendline topples Nifty which is now searching for support now. Trendline resistance has toppled Nifty which is now searching for support from where it can launch a recovery. For a recovery Nifty has to find a firm support which can act as a launchpad again for next phase of move.
If the support is not found in the relevant support zone it can again fall in bear grip. The support zone nearby starts from 24857 (Father line) and a zone nearby which is at 24826. If we get a closing below 24826 then Nifty can fall towards 24721, 24536 or even 24321 levels. 24321 seems to be a strong trendline support.
If Nifty takes support near 24857 or 24826 then (Today's low was 24859) the Nifty can go upwards. In this scenario the resistances for Nifty will be at 24892 (Mother line Resistance), 24932, 25127 (trendline resistance), 25261, 25396, 25545 and finally 25667. After closing above 25261 the Bulls will be back in business.
Disclaimer: The above information is provided for educational purpose, analysis and paper trading only. Please don't treat this as a buy or sell recommendation for the stock or index. The Techno-Funda analysis is based on data that is more than 3 months old. Supports and Resistances are determined by historic past peaks and Valley in the chart. Many other indicators and patterns like EMA, RSI, MACD, Volumes, Fibonacci, parallel channel etc. use historic data which is 3 months or older cyclical points. There is no guarantee they will work in future as markets are highly volatile and swings in prices are also due to macro and micro factors based on actions taken by the company as well as region and global events. Equity investment is subject to risks. I or my clients or family members might have positions in the stocks that we mention in our educational posts. We will not be responsible for any Profit or loss that may occur due to any financial decision taken based on any data provided in this message. Do consult your investment advisor before taking any financial decisions. Stop losses should be an important part of any investment in equity.
Nifty levels - Aug 25, 2025Nifty support and resistance levels are valuable tools for making informed trading decisions, specifically when combined with the analysis of 5-minute timeframe candlesticks and VWAP. By closely monitoring these levels and observing the price movements within this timeframe, traders can enhance the accuracy of their entry and exit points. It is important to bear in mind that support and resistance levels are not fixed, and they can change over time as market conditions evolve.
The dashed lines on the chart indicate the reaction levels, serving as additional points of significance to consider. Furthermore, take note of the response at the levels of the High, Low, and Close values from the day prior.
We hope you find this information beneficial in your trading endeavors.
* If you found the idea appealing, kindly tap the Boost icon located below the chart. We encourage you to share your thoughts and comments regarding it.
Wishing you success in your trading activities!

NIFTY KEY LEVELS FOR 22.08.2025NIFTY KEY LEVELS FOR 22.08.2025
If the candle stays above the pivot point, it is considered a bullish bias; if it remains below, it indicates a bearish bias. Price may reverse near Resistance 1 or Support 1. If it moves further, the next potential reversal zone is near Resistance 2 or Support 2. If these levels are also broken, we can expect the trend.
If the range(R2-S2) is narrow, the market may become volatile or trend strongly. If the range is wide, the market is more likely to remain sideways
📢 Disclaimer
I am not a SEBI-registered financial adviser.
The information, views, and ideas shared here are purely for educational and informational purposes only. They are not intended as investment advice or a recommendation to buy, sell, or hold any financial instruments.
Please consult with your SEBI-registered financial advisor before making any trading or investment decisions.
Trading and investing in the stock market involves risk, and you should do your own research and analysis. You are solely responsible for any decisions made based on this research.