nifty chartnifty fibonacci retracement, gann square of 144, gann fan all indicates the same low of election result day. nifty may fall to gann 144 level 22390 on 16 july 2024.
NIFTY trade ideas

Nifty is following this channel in 15 min tf nifty is in consolidation phase as we have a new 6M & 3M candle the next month
many time i give multiple updates in a single day so use end button to reach the latest update if idea become lengthy

NIFTY BREAKS SUPPORTRecently, the NIFTY has been consistently reaching new highs, but today it broke below the previous day's low and the critical level of 22400. The next support is at 22338. If this level is breached under selling pressure, we could see levels between 23200 and 23000. Post Monday, NIFTY will likely reach a confirmation level; until then, it is advisable to reduce positions. One may consider buying after an uptrend is confirmed, but until then, reducing long positions is recommended.

Nifty towards 23800 or 23200 ? cmp 23550NIFTY View - cmp 23550
Nifty loosing momentum but sustaining above the levels.
Expecting some Profit booking, *closing below 25500 will lead to the nearest support of 23205 - 23263
Next Major Support 22720 - 22850
Sustaining above 23500 will lead further UP move around 23830
Resistance levels 23590 - 23640
Plan your trades accordingly

NIFTY - Possibility of trend exhaustionOn hourly time frame, there is a possibility of an ending diagonal formation. The same when formed can act as a strong confirmation of an ending.
Watch out for today's high to be tested by a marginal increase.

NIFTY TRADING LEVELS FOR 21-06-2024Explanation:
This is a very useful trading system. This means that you should not take a trade blindly, but rather that there is another confirmation to take the trade you can use this for perfect entry and perfect exit
This trading opportunity is based on volume, previous price, and price range , are included
Entry/Exit point's:
- It has very easy entry and exit points
- In this pair of lines with two colors are given (RED AND BLUE)
- In this the blue line is used to take long entry and the red line is used to take short entry (But it is all based on a more conformation from your trading plan)
Stop Loss/Take Profit:
Stop Loss
- According to this, if you take a long trade, its stop loss will be the red line just below ( A trade can exit either when the price crosses the red line or the 5 minute candlestick crosses the red line. (This can be done according to your preference) )
- A short entry should use the opposite rules to a long entry
Take Profit
-When you take a long entry according to the profit to be booked is on the next red line above. ( Or if there are other reasons, it can be a safe exit )
- Opposite rules for booking profit on long entry are to book profit on short trade. ( The blue line above is the stop loss of short entry )
Timeframe:
According to this, the time frame you should use while taking trades is 5 minutes time frames . (5 minute time frame works well in this)
Risk Disclaimer:
Trading carries significant risk and is not suitable for all traders. You may lose some or all of your capital in a matter of minutes or hours. Market conditions can change rapidly, and prices can move against you quickly. You may not always be able to exit at a favorable price, and you may be required to hold a position overnight, exposing yourself to additional risk. Day trading involves high risk, high leverage, and high stakes, and you should only trade with funds you can afford to lose. Please carefully consider your financial situation, risk tolerance, and trading objectives before engaging in day trading.
Engagement:
Share your insights, ask questions, and learn from others in the community. Whether you're a seasoned pro or just starting out, we're all in this together.
What's your take on the current market conditions? Which trading strategies are working for you? Let's discuss and help each other grow as traders!
Comment below and let's get the conversation started!
Original Content:
This trading setup is the result of my own innovation and expertise, and is not based on any publicly available information or third-party systems. It is a reflection of my dedication to developing a competitive edge in the markets.

NIFTY- Intraday Levels - 21st June 2024If NIFTY sustain above 23601 or 23633 above this bullish then 23738 to 23753 above this more bullish
If NIFTY sustain below 23539 or 23528 then 23503 to 23493 then 23466 then 23449 to 23435 below this bearish then 23419 to 23407 below this more bearish
Consider some buffer points in above levels.
Please do your due diligence before trading or investment.
**Disclaimer -
I am not a SEBI registered analyst or advisor. I does not represent or endorse the accuracy or reliability of any information, conversation, or content. Stock trading is inherently risky and the users agree to assume complete and full responsibility for the outcomes of all trading decisions that they make, including but not limited to loss of capital. None of these communications should be construed as an offer to buy or sell securities, nor advice to do so. The users understands and acknowledges that there is a very high risk involved in trading securities. By using this information, the user agrees that use of this information is entirely at their own risk.
Thank you.

NIFTY - On the verge of a correction There is a possibility that the market is being interrupted by the intersection of two strong resistances (mid-trend line intersection) which calls for a correction in the monthly time frame.
However, the penultimate move is yet to be completed.
The market is about to test the previous day's low @23,442.60 & after that, there will be a struggling upward move testing again at 23,664. The correction progresses from there to the 21,280 ~ 21,200 levels
Today support for the upcoming penultimate move will be,
SI - 23,442.60
SII - 23,435 ~ 417
SIII - 23,382
NO recommended SL for this trade setup (Any substantial increase above 22,664, calls off the trade).
The resistance to the final move is 23,664 & is expected to surpass the said levels by a minimum margin.
Trade accordingly.

NIFTY INTRADAY LEVELS FOR 21/06/2024
BUY ABOVE - 23580
SL - 23500
TARGETS - 23650,23730,23800
SELL BELOW - 23500
SL - 23580
TARGETS - 23430,23370,23300
NO TRADE ZONE - 23500 to 23580
Previous Day High - 23650
Previous Day Low - 23430
Based on price action major support & resistance's are here, the red lines acts as resistances, the green lines acts as supports. If the price breaks the support/resistance, it will move to the next support/resistance line. White lines indicates previous day high & low, high acts as a resistance & low acts as a support for next day.
Trendlines are also significant to price action. If the price is above/below the trendlines, can expect an UP/DOWN with aggressive move.
Please NOTE: this levels are for intraday trading only.
Disclaimer - All information on this page is for educational purposes only,
we are not SEBI Registered, Please consult a SEBI registered financial advisor for your financial matters before investing And taking any decision. We are not responsible for any profit/loss you made.
Request your support and engagement by liking and commenting & follow to provide encouragement
HAPPY TRADING 👍

NIFTY : Trading Levels and Plan for 21-Jun-2024Opening Scenarios
Gap Up Opening (100+ points)
Initial Observation:
- If the market opens with a gap up above the resistance level of 23,723:
- Observe price action for the first 15-30 minutes to determine market sentiment.
- If the price sustains above 23,723, it could signal strong bullish momentum.
- If the market opens around 23,691 but below 23,723:
- Watch for resistance at 23,723. If it fails to break, it might lead to a pullback.
Trading Strategy:
- Above 23,723:
- Buy on Breakout: Enter long positions above 23,723 with a target of 23,858.
- Stop Loss: Place a stop loss at 23,680 to manage risk.
- Between 23,691 and 23,723:
- Range Trading: Consider short positions near 23,723 if there are signs of reversal (e.g., bearish candlestick patterns).
- Stop Loss: Place a stop loss above 23,740.
- Target: Aim for a pullback to 23,691 or lower.
Flat Opening
Initial Observation:
- If the market opens flat around 23,579.15:
- Observe the price action within the highlighted orange zone (between 23,616 and 23,553.00).
Trading Strategy:
- Range Trading:
- Short Positions: If the price fails to break above 23,616 and shows signs of reversal, consider short positions.
- Target: Aim for 23,553.00 or lower.
- Stop Loss: Place a stop loss above 23,616.
- Long Positions:
- If the price finds support at 23,553.00:
- Buy: Enter long positions targeting 23,616.
- Stop Loss: Place a stop loss below 23,553.00.
Gap Down Opening (100+ points)
Initial Observation:
- If the market opens with a gap down below 23,553.00:
- Watch for support around 23,481 and 23,409.
Trading Strategy:
- Below 23,553.00 but Above 23,481:
- Short Positions: If the price shows weakness and fails to reclaim 23,553.00, consider short positions.
- Target: Aim for 23,481.
- Stop Loss: Place a stop loss above 23,553.00.
- Around 23,481:
- Long Positions: If there are signs of support and reversal at 23,481, consider long positions.
- Target: Aim for 23,553.00 or 23,616.
- Stop Loss: Place a stop loss below 23,481.
- Below 23,481:
- If the price continues to drop, look for strong support around 23,409.
- Long Positions: Enter at 23,409 if there are reversal signals.
- Target: Aim for a recovery to 23,481 or higher.
- Stop Loss: Place a stop loss below 23,409.
Summary and Conclusion
- For a gap up opening, focus on levels 23,691 and 23,723 for potential breakouts or reversals.
- For a flat opening, trade within the range of 23,616 and 23,553.00.
- For a gap down opening, monitor support levels at 23,553.00, 23,481, and 23,409 for potential entries.
Disclaimer
I am not a SEBI registered analyst. This trading plan is based on technical analysis and is intended for educational purposes only. Trading in financial markets involves substantial risk, and you should perform your own research or consult a financial advisor before making any trading decisions.
```


15 min channel break strategynifty working in ascending channel if this channel breaks big is expected .

NIFTY- Intraday Levels - 18th June 2024If NIFTY sustain above 23475 then 23507 then 23520 then 23520 to 23539 or 23555 above this bullish then 23603 to 23610 then 23634 to 23641 above this more bullish
If NIFTY sustain below 23445 then 23419 below this bearish then 23366 then 23341 to 23334 or 23315 below this more bearish
Consider +/- 32 points buffer in above levels.
Please do your due diligence before trading or investment.
**Disclaimer -
I am not a SEBI registered analyst or advisor. I does not represent or endorse the accuracy or reliability of any information, conversation, or content. Stock trading is inherently risky and the users agree to assume complete and full responsibility for the outcomes of all trading decisions that they make, including but not limited to loss of capital. None of these communications should be construed as an offer to buy or sell securities, nor advice to do so. The users understands and acknowledges that there is a very high risk involved in trading securities. By using this information, the user agrees that use of this information is entirely at their own risk.
Thank you.

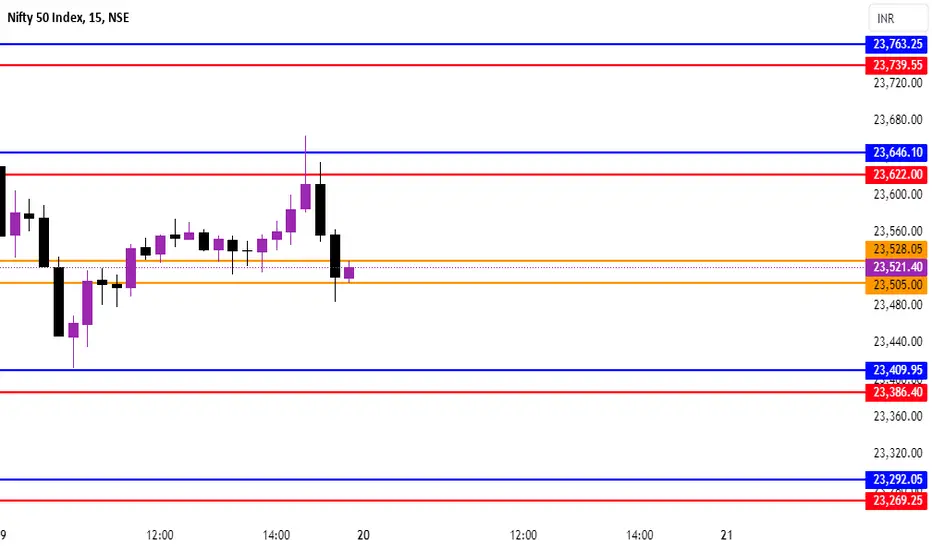
NIFTY- Intraday Levels - 20th June 2024If NIFTY sustain above 23523 then 23581 then 23629 to 23633 then 23665 to 23670 then 23685 to 23701 above this bullish
If NIFTY sustain below 23502 then 23471 to 23466 then 23429 to 23419 or 23393 below this bearish
Consider some buffer points in above levels.
Please do your due diligence before trading or investment.
**Disclaimer -
I am not a SEBI registered analyst or advisor. I does not represent or endorse the accuracy or reliability of any information, conversation, or content. Stock trading is inherently risky and the users agree to assume complete and full responsibility for the outcomes of all trading decisions that they make, including but not limited to loss of capital. None of these communications should be construed as an offer to buy or sell securities, nor advice to do so. The users understands and acknowledges that there is a very high risk involved in trading securities. By using this information, the user agrees that use of this information is entirely at their own risk.
Thank you.

NIFTY TRADING LEVELS FOR 16-06-2024Explanation:
This is a very useful trading system. This means that you should not take a trade blindly, but rather that there is another confirmation to take the trade you can use this for perfect entry and perfect exit
This trading opportunity is based on volume, previous price, and price range , are included
Entry/Exit point's:
- It has very easy entry and exit points
- In this pair of lines with two colors are given (RED AND BLUE)
- In this the blue line is used to take long entry and the red line is used to take short entry (But it is all based on a more conformation from your trading plan)
Stop Loss/Take Profit:
Stop Loss
- According to this, if you take a long trade, its stop loss will be the red line just below ( A trade can exit either when the price crosses the red line or the 5 minute candlestick crosses the red line. (This can be done according to your preference) )
- A short entry should use the opposite rules to a long entry
Take Profit
-When you take a long entry according to the profit to be booked is on the next red line above. ( Or if there are other reasons, it can be a safe exit )
- Opposite rules for booking profit on long entry are to book profit on short trade. ( The blue line above is the stop loss of short entry )
Timeframe:
According to this, the time frame you should use while taking trades is 5 minutes time frames . (5 minute time frame works well in this)
Risk Disclaimer:
Trading carries significant risk and is not suitable for all traders. You may lose some or all of your capital in a matter of minutes or hours. Market conditions can change rapidly, and prices can move against you quickly. You may not always be able to exit at a favorable price, and you may be required to hold a position overnight, exposing yourself to additional risk. Day trading involves high risk, high leverage, and high stakes, and you should only trade with funds you can afford to lose. Please carefully consider your financial situation, risk tolerance, and trading objectives before engaging in day trading.
Engagement:
Share your insights, ask questions, and learn from others in the community. Whether you're a seasoned pro or just starting out, we're all in this together.
What's your take on the current market conditions? Which trading strategies are working for you? Let's discuss and help each other grow as traders!
Comment below and let's get the conversation started!
Original Content:
This trading setup is the result of my own innovation and expertise, and is not based on any publicly available information or third-party systems. It is a reflection of my dedication to developing a competitive edge in the markets.
Nifty Levels for 20.06.2024As Mentioned Earlier Nifty Crossed Exactly our level and Hit Target 1
Now at Pivot Level and the Next Support and Resistance are Mentioned Below
Support 1 - 23480
Support 2 - 23420
Resistance 1 - 23610
Resistance 2 - 23680

Nifty Facing Strong resistance from a probable temporary top.Nifty Facing is seemingly facing Strong resistance from a probable temporary top. The high of today 23664 will not be easy to cross for now as the shift in the mood seems to be of profit booking. However if you look at FII and DII numbers very both positive and Nifty ended in negative. This can also be an indication of sectoral shift from the big players towards some large caps and other underperforming sectors from some sectors which were popular since last 2 to 3 months. Chemicals, Selective IT and Banking seem to be picking up steam. Resistance at the upper side are at 23579, 23664 and 23751. Supports on the lower side seem to be at 23491, 23364 (Important support) Mother line 50 hours EMA, 23336, 23201, 23050 and finally 22908. Below 22908 bears will take control of the market.

Nifty Secret This indicator has been catching profitable
Comment below and let's get the conversation

NIFTY- Intraday Levels - 19th June 2024If NIFTY sustain above 23539 then 23559 to 23579 then 23612 to 23629 or 23649 above this bullish then 23711 to 23756 then 23811 to 23829 then 23885 to 23903 above this more bullish
If NIFTY sustain below 23509 or 23489 or 23466 then 23427 to 23407 below this bearish then 23358 to 23340 or 23325 below this more bearish
Consider some buffer points in above levels.
Please do your due diligence before trading or investment.
**Disclaimer -
I am not a SEBI registered analyst or advisor. I does not represent or endorse the accuracy or reliability of any information, conversation, or content. Stock trading is inherently risky and the users agree to assume complete and full responsibility for the outcomes of all trading decisions that they make, including but not limited to loss of capital. None of these communications should be construed as an offer to buy or sell securities, nor advice to do so. The users understands and acknowledges that there is a very high risk involved in trading securities. By using this information, the user agrees that use of this information is entirely at their own risk.
Thank you.

NIFTY INTRADAY LEVELS FOR 20/06/2024BUY ABOVE - 23580
SL - 23500
TARGETS - 23650,23730,23800
SELL BELOW - 23500
SL - 23580
TARGETS - 23430,23370,23300
NO TRADE ZONE - 23500 to 23580
Previous Day High - 23650
Previous Day Low - 23430
Based on price action major support & resistance's are here, the red lines acts as resistances, the green lines acts as supports. If the price breaks the support/resistance, it will move to the next support/resistance line. White lines indicates previous day high & low, high acts as a resistance & low acts as a support for next day.
Trendlines are also significant to price action. If the price is above/below the trendlines, can expect an UP/DOWN with aggressive move.
Please NOTE: this levels are for intraday trading only.
Disclaimer - All information on this page is for educational purposes only,
we are not SEBI Registered, Please consult a SEBI registered financial advisor for your financial matters before investing And taking any decision. We are not responsible for any profit/loss you made.
Request your support and engagement by liking and commenting & follow to provide encouragement
HAPPY TRADING 👍

NIFTY : Trading Levels and Plan for 20th June 20241. Opening Scenarios:
Gap Up Opening (+100 points or more)
Resistance Zones to Watch:
Opening Resistance: 23,716 - 23,683
Profit Booking Zone: 23,844 - 23,811
Trading Strategy:
If the index opens above 23,621 and sustains:
Wait for a retest of the 23,716 - 23,683 zone. If it holds as support, consider entering long positions targeting the Profit Booking Zone (23,844 - 23,811).
If the index fails to hold above the 23,716 - 23,683 zone, wait for a possible pullback to the No Trade Zone (23,561 - 23,541). Avoid trades within this zone.
Flat Opening (around 23,521)
No Trade Zone: 23,561 - 23,541
Key Levels:
Resistance: 23,716 - 23,683
Support: 23,498
Trading Strategy:
If the index opens flat and moves above 23,561:
Look for long opportunities targeting 23,716 - 23,683 initially, and then 23,844 - 23,811 if the resistance is broken.
If the index opens flat and moves below 23,541:
Look for short opportunities targeting the support at 23,498 and then further down to 23,403 if the selling pressure continues.
Gap Down Opening (-100 points or more)
Support Zones to Watch:
Opening Support: 23,403
Buyer's Support: 23,293 - 23,242
Last Buyer’s Support for Trend Reversal: 23,137
Trading Strategy:
If the index opens below 23,421:
Wait for a retest of the 23,403 support. If it holds, consider long positions targeting the No Trade Zone (23,561 - 23,541).
If the index breaks below 23,403, look for short opportunities targeting 23,293 - 23,242. A break below this level can lead to further downside towards 23,137.
Summary:
Gap Up Opening: Look for long positions above 23,716 targeting 23,844 - 23,811.
Flat Opening: Trade within the No Trade Zone cautiously, with long positions above 23,561 and short positions below 23,541.
Gap Down Opening: Focus on key support levels 23,403, 23,293 - 23,242, and 23,137 for possible trend reversals.
Conclusion:
Monitor the opening price and early movements carefully. Adhere to the specified support and resistance levels to make informed trading decisions. Adjust your strategy based on real-time market behavior and ensure proper risk management.
Disclaimer:
I am not a SEBI registered analyst. This trading plan is based on my analysis and is intended for educational purposes only. Please do your own research or consult with a financial advisor before making any trading decisions. Trading in financial markets involves substantial risk and is not suitable for every investor.

NIFTY S/R for 20/6/24Support and Resistance Levels: In technical analysis, support and resistance levels are significant price levels where buying or selling interest tends to be strong. They are identified based on previous price levels where the price has shown a tendency to reverse or find support.
Support levels are represented by the green line and green shade, indicating areas where buying interest may emerge to prevent further price decline.
Resistance levels are represented by the red line and red shade, indicating areas where selling pressure may arise to prevent further price increases. Traders often consider these levels as potential buying or selling opportunities.
Breakouts: Breakouts occur when the price convincingly moves above a resistance level (red shade) or below a support level (green shade). A bullish breakout above resistance suggests the potential for further price increases, while a bearish breakout below support suggests the potential for further price declines. Traders pay attention to these breakout signals as they may indicate the start of a new trend or significant price movement.
Disclosure: I am not SEBI registered. The information provided here is for learning purposes only and should not be interpreted as financial advice. It is important to consult with a qualified financial advisor before making any investment decisions. Tweets neither advice nor endorsement.

Nifty50 #TechnicalAnalysis #StockMarket #IndexAnalysis #Fib**Nifty 50 Index Technical Analysis - June 2024**
The Nifty 50 index closed at **₹23,632.20** on June 18, 2024, showing a modest gain of 0.32%. The technical outlook for Nifty indicates a critical juncture, with a potential for both further upside and downside risks.
### **Technical Patterns and Indicators:**
#### **Price Channels:**
- **Ascending Channel:** Nifty has been trading in a well-defined ascending channel since September 2023, with the current resistance zone near **₹24,210.85** (upper blue line) and immediate support around **₹22,814.20**.
- **Trend Lines:** The lower trend line support at **₹21,372.85** and upper resistance trend line at **₹24,494.85** highlight key levels to watch for potential breakout or breakdown scenarios.
#### **Fibonacci Levels:**
- **Retracement Levels:** The key Fibonacci retracement levels are as follows:
- **23.6% at ₹21,372.85**
- **38.2% at ₹20,893.15**
- **50% at ₹20,505.45**
- **61.8% at ₹20,117.75**
These levels will be critical in identifying potential support and resistance zones.
#### **Projected Targets:**
- **Upside:** A bullish breakout above **₹24,210.85** could propel the index towards **₹25,126.85** and ultimately to the 1.618 extension at **₹26,572.10**. A more ambitious target lies at **₹27,090.40**.
- **Downside:** Failure to hold current levels could see Nifty retest supports at **₹22,148.20**, with further downside targets near **₹21,133.55** and significant correction down to **₹20,505.45**.
#### **Gap Analysis:**
- A gap previously noted around **₹20,505.45** has been filled, indicating that the market has absorbed prior volatility at these levels. Monitoring for new gaps will be essential for forecasting future price action.
#### **Volume and RSI:**
- **Volume:** The recent trading volume shows heightened activity, which may suggest growing interest or caution among traders. Sustained volume increases could affirm the breakout direction.
- **RSI:** Currently at **63.68**, RSI shows the index is approaching overbought territory but still has room for upward movement. A move beyond 70 may indicate overbought conditions and a potential for a pullback.
### **Fundamental Considerations:**
- **Economic Outlook:** Positive economic indicators and strong corporate earnings have been supportive of Nifty’s upward trend. Any shifts in macroeconomic data, central bank policies, or geopolitical developments could impact future performance.
- **Sector Performance:** Rotations between sectors (e.g., IT, Finance, FMCG) could drive index performance. Keeping an eye on leading and lagging sectors will provide insights into overall market health.
### **Summary:**
Nifty 50 is positioned at a crucial technical level, with potential for a significant move either direction. Traders should watch the upper resistance around **₹24,210.85** and lower support near **₹22,148.20**. Breakout or breakdown from these levels, combined with volume and RSI trends, will guide the next major market direction.
📊 #Nifty50 #TechnicalAnalysis #StockMarket #IndexAnalysis #Fibonacci #Volume #RSI #MarketTrends
