Channel breakoutChannel breakout + sustained above 22250. If it remain above 22250 by EOD. There might be good upward move till 22750.
NIFTY trade ideas

#Nifty Trading Important levelsOn 1 Hour Timeframe, NIFTY trading important levels. Time to wait for either breakout or Breakdown (reversal) for the Nifty.
Breakdown Move
- Confirmation for breakdown will be if Nifty starts trading and sustain below 22220 level
- Downside rally nearly 500 points expected in case of breakdown
- Intermediate support expected near 21880- level
- Short Trader can place there stop loss if Nifty starts trading above 22250 level
Breakout move
- Long side movement expected in case Nifty starts trading and sustain above 22250 level
- Above this level Nifty can go upto the 22760+ level.
- Intermediate resistance expected near 22580 level
- Long trader can place there stop loss if Nifty starts trading below 22220 level.

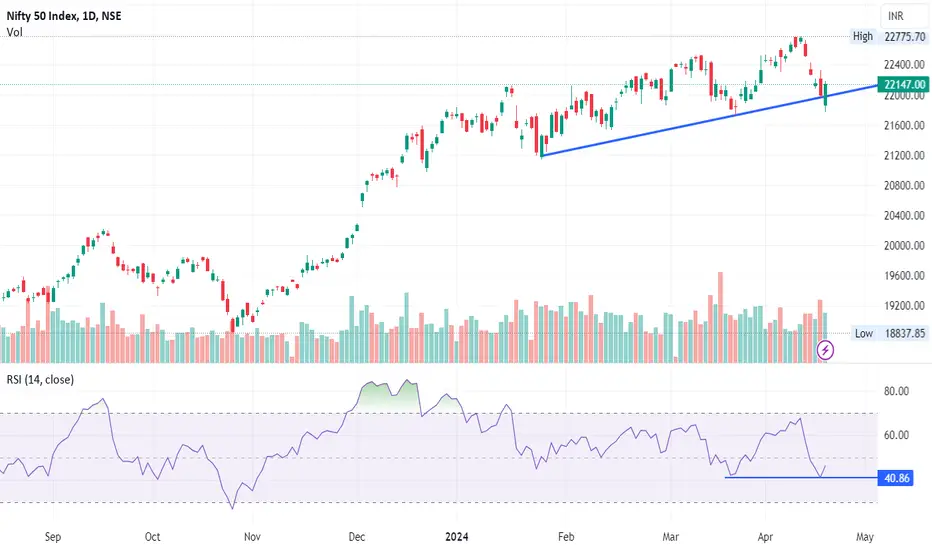
Nifty Short, Medium & Long Term View- 22-Apr-24 to 26-Apr-24Nifty Short, Medium & Long Term View- 22-Apr-24 to 26-Apr-24
Nifty closed at 22147(22519) and touched low & high of 21804 & 22413
Nifty gone down last week. As told last week nifty fell and broke the support provided at 22000/ 21900 and bounced back on last day above the support and settled at 22147.
RSI and stochastics levels was down last week(41% & <20% Respectively). Near to oversold zone. Can expect a come back rally next week.
Refer to detailed comments in the bottom on market and election outcome.
Nifty IT broke the Major support at 34918 /34000 last week and went upto 32919. Can be added for short rally as it fell sharply, however for medium term clear break above 38000 needed to further move up. Future of technology stocks are in high pressure due to AI as it is reflecting in US and Indian technology stocks. Especially Indian IT stocks is in a non decisive path and downtrend.
Nifty bank 47556 (48565) - Nifty bank was down inline with nifty last week. Many bank stocks are buyable zone. Canara bank, ICICI Bank can be accumulated.
Medium term support is at 44598 if breaks major support at 43650 ( Fib Support). To continue buy on dips.
Nifty 22147- Short & medium term (Neutral)
Market need to decisively close above 22800 to move up further. Expected a short rally after last week downside. As mentioned in the past month, nifty almost reached the near term target 22819 (Fibonacci extended resistance target) and started falling ( 22819 Target- which is the % of difference between Oct21 Peak -Jun22 Low from Oct 21 peak/23000).
Short term support 22000/21800
Medium term Support - 21721 (Mar Low),21554 (Fib Support),21300, 20877 Fib Support as shown in the chart.
Long Term
Market expected range bound between 23300 ( Trend Line Resistance till May 2024) to 20225 / 20000 ( Fib Resistance),19500 expected in 2024.
Q3 results are average except bank & Nbfc stocks, further up move will have target of 23150 ( Trend Line), 23500 ( Fib Resistance). Market Awaiting for the Q4 results to take a cue.
Comments :
Positive Lok Sabha Election result expectation, Global trend helped sustaining the market above 22000.
Recent Electoral bonds, CAA implementation news couldnt make the market down as market is confident that current govt will win more than halfway mark, continue govt post election without any additional support of other parties so that govt can be confident enough to take decisions.
Hence market is in good buy whenever there is a dip. Post Elections, only way Market will start grow higher by reduction of interest rate by RBI on a staggered manner till it reaches 5%. US fed rate reduction also expected from Jun/ Sep 2024. Market may correct if any global news till 19500 as there is strong multiple fib support in this range.
Earlier last 2-3 months, purchasing/holding Nifty IT at lower levels proved effective as the Nifty IT index as it moved up by 20%. Nifty IT posted flat or negative results in Q3. Nifty IT touched new high on 16-Feb-24 (38477). Target 40000.
Similarly despite nifty bank results for Q3 were good as expected, Nifty Bank index was down by 10% last three-Four weeks. Nifty Bank Index was suggested to buy two weeks before. Nifty Bank in nearing the target provided (48600). Nifty Bank Stocks / Bank Index can be purchased whenever it falls down. HDFC bank is now in buyable range, can be further bought if it further dips for Medium to Long Term. Continue to buy on dips.
As expected, stocks other than Banks have posted mixed results. Market can any time expected to turn volatile till elections in 2024 (Apr-May). Company Earning per share (EPS) are near to maximum level, expected policy / budgetary push to move up further in 2024. Individual stock pick will be the key in 2024.

Hammer OR not?Well technically both the candles do not fit the definition of a hammer where the wick has to be double the length of the real body. But the price action is the same. The previous swing is tested. Almost. Now it's time to test the previous high.

#NIFTY Intraday Support and Resistance Levels -22/04/2024Nifty will be gap up opening in today's session. After opening nifty sustain above 22170 level and then possible upside rally up to 22290 level in today's session. in case nifty trades below 22130 level then the downside target can go up to the 22010 level.

Nifty Intraday for 22 April We saw a V-shaped recovery in Friday's trading session, but it came after a considerable downfall throughout the week, so it was hard to trust this recovery. It might be a dead cat bounce or a trap; however, as intraday traders, we must engage in trading regardless of the market's behaviour. Only rule-based traders can thrive in this bearish market.

NIFTY INTRADAY LEVELS FOR 22/04/2024BUY ABOVE - 22160
SL - 22100
TARGETS - 22210,22270,22320
SELL BELOW - 22100
SL - 22160
TARGETS - 22050,22000,21960
NO TRADE ZONE - 22100 to 22160
Previous Day High - 22160
Previous Day Low - 21800
Based on price action major support & resistance's are here, the red lines acts as resistances, the green lines acts as supports. If the price breaks the support/resistance, it will move to the next support/resistance line. White lines indicates previous day high & low, high acts as a resistance & low acts as a support for next day.
Trendlines are also significant to price action. If the price is above/below the trendlines, can expect an UP/DOWN with aggressive move.
Please NOTE: this levels are for intraday trading only.
Disclaimer - All information on this page is for educational purposes only,
we are not SEBI Registered, Please consult a SEBI registered financial advisor for your financial matters before investing And taking any decision. We are not responsible for any profit/loss you made.
Request your support and engagement by liking and commenting & follow to provide encouragement
HAPPY TRADING 👍

Nifty at crucial supportNifty at key support level. Though a rebound is seen from trendline support the week ahead will give further picture. If it sustains above the level we may possibly see an uptrend. Else it may further go down.

NIFTY Levels and Trading Plan for April 22, 2024
Gap Up Opening Above 22,250:
If NIFTY opens with a gap up above 22,250 and sustains above this level, while finding support around 22,240, a buying opportunity may arise with targets at 22,392 – 22,475. However, if it fails to hold above 22,250 and trades below 22,290 with resistance at 22,240, consider a short trade with a stop loss at 22,250 and targets of 22,050 – 22,000 – 21,977.
Flat Opening:
In case of a flat opening, if NIFTY faces initial resistance near 22,240 and trades below 22,200, consider a short trade with a stop loss at 22,250 and targets of 22,050 – 21,980. Conversely, if it sustains above 22,240 and finds support, consider a buying opportunity with a stop loss at 22,220 and targets of 22,307 – 22,392.
Gap Down Opening Below 22,050:
In the scenario of a gap down opening below 22,050, anticipate initial downward movement with a potential buying opportunity near 21,980 – 21,863, targeting 22,239 – 22,240 – 22,300. Only consider short trades if prices drop below 21,863 – 21,850 with a stop loss at 22,100 and targets of 21,675 – 21,600.
Conclusion:
NIFTY is poised for various scenarios on April 22, 2024, with potential trading opportunities based on opening price actions. Traders should remain vigilant and adapt their strategies accordingly to capitalize on market movements.
Disclaimer:
Trading in financial markets involves risk and may not be suitable for all investors. The provided trading plan is for informational purposes only and does not constitute financial advice. Traders should conduct their own research and consult with a qualified financial advisor before making any investment decisions.

Nifty more to comeNIFTY in expanding triangle,
Weak below 21520-580 zone, till then bulls are active
Expecting Nifty to touch 22400 next

Nifty Supply and Demand zone on 1 hour time frame.Mark the supply and Demand zone until it breaks it either side. zones are created on 1 hour time frame.


Nifty not longNifty is at trend deciding zone once again
22300 going to be strong resistance on the upside
21940 will act as a support, below which it opens the door to 21500 this time

NIFTY- Intraday Levels - 22nd April 2024If NIFTY sustain above 22177 then 22258 to 22276 or 22283 to 22301 strong level above this bullish then 22370 to 22395 or 22425 above this more bullish
If NIFTY sustain below 22122 then 22060 to 22035 then 22028 to 22019 below this bearish then 21954 to 21948 or 21929 to 21904 below this more bearish
Consider some buffer points in above levels.
Please do your due diligence before trading or investment.
**Disclaimer -
I am not a SEBI registered analyst or advisor. I does not represent or endorse the accuracy or reliability of any information, conversation, or content. Stock trading is inherently risky and the users agree to assume complete and full responsibility for the outcomes of all trading decisions that they make, including but not limited to loss of capital. None of these communications should be construed as an offer to buy or sell securities, nor advice to do so. The users understands and acknowledges that there is a very high risk involved in trading securities. By using this information, the user agrees that use of this information is entirely at their own risk.
Thank you.


NIFTY: Another Upmove Starts!Nifty
Nifty is overall Bullish in Weekly timeframe. Some corrections may come, but now it is standing on below support trendline.
Wait for some bullish pattern when it retests the Support Trendline and then you can go for an upmove.
Bullish pattern
1. Bullish engulfing
2. Hammer

Nifty took a critical support at 21777. (A number to watch)Nifty fell like a hot knife going through butter slab reacting to Iran Israel news. There was some respite today as Nifty has takena support at 21777 and bounced back to close the week at 22147 staging a remarkable recovery. 21777 will remain a critical support to watch for reminder of the month. In case this support is not held further supports will be only between the range of 21157 and 20973. If 20973 is further falls casualty to any escalation between Iran and Israel, we still have a strong support near 20592 which is also a Mid channel support. If by chance mid channel support is broken there can be a free fall towards 20237 or even 18878 levels if situation worsens. On the positive side of it if 21777 is respected we can further see resistances near 22318, 22514 and ATH resistance near 22775 levels. Things are delicately poised but let us hope peace prevails and we see nifty bouncing back drastically in the coming week or weeks. Local sentiments still remain good except for the fact that some FIIs are not happy with tax heavens status withdrawal from Mauritius. Global factors specially related to Israel and Iran are governing the global sentiments currently.

NIFTY DAILY - 19/4/2024Nifty opens gap down almost -150 points but into second half bulls were back into the market and made days high that is 22179.
(which means nifty recover 150 points from bottom and another rally of 150 points which means total nifty recovered by 300 points).
Nifty has formed a big green body candle with long lower shadow and upper shadow, which indicates buyer were buying from day ends.
Index is able to give closing above trendline.
Nifty is taking support around 40 RSI level.
Nifty reclaim 22000 level and able to break the resistance level which was 22152 so further resistance can be 22276 with support of 221936 level.
Today’s Advance Decline ratio of NIFTY50
Advance - 30
Decline - 19
Unchanged - 1
FII Buy + 129.39 crores
DII Sell – 52.50 crores.
⚠️ Important: Always maintain your Risk & Reward Ratio.
✅Like and follow to never miss a new idea!✅
Disclaimer: I am not SEBI Registered Advisor. My posts are purely for training and educational purposes.
Eat🍜 Sleep😴 TradingView📈 Repeat 🔁
Happy learning with trading. Cheers!🥂
Nifty bounce from Rising channel lower boundary Multiple times price bounce from AVWAP and nifty50 price follow a rising channel and today bounce rising channel lower boundary , above todays high nifty may be test its upper boundary .

NIFTY S/R for 22/4/24Support and Resistance Levels: In technical analysis, support and resistance levels are significant price levels where buying or selling interest tends to be strong. They are identified based on previous price levels where the price has shown a tendency to reverse or find support.
Support levels are represented by the green line and green shade, indicating areas where buying interest may emerge to prevent further price decline.
Resistance levels are represented by the red line and red shade, indicating areas where selling pressure may arise to prevent further price increases. Traders often consider these levels as potential buying or selling opportunities.
Breakouts: Breakouts occur when the price convincingly moves above a resistance level (red shade) or below a support level (green shade). A bullish breakout above resistance suggests the potential for further price increases, while a bearish breakout below support suggests the potential for further price declines. Traders pay attention to these breakout signals as they may indicate the start of a new trend or significant price movement.
Disclosure: I am not SEBI registered. The information provided here is for learning purposes only and should not be interpreted as financial advice. It is important to consult with a qualified financial advisor before making any investment decisions. Tweets neither advice nor endorsement.

trading levels for nifty 19-04-2024// use 5mtf
// i give 6 pairs of lines colored red and blue . if you have any more conformations you can take tardes form that areas

NIFTY- Intraday Levels - 19th April 2024If NIFTY sustain above 22105 to 22127 then 22212 then 22270 to 22326 above this more bullish
If NIFTY sustain below 21961 then 21913 then 21832 to 21795 or 21764 then 21714 to 21701 below this bearish then 21629 to 21560 then then 21511 to 21463 or 21407 below this more bearish
Consider some buffer points in above levels.
Please do your due diligence before trading or investment.
**Disclaimer -
I am not a SEBI registered analyst or advisor. I does not represent or endorse the accuracy or reliability of any information, conversation, or content. Stock trading is inherently risky and the users agree to assume complete and full responsibility for the outcomes of all trading decisions that they make, including but not limited to loss of capital. None of these communications should be construed as an offer to buy or sell securities, nor advice to do so. The users understands and acknowledges that there is a very high risk involved in trading securities. By using this information, the user agrees that use of this information is entirely at their own risk.
Thank you.

Nifty why Buying going on..After the gap down, nifty exactly bounced back from buying point.. will it really sustain? or SELL ON RISE will prevail..??
