NIFTY trade ideas

view on nifty 50Technical analysis View on nifty 50,
support levels according to fibonacci retracements are as follows
0.236% - 21636 - 1st support
0.382% - 21114 - 2nd support
0.5% - 21678 - 3rd support
0.618% - 20200 - 4th support this level is also 10% from top i.e. 22500

NIFTY S/R for 18/3/24Support and Resistance Levels: In technical analysis, support and resistance levels are significant price levels where buying or selling interest tends to be strong. They are identified based on previous price levels where the price has shown a tendency to reverse or find support.
Support levels are represented by the green line and green shade, indicating areas where buying interest may emerge to prevent further price decline.
Resistance levels are represented by the red line and red shade, indicating areas where selling pressure may arise to prevent further price increases. Traders often consider these levels as potential buying or selling opportunities.
Breakouts: Breakouts occur when the price convincingly moves above a resistance level (red shade) or below a support level (green shade). A bullish breakout above resistance suggests the potential for further price increases, while a bearish breakout below support suggests the potential for further price declines. Traders pay attention to these breakout signals as they may indicate the start of a new trend or significant price movement.
Keltner Channel: The Keltner Channel is a technical indicator that uses an exponential moving average (EMA) and an average true range (ATR) to create an upper and lower channel around the price action. The upper line of the channel represents the upper limit of the average range, and the lower line represents the lower limit. Traders can use the Keltner Channel to identify potential long and short positions.
Long Position: A long position may be considered when the price is trading above the upper line of the Keltner Channel. This suggests that the price is trading above the average range and may continue in an upward trend, potentially offering buying opportunities.
Short Position: A short position may be considered when the price is trading below the lower line of the Keltner Channel. This suggests that the price is trading below the average range and may continue in a downward trend, potentially offering selling opportunities.
Disclosure: I am not SEBI registered. The information provided here is for learning purposes only and should not be interpreted as financial advice. It is important to consult with a qualified financial advisor before making any investment decisions. Tweets neither advice nor endorsement.

NIFTY 50 Nifty shows negative traits in daily timeframe, firstly it activated 5 Ema trade and secondly it give the breakdown of trend line. As we all know market faces the many hindrance i.e. international tension, electoral bond issue, few days back SEBI chief says "we are in bubble"
all these traits try to make negative impact in the market.

Daily market analysis for Monday 18th MarchDaily Show on NIFTY, BANKNIFTY, FINNIFTY and USDINR, where we try and predict the market direction for tomorrow by technical analysis, Open Interest (OI) data analysis, FII DII data analysis and much more. This show gives insights into the market and is especially useful if you are a beginner who has just started options trading and wants to learn how to trade using price action and other chart techniques.
Disclaimer: This is not an investment recommendation, advice, research report, or stock tip of any nature. We are doing this only to understand how to read derivative data and perform technical analysis. Strictly for educational purposes only.
#nifty50 #banknifty #nifty50prediction #usdinr #optionstradingstrategy #technicalanalysis #tradingforbeginners #niftyprediction #sharemarkettrading #niftytomorrow #marketpredictiontoday #priceaction #usdinrprediction #niftytechnicalanalysis #tradingchartanalysis #usdinrtradingstrategytomorrow #openinterest


nifty weekly target 22800 by 15th march Buy around 22400
target 22800 by 15th mar 2024
sl daily close below 22200
Disclaimer:
This is my personal opinion and is only for educational purposes. Please consult your financial advisor before making any decision.


nifty trade setup 15 march 2024nifty is on support hoping to get the W pattern made entry the SL is very small with good target
lets see if it hit target or SL

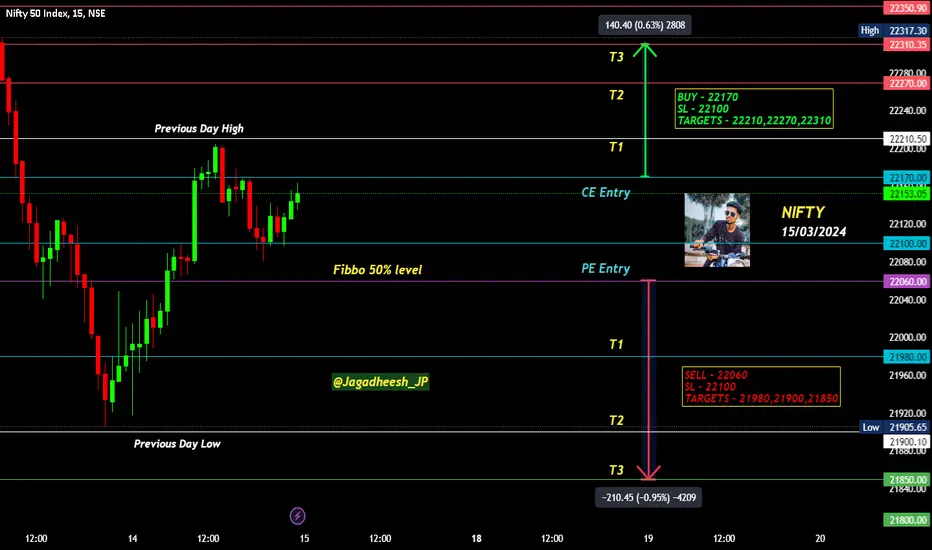
NIFTY INTRADAY LEVELS FOR 15/03/2024BUY ABOVE - 22170
SL - 22100
TARGETS - 22210,22270,22310
SELL BELOW - 22060
SL - 22100
TARGETS - 21980,21900,21850
NO TRADE ZONE - 22060 to 22170
Previous Day High - 22210
Previous Day Low - 21900
Based on price action major support & resistance's are here, the red lines acts as resistances, the green lines acts as supports. If the price breaks the support/resistance, it will move to the next support/resistance line. White lines indicates previous day high & low, high acts as a resistance & low acts as a support for next day.
Trendlines are also significant to price action. If the price is above/below the trendlines, can expect an UP/DOWN with aggressive move.
Please NOTE: this levels are for intraday trading only.
Disclaimer - All information on this page is for educational purposes only,
we are not SEBI Registered, Please consult a SEBI registered financial advisor for your financial matters before investing And taking any decision. We are not responsible for any profit/loss you made.
Request your support and engagement by liking and commenting & follow to provide encouragement
HAPPY TRADING 👍
#NIFTY Intraday Support and Resistance Levels -15/03/2024Nifty will be gap up opening in today's session. After opening nifty sustain above 22170 level and then possible upside rally up to 22290 level in today's session. in case nifty trades below 22130 level then the downside target can go up to the 22010 level.

niftyNIFTY LEVELS.....
Thanks to everyone for follow and appreciate....
Happy Profitable trading ......
Note:
This isn't financial advice, (not a buy or sell signal). This is only Knowledge sharing based on my knowledge and my risk management . Before following any ideas, do your own research and practice good risk management as of your financial status.

Good Fightback by bulls but need a confirmation candle tomorrow.We saw a good fightback by Bulls today as the Nifty bounced back from just close to 50 days EMA but to ensure that this was the temporary bottom we need a confirmation candle to close the week. The Resistance for Nifty will remain at 22204 and 22311 followed by 22500 range. Supports for Nifty will remain at 21851, 21779 and 21614. Below 21614 again the bears will take over. Shadow of the candle today is very dull but slightly positive however as it is a weekly closing candle due to Friday bears will also try to close the Nifty in their favour. Nifty is again interestingly poised.

$niftynice bounce from the 21 ema on D3
close back within range so lets see if it continues up
23500 still my guess before elections so going to add some IF we get lower
DiXie bounced from 102 and now at resistance so if it gets hammered down expecting this to resume up


All INDEX key levels for March 14, 2024 #Nifty #BankNiftyAll INDEX key levels for March 13, 2024 #Nifty #BankNifty
Overview:
Today's trading session presented significant opportunities within the Bank Nifty index and we executed the trades based on the levels published yesterday on tradingview and we were able to capture the Fall of 500 points in BankNifty
Here are the key levels to watch for potential entry and exit points in
BANKNIFTY
Resistance Levels:
- Refer the Red line on the chart
Support Levels:
- Refer the Green line on the chart
Trading Strategy:
- Long Position:
Consider initiating long positions near support levels only after reversal confirmation for potential upside movement.
- Short Position:
Consider initiating short positions near resistance levels only after reversal confirmation for potential downside movement.
Risk Management:
- Always use stop-loss orders to protect against adverse market movements.
- Consider position sizing based on risk tolerance and account equity.
Disclaimer:
These levels are provided for informational purposes only and should not be considered as financial advice. Trading involves risk, and past performance is not indicative of future results. Always conduct your own research and consult with a qualified financial advisor before making any investment decisions.
Thanks

NIFTY DAILY - 14/3/2024Indian indices open at previous day closing and rebounded sharply after yesterday’s fall.
Nifty has formed big green body candle with upper and lower shadow.
Candle is formed below 9 days Exponential Moving Average line.
Further levels for nifty will be 21831 level will work as support and resistance will be 22381 level.
Today’s Advance Decline ratio of NIFTY50
Advance - 37
Decline - 13
FII Sell – 1356.29 crore
DII Buy + 139.47 crore.
⚠️ Important: Always maintain your Risk & Reward Ratio.
✅Like and follow to never miss a new idea!✅
Disclaimer: I am not SEBI Registered Advisor. My posts are purely for training and educational purposes.
Eat🍜 Sleep😴 TradingView📈 Repeat 🔁
Happy learning with trading. Cheers!🥂

Daily market analysis for tomorrow 15th MarchDaily Show on NIFTY, BANKNIFTY, FINNIFTY and USDINR, where we try and predict the market direction for tomorrow by technical analysis, Open Interest (OI) data analysis, FII DII data analysis and much more. This show gives insights into the market and is especially useful if you are a beginner who has just started options trading and wants to learn how to trade using price action and other chart techniques.
Disclaimer: This is not an investment recommendation, advice, research report, or stock tip of any nature. We are doing this only to understand how to read derivative data and perform technical analysis. Strictly for educational purposes only.
#nifty50 #banknifty #nifty50prediction #usdinr #optionstradingstrategy #technicalanalysis #tradingforbeginners #niftyprediction #sharemarkettrading #niftytomorrow #marketpredictiontoday #priceaction #usdinrprediction #niftytechnicalanalysis #tradingchartanalysis #usdinrtradingstrategytomorrow #openinterest


Nifty Master StartFirst time we share master chart our market going to side ways with violent move upcoming month after break out 25k will hit mid of 2024

NIFTY S/R for 15/3/24Support and Resistance Levels: In technical analysis, support and resistance levels are significant price levels where buying or selling interest tends to be strong. They are identified based on previous price levels where the price has shown a tendency to reverse or find support.
Support levels are represented by the green line and green shade, indicating areas where buying interest may emerge to prevent further price decline.
Resistance levels are represented by the red line and red shade, indicating areas where selling pressure may arise to prevent further price increases. Traders often consider these levels as potential buying or selling opportunities.
Breakouts: Breakouts occur when the price convincingly moves above a resistance level (red shade) or below a support level (green shade). A bullish breakout above resistance suggests the potential for further price increases, while a bearish breakout below support suggests the potential for further price declines. Traders pay attention to these breakout signals as they may indicate the start of a new trend or significant price movement.
Keltner Channel: The Keltner Channel is a technical indicator that uses an exponential moving average (EMA) and an average true range (ATR) to create an upper and lower channel around the price action. The upper line of the channel represents the upper limit of the average range, and the lower line represents the lower limit. Traders can use the Keltner Channel to identify potential long and short positions.
Long Position: A long position may be considered when the price is trading above the upper line of the Keltner Channel. This suggests that the price is trading above the average range and may continue in an upward trend, potentially offering buying opportunities.
Short Position: A short position may be considered when the price is trading below the lower line of the Keltner Channel. This suggests that the price is trading below the average range and may continue in a downward trend, potentially offering selling opportunities.
Disclosure: I am not SEBI registered. The information provided here is for learning purposes only and should not be interpreted as financial advice. It is important to consult with a qualified financial advisor before making any investment decisions. Tweets neither advice nor endorsement.

NIFTY50Pair : NIFTY 50 Index
Description :
Rising Wedge as an Corrective Pattern in Short Time Frame with the Breakout of Lower Trend Line and Retracement
Break of Structure
RSI - Divergence
Completed " 12345 " Impulsive Waves
